


This study investigates the relationship between moisture content in cohesive soils and critical slope failure angles during spontaneous liquefaction. We adapted the liquid limit test apparatus, originally developed by A. Atterberg in 1911, into a liquid-flow limit test apparatus. Soils from three actual cases of slope failures were used in experiments. The moisture content at which soils undergo spontaneous liquefaction was designated as the flow limit (FL), corresponding to the downslope angle of circular failure. This value represents the critical sliding angle due to soil saturation and the maximum slope angle for exposed mudrock or clay slopes. Beyond this critical FL angle, all vegetation is susceptible to loss due to soil liquefaction. The consistent test results observed reaffirm that different soils exhibit similar spontaneous liquefaction angles and FL behaviour.
Notation
Introduction
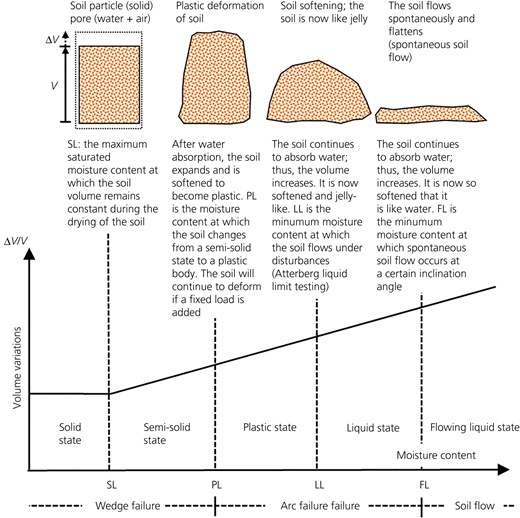
Slope failure is often induced by various environmental factors such as geology and geography. Depending on the slope conditions and the environment, there will be different scales and frequencies of damages. This study primarily focuses on the relationship between soil moisture content and the critical slope failure angle in the case of spontaneous liquefaction-induced failure in cohesive soils. Reviewing previous studies of this kind, it is noted that the physical state of the soil varies with different moisture contents. The ability to define the flow deformation of soil relates to the consistency of the soil. In soil mechanics, soil consistency is defined by the various moisture content limits proposed by Atterberg (1911), a Swedish agronomist. The definitions and failure modes of these limits are described as follows, as shown in Figure 1.
Shrinkage limit (SL). It is the moisture content at which the soil changes from a semi-solid to a solid state. It is the maximum moisture saturated content at which the soil volume remains constant during the drying of the soil.
Plastic limit (PL). It is the moisture content at which the soil changes from a semi-solid state to a plastic body. It is the maximum moisture content at which the soil can be rolled into a thread with a diameter of 0.125 inch (0.32 cm) and cracking starts to occur on its surface. When the soil moisture content ω is smaller than the PL, wedge failure occurs. In contrast, when ω exceeds the PL, onion-peeling arc failure occurs.
Liquid limit (LL). It is the moisture content at which the soil changes from a plastic body to a liquid soil. It is the minimum moisture content at which the soil flows under disturbances. When the soil moisture content ω is smaller than the LL, weak arc failure occurs. Soils at the LL are some of the most common soils included in diaphragm walls during construction.
Flow limit (FL). It is the moisture content at which the soil changes from a liquid soil to a flowing liquid. It is the minimum moisture content at which spontaneous soil flow occurs at a certain inclination angle. When ω is greater than the FL, flow failure occurs.
Varnes (1978) proposed slope failure categories according to slope movement modes, which can be divided into falls, topples, slides, spreads, flow, complex destruction and so on, and material types, which can be separate into rocks and engineering soils. Lis et al. (2014) sorted out the categories and drew schematic diagrams of various damage states. Chen (1999) proposed that it was difficult to predict landslides due to various factors such as rainfall intensity, rainfall duration, geological conditions, topography, slope aspect and slope gradient. The situations of debris flows are diverse in different regions; therefore, understanding the characteristics is critical to conduct the study.
Related studies of soil moisture limits include the study by Lin and Wang (1999). This study created a physical model on a water tank to examine the influence of pore water pressure on the occurrence of landslides under different water supply modes.
Liao (2013) used artificial simulated rainfall tests to point out that the soil moisture content will reach the FL and spread when the rainfall exceeds 50 mm in Xiaolin Village, Jiaxian District, Kaohsiung City, where the slope gradient is between 30 and 40°.
Zhang (2022) modified the compaction test to simulate the phenomenon of water absorption and softening of the heavy-loaded sediment in the cracks of a broken mudstone layer. This test was carried out using the weathered mudstone sedimentation soil in Jianshanli, Yanchao District, Kaohsiung City. Zhang (2022) used a regression equation to calculate the time for the infiltration water content to reach the FL and determined the rationality of the actual occurrence time of deep mudstone spreading.
Rahardjo et al. (2001) evaluated the relative importance of several control parameters in assessing the instability of homogeneous soil slopes under different conditions (e.g. soil properties, rainfall intensity, initial depth of groundwater table and slope geometry). Soil properties, especially saturated hydraulic conductivity and rainfall intensities, were found to be the primary controlling factors for slope instability caused by rainfall.
Jiang and Cui (2022) analysed the mechanism of instability of a high-LL soil slope under rainfall conditions through field monitoring and numerical simulation of the K79+880 section of the Guang-Le expressway in Guangdong Province, China. For a high-LL soil, as the rainfall intensity increases, the matric suction at the top of the slope increases, making it more susceptible to shallow landslides, but it has little effect on the deep sliding surface.
Zhou et al. (2022) performed numerical simulation of slope instability by using the FLAC3D software, considering the slope gradient, temperature distribution, internal friction angle, cohesion and pore water pressure distribution. They demonstrate that as the surface temperature rises, the thawing depth expands and liquified water gradually accumulates at the freeze–thaw interface, causing a reduction in the shear strength of the permafrost region. The increase in pore water pressure reduces the effective stress in the soil, leading to slope instability in the permafrost region.
According to previous research, this study proposes that mountainous debris flows are composed of weathered and fragmented rock layers interspersed with sediments. These sediments undergo softening upon reaching their moisture content limit, ultimately leading to the collapse and flow of the soil mass. To validate this corresponding relationship further, the study has notably enhanced the Atterberg apparatus, resulting in the development of the Atterberg liquid-flow limit test apparatus. A series of experiments were then conducted on on-site soil samples from actual slope failure incidents, investigating the relationship between moisture content and the sliding angle. The conclusion was drawn that there exists a unique relationship between the FL (defined as the minimum moisture content at which cohesive soils undergo spontaneous liquefaction) and its critical sliding angle. This concept has practical applications in determining the maximum stable slope for exposed mudrock or cohesive soil slopes.
Materials and methods
Development of FL instruments
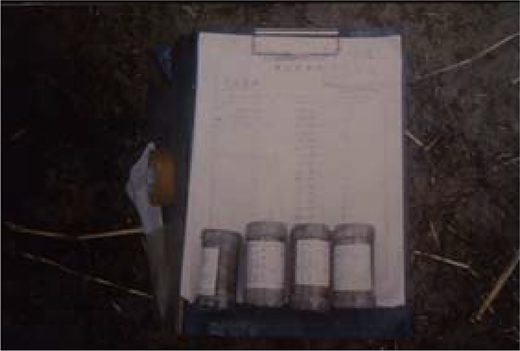
In the previous analogy, when a man slips on mud and his feet are covered with mud, the failure surface is between the mud beneath his shoes and the mud on the ground. Similarly, a debris flow consists of soil, the ω of which has already reached FL. Hence, the soil flows in the form of a debris flow. Therefore, the inclined board used in the FL experiment could be either a wooden one or a frosted glass plate. The only requirements were that the soil should be able to be adhered to it and that the failure surface must be a soil surface when a soil flow occurs. In this study, an Atterberg LL–FL instrument (Figures 1(b), 2(a), and 3(a) and 3(b)) is designed based on the Atterberg LL instrument by marking the required inclination angle of the frosted glass plate and considering the soil weight obtained using the standard penetration test (SPT) of soil samples in copper cylinders collected by drilling (Figure 4).
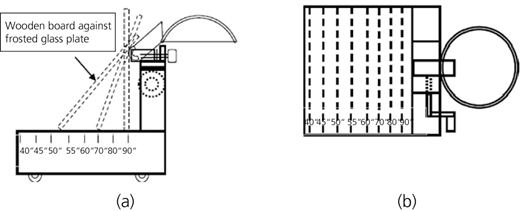
(a) Cross-sectional diagram of an Atterberg LL–FL instrument; (b) top-view diagram of an Atterberg LL–FL instrument
(a) Cross-sectional diagram of an Atterberg LL–FL instrument; (b) top-view diagram of an Atterberg LL–FL instrument
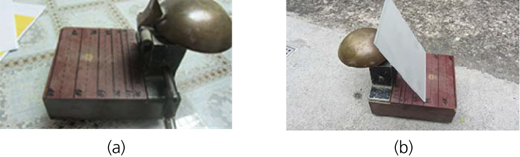
(a) Atterberg LL–FL instrument; (b) Atterberg LL–FL instrument with a frosted glass plate
(a) Atterberg LL–FL instrument; (b) Atterberg LL–FL instrument with a frosted glass plate
Wooden board against frosted glass plate
The copper cylinder used for SPT has an inner diameter of 3.1 cm and a height of 7.0 cm. It can contain 110–120 g of moist soil. Since there is less soil in the sample in the copper cylinder, the 45 × 30 cm wooden board originally used in the FL experiment is changed to a 12 × 15 cm frosted glass plate (it is the same frosted glass as the one used in the PL experiment; the maximum static friction coefficient of a wooden board is similar to that of a frosted glass plate: both are roughly 0.4), as shown in Figures 2(a) and 2(b).
Proportionally lighter soil used according to areal changes
In the original experiment using wooden boards, about 1 kgf of soil sieved through number 40 meshes was used. The area of the plate shrinked by (45 × 30)/(12 × 15) = 7.5 times; thus, only 1 kg × 1000 g/7.5 = 133.3 g of soil was used. There was no significant differences between the two.
Atterberg LL–FL instrument
As shown in Figures 2(a) and 5(b), on the base of the Atterberg LL instrument, the bottom lines at which the inclined frosted glass plate should be placed are drawn. The lines provide inclination angles of 40–90°. In this way, the Atterberg LL instrument can be used to measure the FL and θFL of soil.
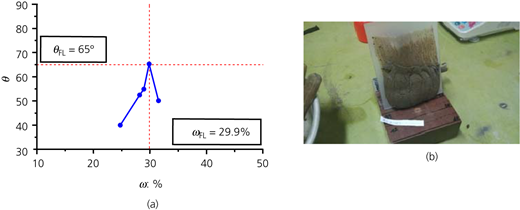
(a) Plot of θ (°) against ω (%) (Jiangong Road case 2); (b) Jiangong Road case 2 soil
(a) Plot of θ (°) against ω (%) (Jiangong Road case 2); (b) Jiangong Road case 2 soil
FL and θ FL measurements using the LL–FL instrument
To prove that the FL and θ FL obtained using the LL–FL instrument are unique for the soil under investigation, a total of 18 different types of soils were examined to repeat and re-produce the measurements. The results are summarised in Table 1. The corresponding FL curves and photographs of the experiments are provided in Figures 5–12. The FL values obtained by using a frosted glass plate are essentially consistent with those of a wooden board. The range of θ FL obtained by using a wooden board is approximately 8–10° smaller (Tables 2 and 3). Field measurements were taken of the flow failure angles of the side slopes of mudstones in Yan-Chao District after a landslide, and vane shear tests were performed to measure the strengths of the failure surfaces. In addition, samples were collected (Figure 13).
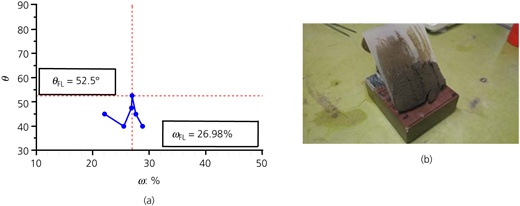
(a) Plot of θ (°) against ω (%) (Jiangong Road case 1); (b) Jiangong Road case 1 soil
(a) Plot of θ (°) against ω (%) (Jiangong Road case 1); (b) Jiangong Road case 1 soil
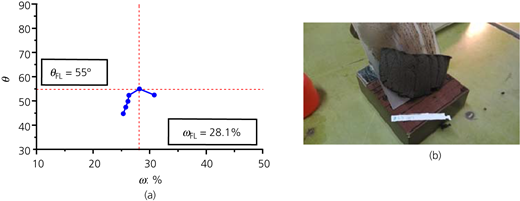
(a) Plot of θ (°) against ω (%) (Jiangong Road case 3); (b) Jiangong Road case 3 soil
(a) Plot of θ (°) against ω (%) (Jiangong Road case 3); (b) Jiangong Road case 3 soil
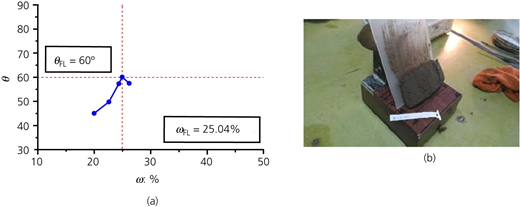
(a) Plot of θ (°) against ω (%) (Jiangong Road case 4); (b) Jiangong Road case 4 soil
(a) Plot of θ (°) against ω (%) (Jiangong Road case 4); (b) Jiangong Road case 4 soil
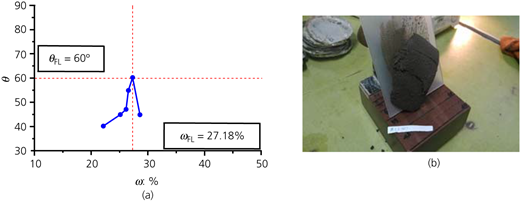
(a) Plot of θ (°) against ω (%) (Jiangong Road case 5); (b) Jiangong Road case 5 soil
(a) Plot of θ (°) against ω (%) (Jiangong Road case 5); (b) Jiangong Road case 5 soil
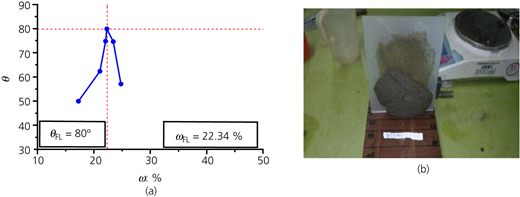
(a) Plot of θ (°) against ω (%) (Jiangong Road case 9); (b) Jiangong Road case 9 soil
(a) Plot of θ (°) against ω (%) (Jiangong Road case 9); (b) Jiangong Road case 9 soil
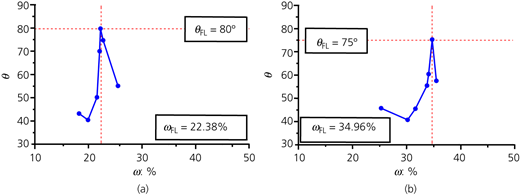
(a) Plot of θ (°) against ω (%) (Jianguo Road case 1); (b) plot of θ (°) against ω (%) (Jianguo Road case 2)
(a) Plot of θ (°) against ω (%) (Jianguo Road case 1); (b) plot of θ (°) against ω (%) (Jianguo Road case 2)
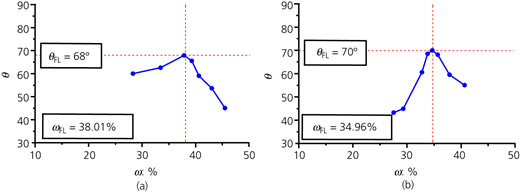
(a) Plot of θ (°) against ω (%) (Feng-Shan case 1); (b) plot of θ (°) against ω (%) (Feng-Shan case 2)
(a) Plot of θ (°) against ω (%) (Feng-Shan case 1); (b) plot of θ (°) against ω (%) (Feng-Shan case 2)
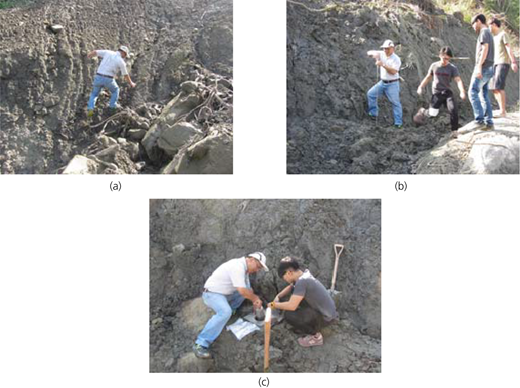
(a) Field measurements of the flow failure angles of the side slopes of mudstones in Yan-Chao District (7 April 2017); (b) vane shear tests for measuring the undrained shear strengths of the failure surfaces of mudstones in Yan-Chao District (7 April 2017); (c) density determination and sampling of mudstones in Yan-Chao District (7 April 2017)
(a) Field measurements of the flow failure angles of the side slopes of mudstones in Yan-Chao District (7 April 2017); (b) vane shear tests for measuring the undrained shear strengths of the failure surfaces of mudstones in Yan-Chao District (7 April 2017); (c) density determination and sampling of mudstones in Yan-Chao District (7 April 2017)
FL results (Jiangong Road case 1)
| Test item | Jiangong Road case 1 | |||||
|---|---|---|---|---|---|---|
| Moisture content: % | 22.11 | 25.50 | 26.88 | 26.98 | 27.63 | 28.83 |
| Failure angle: ° | 45 | 40 | 47.5 | 52.5 | 45 | 40 |
| Cup weight: g | 7.69 | 6.90 | 7.73 | 7.19 | 7.18 | 6.84 |
| Moist soil + cup: g | 14.76 | 13.29 | 15.33 | 15.38 | 15.08 | 14.57 |
| Dry soil + cup: g | 13.48 | 11.99 | 13.72 | 13.64 | 13.37 | 12.84 |
Atterberg limit results for silt samples from mudstones in Yan-Chao District, Kaohsiung City (LL results obtained using glass plates)
| SL: % | PL: % | LL: % | FL (by using glass plates): % | θ FL: ° | |
|---|---|---|---|---|---|
| Test 1 | 17.07 | 20.7 | |||
| Test 2 | 15.78 | 28.56 | |||
| Test 3 | 15.29 | 14.96 | 26.43 | 24.35 | 63 |
| Test 4 | 18.57 | 29.24 | 33.13 | 62 | |
| Test 5 | 16.13 | 18.44 | 25.7 | ||
| Test 6 | 15.995 | 18.19 | 24.51 | 17.81 | 65 |
| Average after removing the largest and smallest values | 15.95 | 18.06 | 25.55 | 33.13 | 62 |
Atterberg limit results for silt samples from mudstones in Yan-Chao District, Kaohsiung City (LL results obtained using wooden boards)
| SL: % | PL: % | LL: % | FL: % | θ FL: ° | |
|---|---|---|---|---|---|
| Test 1 | 17.00 | 20.00 | 25.30 | 35.00 | 70 |
| Test 2 | 15.40 | 19.00 | 22.40 | 36.00 | 55 |
| Test 3 | 15.70 | 18.00 | 23.20 | 42.00 | 40 |
| Test 4 | 14.60 | 13.70 | 23.70 | 32.00 | 53 |
| Test 5 | 15.63 | 21.00 | 23.60 | 26.00 | 50 |
| Test 6 | 13.00 | 17.00 | 22.70 | 33.00 | 58 |
| Test 7 | 23.00 | 21.00 | 21.50 | 23.00 | 60 |
| Test 8 | 19.00 | 14.00 | 16.00 | 37.00 | 60 |
| Test 9 | 13.69 | 20.40 | 21.00 | 38.81 | 40 |
| Average of all results | 16.34 | 18.23 | 22.16 | 33.65 | 54 |
| Average after removing the largest and smallest values | 15.86 | 18.49 | 22.59 | 33.97 | 52.67 |
Development of instruments measuring the Atterberg LL and FL
At present, in the engineering field, there are measurement standards for the SL, PL and LL. Examples are those from the American Society for Testing and Materials and the National Standards of the Republic of China. However, there are no standards for FL measurements.
In a construction site with ω exceeding the LL, when building diaphragm walls, excavation using a clamp bucket will disturb the soil. Soil starts to flow and is included in the diaphragm walls. In contrast, if ω is greater than the FL, the soils on the slopes will become the main cause of debris flows due to spontaneous soil flows when rainwater infiltrates the soil. Hence, in this research, soil samples were obtained from the deep flow failure site in Xian-Du Mountain, Xiao-Lin Village, Jia-Xian District, Kaohsiung City, to conduct laboratory FL tests. The failure slopes were measured, and the soil density was determined using a field water injection approach. The field tests are shown in Figure 14.
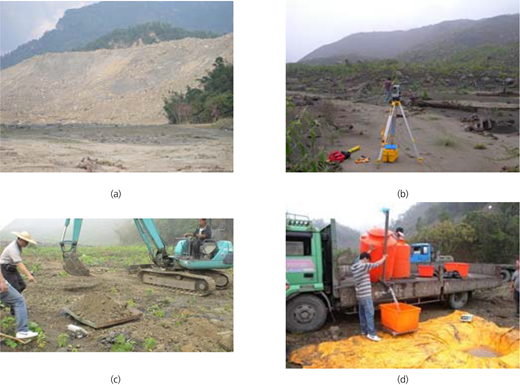
FL field tests. (a) The moisture content of the soil in Xian-Du Mountain, Xiao-Lin Village, exceeds the FL, and deep failure occurred in the form of soil flow. (b) The angle of the slope that experienced deep arc failure was measured on site. (c) Excavation was performed before the soil density was determined through water injection. (d) Water weight was measured during soil density determination using the water injection method
FL field tests. (a) The moisture content of the soil in Xian-Du Mountain, Xiao-Lin Village, exceeds the FL, and deep failure occurred in the form of soil flow. (b) The angle of the slope that experienced deep arc failure was measured on site. (c) Excavation was performed before the soil density was determined through water injection. (d) Water weight was measured during soil density determination using the water injection method
Results
During Typhoon Morakot, Xiao-Lin Village experienced continuous rainfall, and the colluvial deposits in Xian-Du Mountain and Mei-Lun Mountain were flooded. When the soil moisture content ω exceeded the FL, spontaneous soil flows occurred on the side slopes and resulted in large-depth collapses (with 84 m deep sliding surfaces). After the soil flows, soil samples were collected to measure the Atterberg limits and FL, as summarized in Table 4. The LL developed is described as follows.
Atterberg limits and FL of the colluvium from the large-depth collapses in Xiao-Lin Village
| Test | Value |
|---|---|
| Unit weight according to the sand-and-gravel ratio: kN/m3 | 22.36–24.95 |
| Unit weight of the recently obtained dry soil: kN/m3 | 20.87–22.89 |
| Specific weight of soil particles sieved through number 4 meshes | 2.74 |
| SL: % | 13.12 |
| PL: % | 15.67 |
| LL: % | 17.68–19.03 |
| FL: % | 25.41 |
The failure surfaces of the large-depth soil flows on the side slopes are the boundaries between the flowing and non-flowing soils due to their different moisture contents. To investigate the relationships between the moisture contents of soils from Xian-Du Mountain and Mei-Lun Mountain with the maximum static friction angles, recently obtained soils from Xiao-Lin Village of approximately 1 kgf were sieved through 40 meshes. Different volumes of water were added to the soil samples, which were then placed on 45 × 30 cm wooden boards. The plates were lifted on one side, and the angles at which the soil samples started to slide were measured (Figures 15(a) and 15(b)). Furthermore, this angle was considered to represent the maximum static friction and was subsequently analysed in relation to the moisture content of the soil, as outlined below.
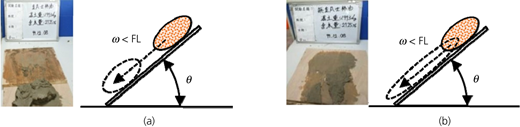
(a) The entire soil sample slid downwards when ω < FL. (b) The soil sample exhibited viscous flow when ω > FL
(a) The entire soil sample slid downwards when ω < FL. (b) The soil sample exhibited viscous flow when ω > FL
After sieving the soil through 40 meshes, 0–90% of the coarse soil particles screened out by 4–40 meshes were added to the soil passing through the meshes. The experimental results of the maximum static friction angles at different moisture contents are shown in Figures 16(a) and 16(b). Figures 16(a) and 16(b) show the results when petroleum jelly and no petroleum jelly were applied to the wooden boards, respectively. The experimental results were discussed as follows.
When ω < PL, as ω increases, the maximum static friction angle θ decreases. The entire soil sample falls and slides downwards. This agrees well with the wedge failure principles mentioned in Figure 1.
When ω > PL and ω > LL, as ω increases, θ also increases. Since there is enough water in the soil, excess water will seep out of the surface. The viscous force of the water on the soil surface and the adhesion force between the soil and the wooden board are attractive forces. However, the adhesion is still small; thus, the soil sample slipped off in one piece.
Yet when ω > FL, regardless of whether petroleum jelly had been applied to the wooden board, the soil samples instantly collapsed and slipped off. This moisture content at which the soil samples instantly collapsed and slipped off was the one at which spontaneous soil flows and debris flows took place. In this research, this moisture content is defined as the FL of the soil. The inclination angle corresponding to the FL is the angle of failure due to deep-layer flows on side slopes.
After adding 0–90% of coarse soil particles passing through 4–40 meshes, the FL and θ were more or less the same. However, when there were more coarse soil particles, the FL was about 1% lower and θ was 1–2° smaller.
The soil FL experimental results for the samples taken from Xian-Du Mountain demonstrate that when ω ≧ LL = 19.03%, θ equals 50–80°. The range of θ is similar to that of the failure arcs on the side slopes of the mountain. The minimum moisture content for soil to flow is found to be ω ≧ 25%, which equals the FL of the soil of the mountain. The corresponding failure angle of the side slopes is measured to be θFL = 75–80°. This range agrees well with the field measurements, as shown in Figures 17(a), 17(c), 18(a) and 18(b). Figure 17(b) reveals the soil flow failure situation in a construction site in Taipei, and the failure arc angle is similar (θFL = 75–80°).
From Table 4 and Figures 16(a) and 16(b), for soil sieved through number 40 meshes, when ω increases from 12.23 to 19.26% (LL), θ drops from 56 to 40° when petroleum jelly is applied to the wooden boards. Similarly, when no petroleum jelly is applied, θ decreases from 38 to 32°. Nevertheless, as ω reaches 20.50–25.41% (exceeding LL = 19.03%), θ increases. In the presence of petroleum jelly, it is noted that θ = 55–79°. In contrast, when no petroleum jelly is applied, θ = 42–80° is observed. As ω increases further to 26.88–28.51%, θ reduces again. It equals 55–42° when petroleum jelly is applied to the wooden boards. In the absence of petroleum jelly, θ decreases to 50–46°.
From Table 4 and Figures 16(a) and 16(b), for soil sieved through 40 meshes, when ω equals LL, θ peaks. How the soil samples slipped off was examined. When ω was smaller than LL = 19.26%, the soil sample slipped off in one piece. The upper end of the wooden board was wet. In contrast, when ω was greater than LL = 19.26%, the soil sample flowed. If it was assumed that deep flow failure took place on the side slopes of Xian-Du Mountain after the rainfall had reached 1100 mm, according to the field measurements of the failure arc angles (θ = 60–70°), it could be proven that the deep failure of the mountain was due to continuous and extremely heavy rainfall. Rainwater quickly infiltrated into weather mudstones and colluvial deposits. As a result, ω reached FL, causing instability on the side slopes and thus deep-layer flowed. When ω was smaller than LL = 19.03%, the side slopes were stable at θ. The adhesion force between the soil sample and the wooden board resisted the failure surface. Unfortunately, as ω reached FL, spontaneous soil flowed – in other words, debris flows – occurred on the side slopes. At this moment, viscous soil was left on the wooden board. The dynamic friction force between the soils resisted the failure surface. This is similar to the case where a man slips on mud and his feet are covered with mud. The failure surface is between the mud.
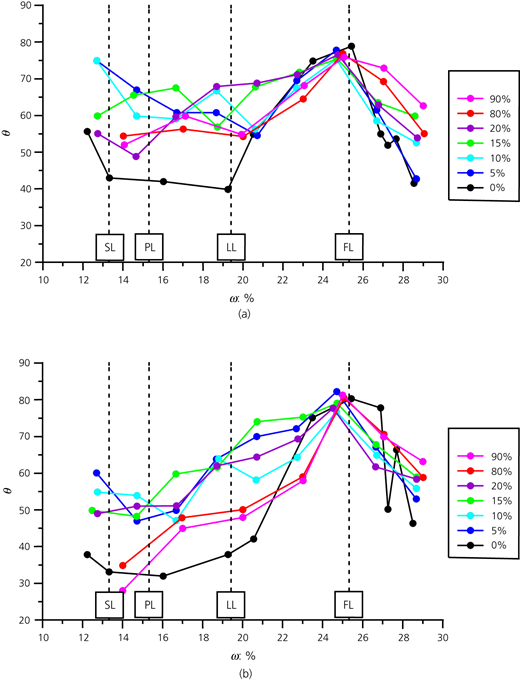
Plots of θ against ω for soil samples with 0–90% of coarse soil particles screened out by number 4–40 meshes: (a) when petroleum jelly is applied to wooden boards; (b) when no petroleum jelly is applied to wooden boards
Plots of θ against ω for soil samples with 0–90% of coarse soil particles screened out by number 4–40 meshes: (a) when petroleum jelly is applied to wooden boards; (b) when no petroleum jelly is applied to wooden boards
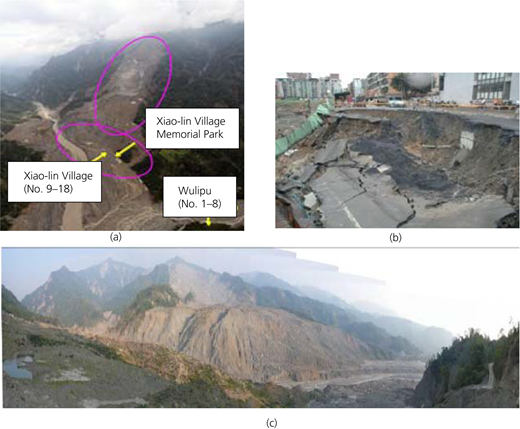
(a) Satellite photograph of Xiao-Lin Village after the deep-layer soil flow with an incision angle θ of 75–80° during Typhoon Morakot (adopted from Google Earth); (b) soil flow failure with a failure arc angle θ of about 75–80° at a construction site in Taipei; (c) deep-layer soil flow failure with an incision angle θ of 75–80° in Xiao-Lin Village during Typhoon Morakot
(a) Satellite photograph of Xiao-Lin Village after the deep-layer soil flow with an incision angle θ of 75–80° during Typhoon Morakot (adopted from Google Earth); (b) soil flow failure with a failure arc angle θ of about 75–80° at a construction site in Taipei; (c) deep-layer soil flow failure with an incision angle θ of 75–80° in Xiao-Lin Village during Typhoon Morakot
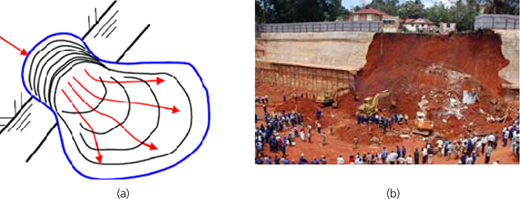
(a) Observed incision point of the top arc surface of the failure surface where debris flow occurs. It is the critical slip point at which ω reaches the FL as the soil absorbs water. The failure arc expands because the soil flow occurs slowly as ω reaches the FL. The sliding angle is the critical angle θFL corresponding to FL. (b) Side-slope failure due to rainfall at an open excavation site in Kampala, Uganda, in 2008. It is a site with horizontal slats plus a slope cut. Six workers were killed, and five workers were injured in the accident. At least ten people were buried (excerpt from news by Elle Decor Italia (Marelli, 2018))
(a) Observed incision point of the top arc surface of the failure surface where debris flow occurs. It is the critical slip point at which ω reaches the FL as the soil absorbs water. The failure arc expands because the soil flow occurs slowly as ω reaches the FL. The sliding angle is the critical angle θFL corresponding to FL. (b) Side-slope failure due to rainfall at an open excavation site in Kampala, Uganda, in 2008. It is a site with horizontal slats plus a slope cut. Six workers were killed, and five workers were injured in the accident. At least ten people were buried (excerpt from news by Elle Decor Italia (Marelli, 2018))
Based on the comprehensive analysis of the test results, the following observations can be made. In cases where the base plate was not coated with Vaseline, an increase in the proportion of coarse-grained soil led to higher critical sliding angles for the SL, PL and LL. Notably, the FL remained unaffected by the presence of coarse-grained soil, with all groups consistently approaching an angle of approximately 80°. Conversely, when the base plate was coated with Vaseline, the critical sliding angles for the SL, PL and LL consistently exceeded those of the groups without Vaseline coating. It is important to note that the FL remained impervious to the influence of the base plate friction coefficient, with all groups maintaining an angle close to 80°.
The state of a soil varies as its moisture content increases, and the SL, PL, LL and FL values are unique to the soil of interest. The FL is ω at which the spontaneous flow of a cohesive soil occurs. The failure surface must be inside the soil mass, and the flow occurs at a certain inclination angle. This angle is the incision angle of the top arc surface of the failure surface where the debris flow occurs on the side slope under heavy rainfall. It can be considered the critical slip point when ω reaches the FL. This slip angle is the critical angle corresponding to the FL, in other words, θFL. The failure arc expands because soil flow occurs as ω reaches the FL (Figure 18(a)). This angle is also the maximum stable slope angle of bare mudstone slopes or clay slopes (Figure 18(b)). In addition, this angle θFL is the critical angle for vegetated slopes. When the slope angle exceeds θFL, all vegetation will be lost when ω reaches the FL as water infiltrates into the soil. Figure 18(b) shows an open excavation site in Kampala, Uganda, in 2008. It is a site with horizontal slats plus a slope cut. Rainfall caused slope failure. As a result, six workers were killed and five were injured, while at least ten people were buried. The soil at the site was red soil, and it was believed that it was water-sensitive and iron-affected silt. The failure surface was arc shaped (non-stepped), with an incision angle of approximately 70–80°. The soil at the slope bottom exhibited flowing phenomena. Hence, it was deduced that spontaneous soil flows occurred as the soil absorbed rainwater and ω eventually exceeded FL. If sprayed soil reinforced with closed stainless steel wire mesh had been used to cover the slope and the ground and groundwater had been removed from the foundation pit and its surroundings, soil softening due to rainwater on the side slope would have been prevented. This technique was adopted at the site at the intersection of Zhonghua Road and Fuxing Road, Kaohsiung City, in 2012. No diaphragm walls were used. Instead, a 6 m thick protective layer was constructed by spraying soil onto hanging nets. Furthermore, steel piles were installed to retain the soil. In this way, underground excavation up to 13 m for the construction of a 21-storey building was made possible.
Conclusions
The stability analysis of slope movement or collapse is a highly intricate process. Previous studies have employed various controlling parameters, such as soil properties, rainfall intensity, initial groundwater depth and slope geometry, to conduct numerical simulations and three-dimensional analyses to understand the mechanisms and timing of failure. However, the multitude of variables often leads to significant uncertainty in predicting outcomes. This study specifically delves into the failure mechanisms of slopes composed of cohesive soils. It explores the relationship between the moisture content at which cohesive soils undergo spontaneous liquefaction (referred to as the FL) and the critical sliding angle (maximum static friction angle), representing the maximum stable slope for exposed mudrock or clay slopes. This angle also serves as the critical slope angle for vegetated slopes. Beyond this critical angle, all vegetation is at risk of loss due to soil liquefaction. The FL corresponds to the moisture content at which cohesive soils experience spontaneous debris flow. The interface point of deep-seated circular failure on the slope occurs when the soil moisture content reaches the FL, corresponding to the angle at which slope failure occurs. This represents the downslope angle at which deep-seated circular failure occurs on sloped terrain.
The expansion of the failure arc is primarily attributed to the saturation of the soil, causing it to reach the FL and subsequently flow. In this study, the Atterberg LL instrument is modified into an LL–FL instrument. Soil samples from Xian-Du Mountain in Xiao-Lin Village, bank protection along the Mei-Nong River and Zeng-Wen River, 13 tree holes in Kaohsiung, two slopes in Feng-Shan District and silt from the landslide disaster of 29 September 2016 from the mudstones in Yan-Chao District were used for moisture and flow failure angle measurements. Based on the analysis of on-site soil samples, it is evident that the critical sliding angle inevitably increases when the moisture content exceeds the LL. As the moisture content gradually surpasses the FL, the curve of the critical sliding angle exhibits an inflection point, resulting in a sudden decrease. The critical sliding angles for the SL, PL and LL are positively correlated with the proportion of coarse-grained soil and negatively correlated with the friction coefficient of the base plate (a larger coefficient corresponds to a smaller angle). However, the FL is not affected by the proportion of coarse-grained soil or the friction coefficient of the base plate.
This study defines the minimum moisture content at which cohesive soils undergo spontaneous liquefaction as the FL based on the results of on-site soil tests. It corresponds to the downslope angle at which cohesive soils experience circular failure due to liquefaction. The uniqueness of these results allows the replication of similar curve characteristics across different soil types. By utilising these research findings, it is possible to estimate the natural stable slope angle for slopes composed of cohesive soils. This study provides essential references for the prevention and control of stability in slopes made of cohesive soils, as well as disaster prevention efforts.

