


In seawater, cement-treated soil undergoes accelerated deterioration owing to enhanced calcium leaching caused by magnesium salts. The deterioration of cement-treated soil progresses gradually from the surface in contact with seawater, necessitating extended periods for investigating the soil properties after deterioration in laboratory tests. However, an accelerated deterioration method for cement-treated soil has not been developed. This study examines the effects of Mg concentration in the immersion water (0.94–23.45 g/l) and specimen dimensions (2.0–5.0 cm in diameter) on the deterioration rate. The aim is to accelerate the production of deteriorated cement-treated soil and characterise soil properties in a short period. The results indicated that the deterioration rate of the cement-treated soil increased with increasing Mg concentration in the immersion water, and the Mg concentration of 23.45 g/l was more than five times faster than that of 0.94 g/l. Furthermore, the smaller the specimen size, the shorter the period required for deterioration. The strength of the deteriorated cement-treated soil varied depending on the size of the specimen; however, the difference was within 16% based on a diameter of 5.0 cm.
Notation
- A
deterioration rate coefficient
- C
cement content
- CCa
Ca leaching amount
- CMg
Mg2+ concentration of immersion water
- d
depth of specimen
- dn
deterioration depth
- F
cone penetration resistance
- I
Ca2+ concentration in the immersion solution
- qu
unconfined compressive strength
- t
immersion time
- V
volume of the immersion solution
- w
water content
- σ
unconfined compressive stress
Introduction
The cement/lime improvement method is widely used as a useful technique to improve the strength and deformation characteristics of soft ground and has frequently been employed in large-scale ground improvement (Tang et al., 2001; Tatsuoka, 2010; Watabe and Noguchi, 2011). The strength of lime/cement-treated soil primarily increases through the formation of calcium silicate hydrate (C-S-H) and calcium aluminate hydrate (C-A-H) produced by hydration reactions (Firoozi et al., 2017). However, exposure to seawater softens the layer of solidified soil; this can be seen in tidal river embankment foundations after approximately 20 years (Hara et al., 2008). Approximately 15% of the salt content in seawater consists of magnesium salts (MgCl2 and MgSO4), which are the main cause of deterioration in cement- and lime-treated soil (Hara et al., 2013). Calcium hydroxide in the soil reacts with these salts to produce highly soluble calcium chloride and leachable calcium sulfate by the reactions:
Moreover, the pH of the treated soil decreases owing to the precipitation of Mg(OH)2. Furthermore, it is estimated that the strength of cement-treated soil deteriorates as C-S-H is transformed into magnesium silicate hydrate (M-S-H) (Hara et al., 2024). Therefore, magnesium salts are mainly responsible for the deterioration of solidified soil in seawater. This phenomenon is completely different from a sulfate attack (Rajasekaran, 2005; Saussaye et al., 2015; Verástegui-Flores and di Emidio, 2014), in which the generation of ettringite leads to increased internal pressure and consequent expansion.
Similar to the cement-treated soil, concrete is a typical hardened body that uses cement. When Cl− contained in seawater reach the rebar, they cause expansion owing to corrosion of the rebar, resulting in cracks in the concrete (Qu et al., 2021). Furthermore, the presence of cracks significantly increased the movement in Cl− (Chen et al., 2023). In addition, SO42− decompose calcium silicate hydrate (C-S-H) to form ettringite, which causes expansion (Jaya et al., 2014; Sun et al., 2022). Furthermore, Mg2+ exchanges with Ca2+ contained in C-S-H to form M-S-H, which reduces strength (Kobayashi et al., 2023). Thus, in reinforced concrete exposed to seawater, epoxy-coated steel bar (Huang et al., 2021), and part of the cement, is replaced by supplementary cementitious material (SCM). SCMs include coal bottom ash (Mangi et al., 2018; 2019; Wan Ibrahim et al., 2020), silica fume (İnan, 2012), and metakaolin (Li et al., 2015). It has been reported that mixing these materials at 5%–10% of the cement densifies the hydration products and suppresses their deterioration.
In previous studies, needle or cone penetration tests were used to show that the deteriorated range of cement-treated soil extends inward from the surface in contact with seawater (Cui et al., 2016; Ikegami et al., 2002; Pham et al., 2017; Siregar et al., 2019; Takahashi et al., 2023; Wang et al., 2024a; 2024b; Yang et al., 2016). Furthermore, studies using clay with a high water content found that more than 80% of the strength of cement-treated soil was lost in seawater environments (Hara et al., 2024). Recently, a mitigation technique for deterioration by microbial functions has been developed (Hata et al., 2020; Ikoma et al., 2023). There have been few studies on the properties of cement-treated soils exposed to seawater; therefore, many unknowns remain. To investigate these factors, cement-treated soils that have deteriorated in seawater should be prepared. However, the deterioration of the solidified soil progresses gradually from the interface with seawater; therefore, it takes a long time to conduct such studies. A previous study examining the changes in the compressibility of lime-treated soil required more than 300 days to prepare deteriorated lime-treated soil specimens for consolidation tests (Hara et al., 2015). Therefore, to evaluate the long-term stability of cement/lime-treated soils constructed in coastal areas, it is necessary to develop a method for investigating the mechanical properties of deteriorated solidified soils over a short period.
In this study, firstly, to clarify the effects of Mg2+ concentration on the accelerated deterioration of cement-treated soil, the progress of the deteriorating treated soil immersed in Mg solutions of varying concentrations was investigated. Subsequently, the effects of the specimen dimensions on the Ca leaching characteristics and unconfined compressive strength of the cement-treated soil specimens were examined. The results obtained in this study will be useful for preparing deteriorated cement-treated soil specimens such that the strength and deformation properties of deteriorated cement-treated soils can be investigated in a short period.
Effects of Mg concentration on deterioration rate of cement-treated soil
Materials
Cement-treated soil preparation
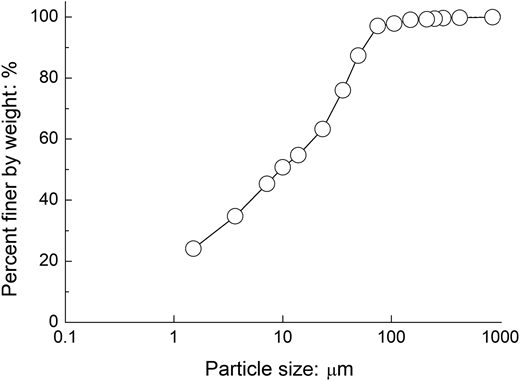
The soil samples, which consisted of Ariake clay, were collected from the mouth of a tidal river where deterioration of solidified soil had been confirmed. Table 1 summarises the physical properties of the clay; Figure 1 shows the particle size distribution in it. The soil used in this study was a clay with a high liquid limit of 138.0%, high fines content, and high plasticity. The solidification material used was blast-furnace cement of type B (BB) specified in JIS R 5211. The chemical composition of the BB is presented in Table 2. The density was 3.04 g/cm3, and the specific surface area was 3660 cm2/g. BB is partially replaced with ground granulated blast-furnace slag and has a lower CaO content than ordinary Portland cement. The water content of the soil samples was set to 1.50 times the liquid limit to ensure uniform mixing of the soil and cement (Kurihara et al., 2018; Yamashita et al., 2020). The deep mixing treatment method requires a minimum of 100 kg/m3 for uniform mixing of soil and cement (Japan Cement Association, 2021); therefore, the amount of cement used was 100 kg/m3. The BB and soil samples were mixed for 10 min using an electric mixer and poured into plastic moulds (50 mm in diameter and 100 mm in height) that were tapped to prevent air intrusion. Each sample was then cured for 28 days at a temperature of 20°C.
Physical properties of soil sample
| Property | Value |
|---|---|
| Specific gravity | 2.64 |
| Liquid limit: % | 138.0 |
| Plastic limit: % | 42.2 |
| Plasticity index | 95.8 |
| Grain size distribution: % | — |
| Sand (0.075 mm < d ) | 3.0 |
| Silt (0.005 < d < 0.075 mm) | 58.8 |
| Clay (d < 0.005 mm) | 38.2 |
2.1.2 Mg solution preparation
In this study, a solution with high Mg2+ concentration was used as a substitute for seawater. Seawater contains magnesium chloride (MgCl2) and magnesium sulfate (MgSO4). Highly concentrated Mg solutions were used in this study; therefore, MgCl2 was selected, which has high solubility. Magnesium chloride hexahydrate (MgCl2 · 6H2O) was dissolved in ion-exchanged water to obtain solutions with Mg2+ concentrations of 0.94, 3.75, 8.44, 15.01, and 23.45 g/l, equivalent to 1, 4, 9, 16, and 25 times the Mg2+ concentrations in the estuary of the tidal river where softening of the solidified soil had been observed (0.938 g/l).
Method for immersion in Mg solution
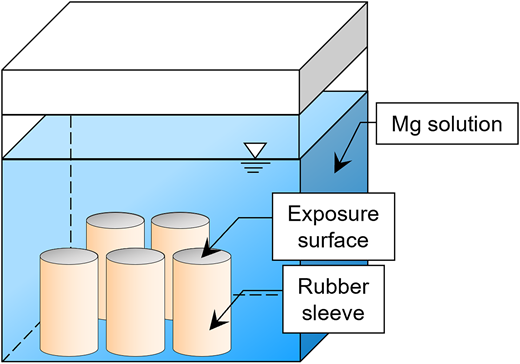
The prepared cement-treated soil specimens were immersed in 1 l of Mg solution according to the following procedure: the side and bottom of the specimen were sealed with a rubber sleeve and Parafilm; thus, only the top surface of the specimen was opened to the Mg solution. This treatment caused the cement-treated soil to deteriorate in a one-dimensional manner. Subsequently, the Mg solution was placed in a polyethylene container, and five specimens were immersed. The immersion times were set to 0, 14, 28, 56, and 84 days. Figure 2 is a schematic representation of the cement-treated soil specimens immersed in Mg solution. During the immersion, the water was changed weekly to maintain a constant Mg2+ concentration. The temperature of the solution was monitored periodically and maintained within a range of 20 ± 2°C. No expansion, shrinkage, or cracking of the specimens was observed during the immersion period. The experimental conditions are listed in Table 3.
Methods
Cone penetration test
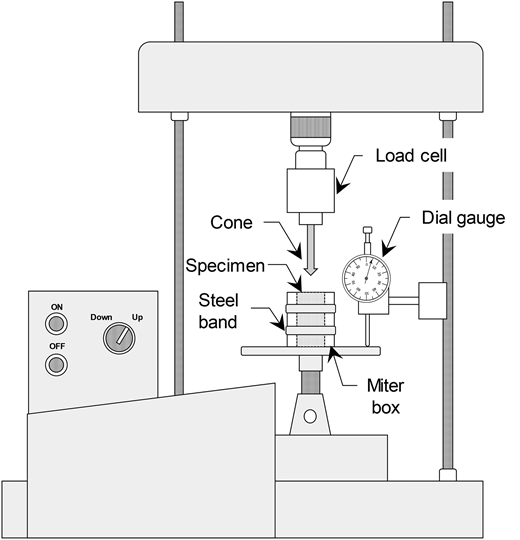
Following the immersion in the Mg solution, a cone penetration test was conducted to determine the deteriorated depth of the specimens according to the following procedure. First, the rubber sleeve and Parafilm were removed from the specimen. The specimens were then placed in a mitre box and secured with stainless-steel bands to prevent cracking during testing. A cone with 6.0 mm in diameter and 60° tip angle penetrated 50–70 mm from the top surface. The penetration rate was 3.0 mm/min. During the test, the cone penetration resistance and depth were measured every second using a load cell and dial gauge. Figure 3 illustrates the cone penetration testing apparatus used in this study.
Depth distribution of Ca and Mg content
X-ray fluorescence (XRF; ZSX Primus IV, Rigaku) was used to determine the concentrations of Ca and Mg after 84 days of immersion. Following the cone penetration test, samples were collected every 5 mm in the depth direction in the area where the penetration resistance was lower than that before immersion. The collected samples were oven-dried at 110°C, carefully grounded using an agate mortar and pestle, then subjected to XRF analysis.
Results and discussions
Depth distribution of cone penetration resistance
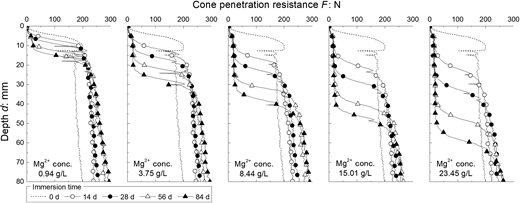
Figure 4 illustrates the depth distribution of the cone penetration resistance. Before immersion (0 days), the cone penetration resistance increased during the initial stage of penetration and reached a constant value at depths greater than 10 mm. The shallow range of the specimens immersed in the Mg solution exhibited significantly lower penetration resistance values. This is because the reactions of Equations 1 and 2 progressed, and C-S-H was transformed into M-S-H. The penetration resistance at a depth of approximately 10 mm was 180–200 N before immersion but decreased to less than 20 N after immersion in the Mg solution regardless of the concentration. The range of low penetration resistance increased with the immersion time. However, the penetration resistance at depth tends to increase slightly with increasing immersion time. The penetration of Mg ions occurs gradually from the exposed surface of the specimen. Therefore, while the cement hydration process progressed inside the specimen, deterioration occurred due to the penetration of Mg ions in the surface layer before the cement hydration process was completed. Consequently, it was inferred that the deeper parts of the specimens became stronger with increasing immersion time.
Deterioration rate
The range in which the cone penetration resistance decreased was defined as the deterioration depth dn, which was determined using the method illustrated in Figure 5. First, the depth d0 was obtained by indicating the half-maximum value of the cone penetration resistance (F0/2) in the F–d relationship of the specimen before immersion. The depth d was then obtained in a similar manner as for obtaining d0 in the F–d relation of the specimens immersed in the Mg solution, and dn was determined as the difference between d and d0.
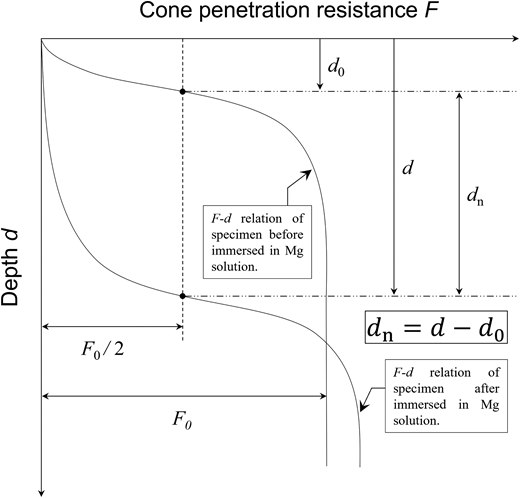
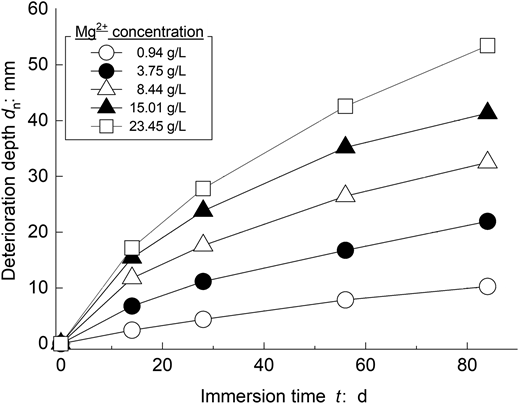
Figure 6 illustrates the relationship between the deterioration depth and immersion time. The deterioration depth increased with immersion time. For the same immersion time, the specimens immersed in a higher-concentration Mg solution exhibited greater deterioration depth.
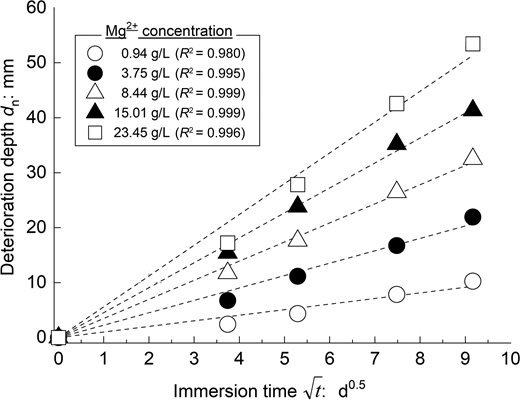
When the concentration of carbon dioxide was steady, the carbonation depth of concrete increased in proportion to the square root of the exposure time (Gruyaert et al., 2013; Khunthongkeaw et al., 2006; Liu et al., 2023; Monteiro et al., 2012). Similarly, we postulated that the deterioration depth increased in proportion to the square root of the immersion time in the Mg solution. The measured deterioration depths were fitted by the least squares method to:
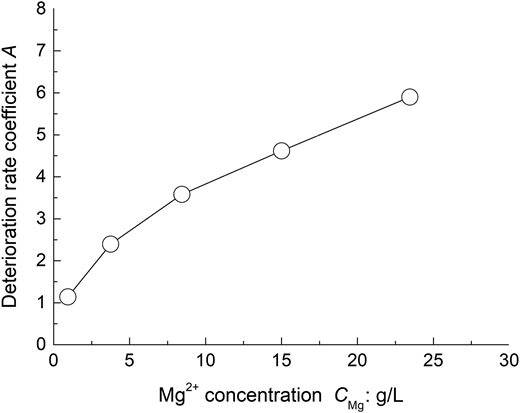
where A is the deterioration rate coefficient (mm/) and t is the immersion time (d). Figure 7 illustrates the relationship between the deterioration depth and square root of the immersion time. There was no large discrepancy between the regression line and the experimental values; in all cases, the coefficients of determination were higher than 0.98. This suggests that the deterioration of the cement-treated soil progresses in proportion to the square root of the duration of exposure to the Mg solution. Figure 8 shows the relationship between the deterioration rate coefficient A and Mg2+ concentration in the immersion water. The deterioration rate coefficient increases with increasing Mg2+ concentration. The deterioration rate at an Mg concentration of 23.45 g/l was more than five times that at 0.94 g/l. However, this trend gradually slowed as the Mg concentration increased. The carbonation depth of concrete also increased as the carbon dioxide concentration increased; however, its significance gradually decreased with the carbon dioxide concentration (Cui et al., 2015; Xu et al., 2022).
Relationship between deterioration depth and the square root of immersion time
Relationship between deterioration depth and the square root of immersion time
Relationship between the deterioration rate coefficient and Mg2+ concentration in immersion water
Relationship between the deterioration rate coefficient and Mg2+ concentration in immersion water
Ca/Mg concentration
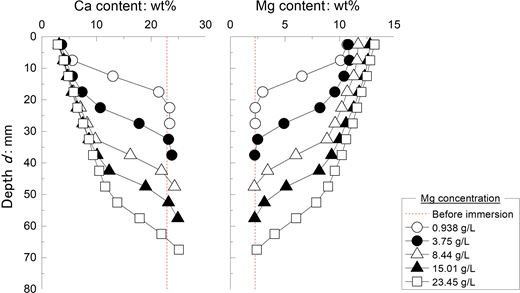
Figure 9 shows the depth distribution of the Ca and Mg concentrations after 84 days of immersion, as determined using XRF. Before immersion, the Ca and Mg concentrations were 22.9 and 2.3 wt%, respectively. Most of the Ca was derived from cement, and Mg was contained in Ariake clay, a marine clay. When immersed in the Mg solution, the Ca content in the shallow range was significantly lower than before immersion. However, a large increase in Mg content was confirmed in the same range. The range in which a decrease in the Ca content and an increase in the Mg content were observed was greater when the Mg concentration in the immersion water was higher. This was attributed to the precipitation of Mg(OH)2 and leaching of Ca resulting from the reactions in Equations 1 and 2. The Ca and Mg concentrations in the deep areas were similar to those measured before immersion.
Effect of specimen dimensions on deterioration rate of cement-treated soil
Preparation of cement-treated soil specimen
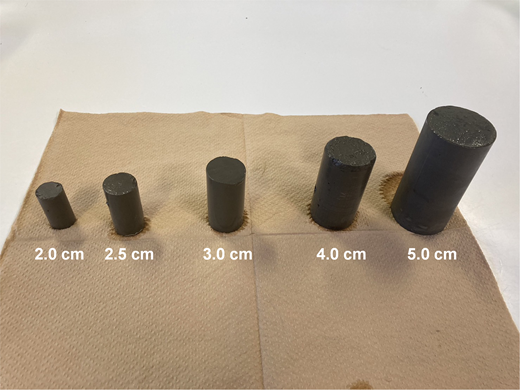
Cement-treated soil specimens were prepared using the procedure described in Section 2.1. Figure 10 shows the appearance of the specimens of each diameter. The diameters of the specimens were 2.0, 2.5, 3.0, 4.0, and 5.0 cm, and their heights were twice those of the specimens. A commercially available plastic mould with a diameter of 5.0 cm and polyvinyl chloride pipes of various diameters were used as moulds for specimens with other diameters. No cracks were observed in the specimens of each diameter.
Method for immersion in Mg solution
The Mg solution was prepared in the same manner as described in the previous section. The Mg2+ concentration was set to 23.45 g/l, which had the greatest effect on accelerating the deterioration in the previous experiment. Cement-treated soil specimens of various sizes were immersed in an Mg2+ solution. The specimens were immersed in the solution without being wrapped in Parafilm or rubber sleeves such that the entire surface of the specimens was in contact with the solution. The amount of Mg solution was 0.5 l per specimen for diameters of 2.0 and 2.5 cm, and 2 l per specimen with diameters of 3.0, 4.0, and 5.0 cm. Because the amount of Mg solution was set to be large compared with the volume of the specimen, the solution was not replaced during the immersion period.
Methods
Water-quality analysis
Water analysis was conducted to confirm the Ca-leaching behaviour of the specimens. The concentration of Ca2+ in the immersion solution was measured at regular intervals. Inductively coupled plasma atomic emission spectroscopy (PerkinElmer, Optima 8300) was used for analysis.
Ca and Mg content before and after immersion in Mg solution
Samples were taken from the centre of the specimens subjected to unconfined compression tests. The untreated Ariake clay and cement-treated specimens before and after immersion in the Mg solution were analysed. The samples were ground in an agate mortar and pestle after being oven-dried at 110°C. The unconfined compression test is an element test; hence, uniform deterioration of specimens is required; XRF was employed to confirm that this occurred.
Unconfined compression test
Unconfined compression tests were conducted on the specimens before and after immersion, following the protocols set by the Japanese Industrial Standard (JIS) A 1216:2020. Three specimens were tested under each set of conditions. An even distribution of the load was ensured by applying commercial-grade dental gypsum to the upper- and lower-end faces of the samples.
Results and discussions
Ca leaching behaviour
CCa was calculated as the amount of Ca leached relative to the volume of the specimen using the following equation:
where CCa, i is the leaching amount of Ca (kg/m3), I is the concentration of Ca2+ in the immersion solution (kg/l), W is the volume of the immersion solution (l), and V is the volume of the specimen (m3).
Figure 11 illustrates the changes in the leaching amount of Ca with the immersion time. For all specimen sizes, CCa increased with increasing immersion time. Moreover, comparisons with the same immersion time revealed that CCa decreased with specimen size. It is considered that a smaller diameter shortens the time required for Mg2+ to permeate the cement-treated soil specimen owing to the shorter permeation distance. Equation 3 can be transformed into
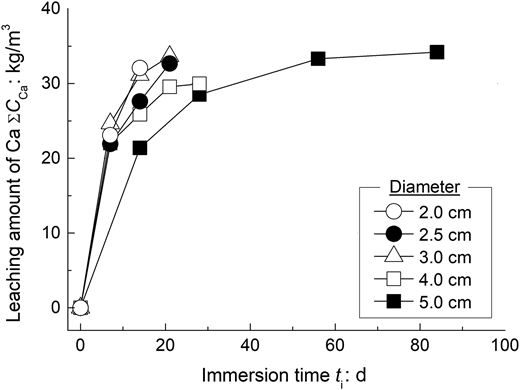
The time required for the entire specimen to deteriorate mechanically can be obtained as t by entering the radius of the specimen, d, into the equation. Consequently, the values of t for diameters of 2.0, 2.5, 3.0, 4.0, and 5.0 cm were 3.2, 5.0, 7.2, 12.8, and 20.0 days, respectively. Figure 11 illustrates that Ca leaching continued even after the aforementioned period, suggesting that Ca leaching continued even after mechanical deterioration. Therefore, the immersion time was longer than the calculated t value, and the immersion was terminated at 14, 21, 21, 28, and 84 days for diameters of 2.0, 2.5, 3.0, 4.0, and 5.0 cm, respectively.
Ca/Mg concentration
Figure 12 shows the concentrations of Ca and Mg as determined by XRF. The Ca content of the untreated Ariake clay was approximately 3 wt%; however, that of the cement-treated soil before immersion was approximately 22 wt% owing to the added cement. Contrarily, the Ca content of the cement-treated soil samples after immersion was significantly lower than that of the specimen before immersion. These concentrations ranged from 2.5–4.4 wt%, fairly close to the Ca content of untreated Ariake clay. This suggests that the Ca of the added cement was mostly lost to leaching. Before immersion in the Mg solution, the specimens already had an Mg content of approximately 2 wt%, as would be expected in marine clay. Following immersion, the specimens exhibited a high Mg content, regardless of their dimensions. After immersion in the Mg solution, all samples showed similar Ca/Mg concentrations. Their concentration was almost the same as that in the surface layer of Figure 9. Therefore, the specimen was considered to have sufficiently deteriorated.
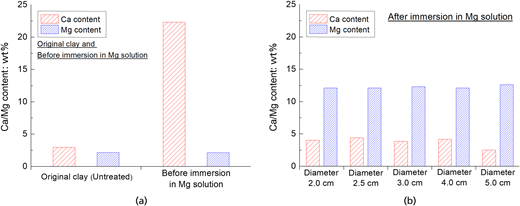
Ca/Mg content: (a) original clay and before immersion in Mg solution; (b) after immersion in Mg solution
Ca/Mg content: (a) original clay and before immersion in Mg solution; (b) after immersion in Mg solution
Unconfined compressive strength
Figure 13 shows an example of the stress-strain relationship before and after immersion. In un-immersed specimens, compressive-stress peaks appeared at relatively low strain values; after this, considerable strain softening took place. Contrarily, the specimens immersed in the Mg solution exhibited relatively large failure strains. Immersion in the Mg solution considerably reduced the strength of the specimens. This is attributable to the conversion of C-S-H into M-S-H, which has a relatively low cementation effect (Hara et al., 2024).
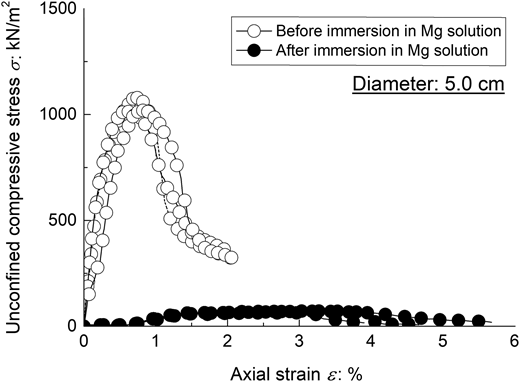
Example of the stress–strain relationships of the specimens before and after immersion in Mg solution
Example of the stress–strain relationships of the specimens before and after immersion in Mg solution
The unconfined compressive strength is shown in Figure 14 as a function of specimen diameter; in every case, it decreased considerably after exposure to Mg solution. Under constant aspect ratio conditions, the strength of soils with high fine fraction content decreased with increasing specimen diameter (Kamei and Tokida, 1991). The Ariake clay used in this study has a significantly high fine grain content of 97%. After immersion, the cement-treated soil approached the properties of the original clay and showed a tendency to decrease in strength as the diameter increased owing to size effects. The average values of unconfined compressive strength before and after immersion were 851.2–1040.3 kN/m2 and 58.1–78.7 kN/m2, respectively. After immersion, the strength tended to decrease slightly with a smaller specimen size; however, the difference was approximately 16% based on the strength at a diameter of 5 cm.
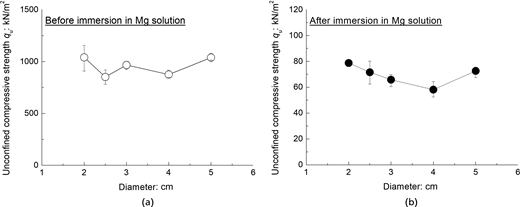
Relationship between specimen diameter and unconfined compressive strength: (a) before immersion in Mg solution; (b) after immersion in Mg solution
Relationship between specimen diameter and unconfined compressive strength: (a) before immersion in Mg solution; (b) after immersion in Mg solution
Conclusions
In this study, the effect of the Mg2+ concentration in the immersion solution on the deterioration rate of cement-treated soils was investigated. Furthermore, the characteristics of Ca leaching and the strength of cement-treated soil specimens with varying dimensions were investigated. The main conclusions are as follows.
- ▪
The deterioration depth of the cement-treated soil immersed in the Mg solution increased proportionally with the square root of time.
- ▪
The deterioration rate of cement-treated soil increases with increasing in the Mg2+ concentration in the immersion solution.
- ▪
The smaller the specimen diameter, the shorter the period until the Ca concentration in the specimen reaches equilibrium.
- ▪
The unconfined compressive strength of the cement-treated soil under all dimensional conditions decreased significantly after exposure to the Mg solution. Post-exposure strength varied slightly with specimen dimension; however, the difference was approximately 16% based on the strength at 5 cm diameter.
In this study, the time required for the deterioration of cement-treated soil was shortened by increasing the Mg concentration in the immersed water and decreasing the dimensions of the specimens. Therefore, it is possible to prepare deteriorated cement-treated soil specimens in a seawater environment for a short period and investigate their soil properties. This enables the evaluation of the stability of soil structures using cement-treated soil after deterioration before construction.
Acknowledgements
This research did not receive any specific grant from funding agencies in the public, commercial, or non-profit sectors.

