

To control and ensure the safety of the Madani Tabriz dam at the period 10 years after the end of construction, dam monitoring is performed utilising data from the instrumentation installed on the dam’s body. In this study, using the Midas finite element software, the results of the settlement, pore water pressure, and total stress of the Madani rockfill dam were calculated 10 years after the end of construction of the dam body and compared with the results of the instrumentation observation. The linear correlation coefficients between the data obtained from the sensors and the numerical analysis results for the items of settlement, pore water pressure, and total stress are 84%, 67%, and 99%, respectively. Sensitivity analyses were carried out for present special impounding programme for the dam, with controlling two simultaneous items: the pore water pressure and effect stress changes in the clay core, with 10 years passed since the completion of construction of the dam body. While controlling the reliability coefficient of the body stability, with a 30 cm/d reservoir impounding, the dam reservoir will be filled in 80 d. Suggest an impounding program for a reservoir behind an earth or rockfill dam, detailing a specific plan that ensures all safety aspects of the dam are controlled.
Notation
- A
settlement at a given level
- Amax
maximum settlement observed in the dam body
- c
material adhesion or cohesion
- E
modulus of elasticity of materials
- H
level at which settlement, stress, or pore pressure is measured
- Hmax
maximum dam crown level
- K
permeability coefficient
- P
pore water pressure
- Pmax
maximum pore water pressure
- Ru
arching ratio
- v
poisson’s ratio
- Y
relative change of settlement to maximum settlement
- z
installation elevation of instruments
- γd
dry specific gravity
- γsat
saturated specific gravity
- Δ
settlement at a specific level
- σ
total stress
- σmax
maximum total stress
- φ
internal friction angle
1. Introduction
Monitoring involves checking the dam’s performance at the end of the construction and operation phases and ensuring compliance with design predictions. The International Commission on Large Dams recommends continuous monitoring of dam safety and stability during construction and operation (Blind, 1983; Cheng et al., 2021). Monitoring is achieved by installing appropriate instruments in sensitive areas to measure various parameters, such as pore water pressure, deformation, and total stress (Liu et al., 2023). The increased pore water pressure within the dam body reduces effect stress and, consequently, decreases the shear strength of the dam materials, which can lead to dangerous outcomes, such as embankment instability (Ghiasi et al., 2021; Komasi and Beiranvand, 2019). The amount of saturated settlement in the upstream shell of the dam caused by the first impounding of the reservoir can be determined using data recorded by the dam body sensors (Khalili-Maleki et al., 2022; Soroush and Aghaei Araei, 2006). The stability of rockfill dams can be estimated using numerical modelling, which is crucial for controlling the stability of dams against natural disasters (earthquakes, floods, and landslides), poor design, and inadequate maintenance (Farajniya et al., 2022; Sivasuriyan et al., 2021). The factor of safety obtained from numerical analyses must fall within the allowable range for controlling the stability of dam body slopes (Ghaemi and Konrad, 2022; Zhenyu et al., 2020). Heterogeneous settlement can occur between different parts of the dam, know n as ‘arching’ leading to cracks in the impermeable cross-section of the dam body (clay core), especially near the supports, due to the differing properties of core and shell materials. These cracks can expand during reservoir impoundment due to the pressure exerted on the core, potentially leading to the hydraulic failure of the dam body (Beiranvand and Komasi, 2019). Rockfill dam cores have been evaluated for hydraulic failure through laboratory tests and numerical analyses, suggesting the use of GM–GC rather than CL materials for rockfill dam cores (Behrouz Sarand et al., 2023; Ghanbari and Shams, 2015). Studies indicate that maximum long-term settlement typically occurs in the middle of the dam core (Mazaheri et al., 2020). In addition, it has been reported that 88% of total dam settlement occurs during construction (Rashidi and Haeri, 2017; Zareh et al., 2023). One study found that settlement decreases and eventually stabilises over time after the first reservoir impounding, even as the reservoir volume increases (Guo et al., 2018; Zhou et al., 2011). The results of studies conducted thus far indicate that numerical analysis is one of the methods for assessing the stability of rockfill dams. Sole reliance on stability analyses without comparison with results from other methods, such as dam body monitoring, is not a reliable approach. Therefore, this study focuses on the Madani Tabriz dam, which took a decade to construct and has been completed for 10 years. To date, no comprehensive study has been conducted on controlling the stability factors of the dam body. Consequently, the stability of the dam body has been assessed concurrently with numerical analysis results and data from precision instrumentation. Furthermore, the correlation coefficients between numerical analysis results and instrumentation data for the three stability factors of the dam body vertical settlement, pore water pressure variations, and total stress were examined. Finally, the impounding of the reservoir for this specific dam should not be carried out solely based on conventional codes. Instead, a specialised reservoir impounding plan should be developed according to the dam body conditions, based on sensitivity analysis results, and with simultaneous monitoring of stability factors, such as pore pressure variations, stability safety factors, and effect stress values. It is recommended that for each dam, a specific and tailored reservoir impounding plan be defined and implemented based on the physical and stability conditions of the dam after construction.
2. Resistance of rocks and sediments in the studied area
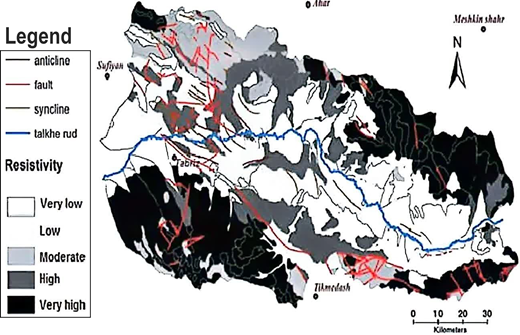
From the point of view of geology, the study area exhibits relatively gentle folding. Significant faults are located near this area, with the most notable being the Tabriz fault, which is situated south of the dam reservoir. The bedrock underlying the foundation areas and the dam axis consists of ultrabasic rocks from the Late Cretaceous period. The quality of the bedrock in this area ranges from poor to very poor. The weathering depth in the bedrock is significant, and there are numerous alteration and fracturing zones. A relatively thick cover of riverbed gravel overlays the bedrock. Figure 1 shows the map of the resistance of rocks and sediments in the studied area.
3. Main features of dam
The Madani rockfill Dam is built on the Aji Chai River in Tabriz, with a crown length of 277 m and a height of 91 m. The crown level of the dam is 1504 m, and the normal water level is 1498 m above sea level. The reservoir volume at the normal level is 361 M·m3. Excavation was carried out to a depth of 52 m in the riverbed to reach the bedrock. Two layers of fine- and coarse-grained filters are placed on both sides of the clay core to prevent the leaching of fine-grained materials from the clay core due to water flow through the dam body. The readings from these sensors have been continuously recorded since their installation. Figure 2 shows the plan of the Madani dam.
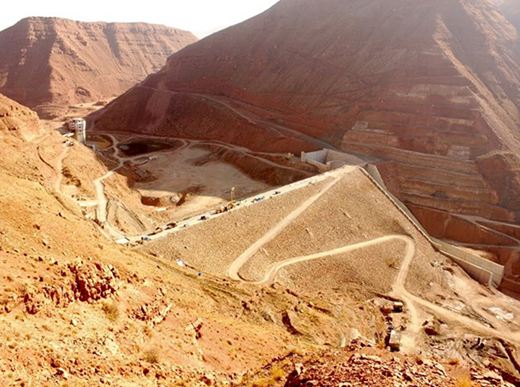
Table 1 presents the technical specifications of the Madani Dam and its reservoir (Ghods-Niroo Consultant Engineers Co., 2002a, 2002b, 2009, 2013).
Technical specifications of the Madani dam and its reservoir
| Dam detail | Value |
|---|---|
| Height of crest from bedrock (in the largest cross-section) | 91 m |
| Height of crest from riverbed (in the largest cross-section) | 39 m |
| Dam crest elevation | 1504 m |
| Normal water level | 1498 m |
| Length of dam crest | 278 m |
| Width of dam crest | 10 m |
| Total dam volume | 361 M·m3 |
| Dam body materials volume | 1.7 M·m3 |
| Dam slope up-stream | 1: 2.3 |
| Dam slope down-stream | + Berm |
| Total reservoir area | 34.7 km |
Dam stability was monitored by comparing changes over time to forecasts and existing standards. Based on the dam’s characteristics and geological conditions, a monitoring system was implemented to control and manage the performance and behaviour of the Madani dam. Five sections of the dam body were instrumented to monitor the Madani dam during the design phase. Figure 3 shows the dam’s longitudinal section and the largest cross-section.
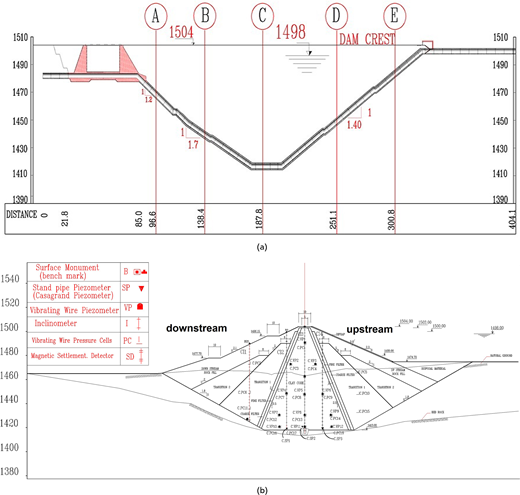
All the data, including settlement, core pore pressure, and total stress, were collected from over 500 sensors installed in the dam body 10 years after its construction. A total of 120 pressure cells (PC), 62 piezoelectric sensors (VP), 27 piezometers (SP), 17 inclinometers (I), and 275 magnetic settlement detectors (SD) were installed in the dam body.
4. Material properties and numerical modelling
Three-dimensional (3D) dam bodies and supports were modelled using the Mohr–Coulomb behavioural model and the finite element software MIDAS-GTS.2019V2.1. MIDAS is specialised geotechnical software for analysing earth and rockfill dams, and its advantages include accurate modelling, straightforward analyses, and high computational speed.
4.1 Material properties
The mechanical properties of the materials used in the numerical analyses were obtained from soil mechanics laboratory tests. Table 2 lists the initial material parameters of the dam body based on the Mohr–Coulomb behaviour model.
List of the initial values material parameters dam body
| Parameter | Clay core | Filter | Shell | Transient shell | Disposal | Alluvial foundation | Bed rock |
|---|---|---|---|---|---|---|---|
| 19 | 20 | 21 | 20 | 19.2 | 18.5 | 21 | |
| 20 | 21 | 22 | 21 | 19.8 | 19.5 | 22 | |
| 0.05 | 10 | 100 | 100 | 10 | 100 | 0.001 | |
| 28 | 33 | 44 | 38 | 28 | 20 | 28 | |
| 40 | 0 | 0 | 0 | 20 | 20 | 80 | |
| 0.3 | 0.25 | 0.25 | 0.25 | 0.3 | 0.3 | 0.25 | |
| 20 | 40 | 70 | 50 | 15 | 40 | 390 |
In this table, the parameters, , ,, , , , and , are dry specific gravity, saturation specific gravity, permeability coefficient, internal friction angle, material adhesion, Poisson’s ratio, and modulus of materials elasticity, respectively.
4.2 Modelling and analyses
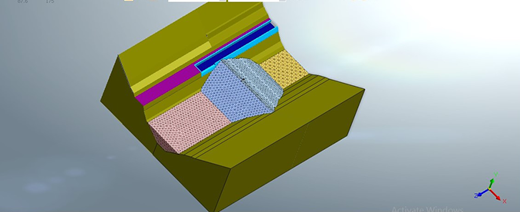
3D modelling of the Madani Tabriz rockfill dam has been done using the Midas finite element software. Mohr–Coulomb elastoplastic behaviour model was used to introduce materials in numerical modelling. Triangular grids have been used for modelling (Vafaei et al., 2023). The duration of the dam construction modelling is completely based on the reports received during the dam construction. Numerical modelling was carried out in three stages. At the start, the riverbed must be modelled to specify the residual stress of the bed. The horizontal stress values were calculated using the lateral pressure coefficient of the soil. In the second stage, excavation of the riverbed to reach the bedrock of the dam is modelled. Riverbed excavation modelling was done in ten layers. In the third stage, the numerical modelling of the dam body from the bedrock level to the riverbed level was carried out in ten layers; each layer was 6.4 m thick in the software. The construction operation took 6 years. Given the location of the river diversion tunnels, the underground water level will always be level with the riverbed. Considering the length of time of construction operations up to the riverbed and the high level of underground water in the area, the materials of the dam body are saturated below the level of the riverbed. The modelling of the riverbed to the crest of the dam (1504 m) was modelled in five layers. In this stage, the construction operation lasted about 3 years, and an undrained clay core was assumed. In stress analysis, the initial stress and the initial displacement of the support are considered zero. According to the results of sensitivity analysis, mesh size one is considered. Based on sensitivity analysis, horizontal and vertical boundary dimensions are selected to create the geometry. Figure 4 shows the 3D geometry mesh of the model.
5. Results and discussion
The results of the stress analysis, consolidation analysis, and the stability safety factor of the dam body at various reservoir impoundment levels are presented.
5.1 Settlement
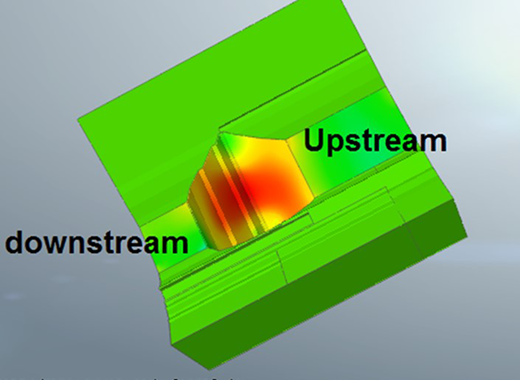
The weight and density of materials during construction impose additional load on the underlying layers, leading to internal deformation. A series of magnetic plates were placed at different depths inside the settlement tube to measure the deformation of the dam body. The base plate was installed at the lowest level on the rock bed, where the least movement occurs, making this point nearly fixed. A total of 17 inclinometers and 275 magnetic settlement detectors were used at different levels of the dam body to assess the deformations of the Madani dam. Figure 5 shows the vertical settlement of the dam body resulting from the consolidation analysis.
In addition, Table 3 presents the vertical settlement values obtained from the magnetic settlement detectors and numerical analysis across five cross-sections of the dam.
Maximum vertical settlement in cross-sections A, B, C, D, and E
| Cross-section | A | B | C | D | E |
|---|---|---|---|---|---|
| Maximum settlement numerical analyses: m | 0.45 | 1.55 | 1.79 | 1.3 | 1.1 |
| Maximum settlement instruments: m | 0.469 | 1.56 | 1.9 | 1.33 | 1.17 |
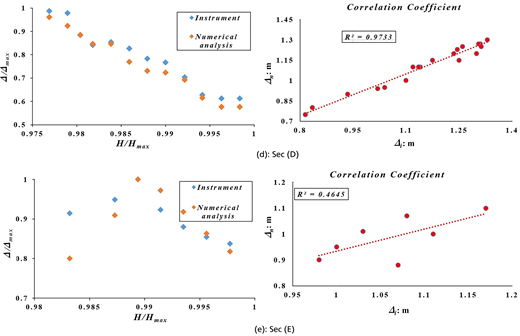
The value of the settlement obtained from the data recorded by the precision tools is higher than the values obtained from the numerical analysis. Max vertical settlement 10 years after the end of construction of the Madani dam body, obtained from the monitoring data of precision instruments and numerical analysis, 1.90 and 1.79 m, respectively. The correlation coefficient of the settlement data obtained of the results from precision instruments and numerical analyses is more than 83.8%. Figure 6 shows the curve of settlement relative changes in cross-sections A, B, C, D, and E is shown to determine the dimensionless multivariate relationship between settlement, total stress, and pore water pressure.
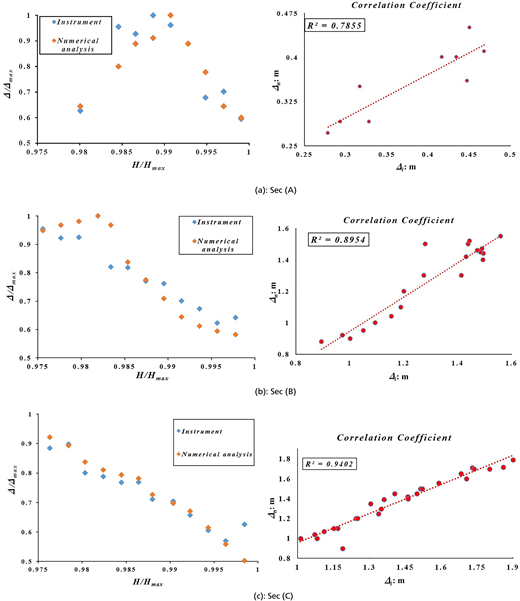
Settlements curves comparison and correlation coefficients in cross-sections A, B, C, D, and E
Settlements curves comparison and correlation coefficients in cross-sections A, B, C, D, and E
In Figure 6, H is the level at which settlement was measured (level of settlement plates), Hmax is the maximum dam crown level, Δ is the settlement, and Δmax is the maximum settlement.
5.2 Vertical stress
Pressure cells are tools that record changes in the total stress in different parts of the dam body. In Madani Dam, 120 pressure cells are installed in different body parts. Pressure cells measure stresses in three directions (two horizontal directions and one vertical direction). Table 4 shows the total vertical stress value obtained from pressure cells and numerical analysis.
Vertical stresses in cross-sections A, B, C, D, and E
| Cell no. | Location | Distance to axis: m | Install elevation: z | Vertical total stress: kPa | |
|---|---|---|---|---|---|
| Instruments | N. analyses | ||||
| APC.1 | Core centre | 0.74 | 1490.070 | 181 | 213 |
| APC.2 | Down-stream core | −6.685 | 1475.366 | 365 | 460 |
| APC.3 | Up-stream core | 6.754 | 1475.9 | 351 | 445 |
| BPC.1 | Core centre | 0.075 | 1490.1 | 189 | 234 |
| BPC.3 | Down-stream core | −9.546 | 1469.794 | 419 | 559 |
| BPC.4 | Up-stream core | 10.302 | 1469.794 | 413 | 552 |
| BPC.7 | Down-stream core | −17.061 | 1454.338 | 565.0 | 790 |
| BPC.8 | Core centre | 0.36 | 1454.457 | 615.0 | 820 |
| BPC.9 | Up-stream core | 18.025 | 1454.489 | 580 | 800 |
| BPC.11 | Down-stream core | −16.2 | 1439.205 | 805 | 1095 |
| BPC.12 | Core centre | 0.08 | 1439.164 | 880 | 1120 |
| BPC.13 | Up-stream core | 16.81 | 1439.161 | 845 | 1100 |
| CPC.1 | Core centre | 0.5 | 1490.11 | 192.4 | 240 |
| CPC.3 | Down-stream core | −10.541 | 1470.036 | 430 | 583 |
| CPC.4 | Up-stream core | 10.245 | 1469.935 | 419.3 | 579 |
| CPC.7 | Down-stream core | −16.926 | 1454.649 | 575.0 | 805 |
| CPC.8 | Core centre | 0.492 | 1454.66 | 630.18 | 845 |
| CPC.9 | Up-stream core | 17.957 | 1454.629 | 591.62 | 812 |
| CPC.12 | Down-stream core | −20.023 | 1430.909 | 1008.3 | 1250 |
| CPC.13 | Core centre | 0 | 1431 | — | 1270 |
| CPC.14 | Up-stream core | 20.312 | 1431.321 | 1070.5 | 1255 |
| CPC.16 | Down-stream core | −20.43 | 1420.294 | 1205 | 1425 |
| CPC.17 | Core centre | 0121 | 1420.55 | 1150 | 1440 |
| CPC.18 | Up-stream core | 19.841 | 1420.296 | 1160 | 1420 |
| DPC.1 | Core centre | 0.4 | 1490.11 | 184 | 226 |
| DPC.3 | Down-stream core | −10.692 | 1470.11 | 417 | 551 |
| DPC.4 | Up-stream core | 10.779 | 1470.159 | 408 | 544 |
| DPC.9 | Down-stream core | −17.917 | 1454.422 | 560.0 | 785 |
| DPC.10 | Core centre | 0.352 | 1454.488 | 605.0 | 820 |
| DPC.11 | Up-stream core | 17.965 | 1454.17 | 575 | 790 |
| DPC.6 | Down-stream core | −17.15 | 1439.158 | 790 | 1080 |
| DPC.7 | Core centre | 0.18 | 1439.044 | 850 | 1100 |
| DPC.8 | Up-stream core | 17.07 | 1439.129 | 822 | 1070 |
| EPC.1 | Core centre | 0.049 | 1489.96 | 175 | 204 |
| EPC.2 | Down-stream core | −6.88 | 1479.846 | 345 | 411 |
| EPC.3 | Up-stream core | 6.73 | 1479.907 | 321 | 404 |
In Table 4, PC is the vibrating wire pressure cell that was installed in five different cross-sections of the dam. The total stress value in the pressure cells is lower than the value obtained from the numerical analysis. Because there is less density around the cell than other parts of the core to prevent damage. The maximum vertical stress occurs at the centre of the core. The maximum value of the total stress obtained from pressure cells and numerical analysis at the junction of the core to the foundation is 1205 and 1440 kPa, respectively. The correlation coefficient between the total stress data obtained from the instrumentation and numerical analyses is 99.09%.
Figure 7 shows the stress change curves and the correlation coefficient between the data obtained from the results of pressure cells and numerical analysis.
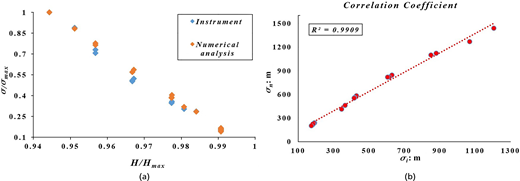
(a) Vertical total stress changes and (b) correlation coefficient between precision instruments and numerical analysis values of total stress
(a) Vertical total stress changes and (b) correlation coefficient between precision instruments and numerical analysis values of total stress
In Figures 7, H is the level of the plates, Hmax is the maximum dam crown level, σ is stress, and σmax is the maximum stress.
5.3 Pore water pressure
In Madani Dam, electric piezometers and Casagrande have been used to determine the pore pressure. Regarding the large width of the clay core, the presence of overburden, the low permeability of the core, and proper compaction, additional pore pressure has been created in the dam body. The maximum pore water pressure created 10 years after the end of construction has been observed in the lower levels and the middle part of the clay core (the place where the core is connected to the foundation). Table 5 shows the values of pore water pressure in sections C, B, and D obtained from electric piezometers (VP), Casagrande piezometers (SP), and numerical analysis.
Values of pore water pressure in cross-sections B, C, and D
| Piezometer no. | Location | Distance axis: m | Install elevation: z | Pore pressure | ru | Ru | |||
|---|---|---|---|---|---|---|---|---|---|
| Instruments | N. analysis | Instruments | N. analysis | Instruments | N. analysis | ||||
| BVP.7 | Down-stream core | −17.36 | 1439.18 | 358.6 | 375 | 0.27 | 0.28 | 0.44 | 0.34 |
| BVP.8 | Core centre | 0.48 | 1439.16 | 360.2 | 380 | 0.27 | 0.28 | 0.4 | 0.33 |
| BVP.9 | Up-stream core | 16.49 | 1439.22 | 366.5 | 385 | 0.28 | 0.29 | 0.43 | 0.35 |
| BSP.1 | Down-stream core | −15 | 1438 | 175 | 380 | 0.13 | 0.28 | — | 0.34 |
| BSP.2 | Core centre | −3.19 | 1438 | 161 | 383 | 0.12 | 0.28 | — | 0.33 |
| BSP.3 | Up-stream core | 13.38 | 1437 | 195 | 395 | 0.14 | 0.29 | — | 0.35 |
| CVP.10 | Down-stream core | −20.6 | 1420.52 | 340 | 402 | 0.2 | 0.24 | 0.28 | 0.282 |
| CVP.11 | Core centre | 0.422 | 1420.58 | 328 | 396 | 0.19 | 0.23 | 0.28 | 0.27 |
| CVP.12 | Up-stream core | 20.25 | 1420.29 | 347 | 414 | 0.2 | 0.24 | 0.29 | 0.29 |
| CSP.1 | Down-stream core | −16.24 | 1416.7 | 403 | 438 | 0.22 | 0.25 | — | 0.29 |
| CSP.2 | Core centre | −3.80 | 1416.7 | 392 | 425 | 0.22 | 0.24 | — | 0.28 |
| CSP.3 | Up-stream core | 15.9 | 1416.7 | 420 | 450 | 0.23 | 0.25 | — | 0.3 |
| DVP.4 | Down-stream core | −16.42 | 1439.14 | 377.7 | 355 | 0.28 | 0.27 | 0.47 | 0.32 |
| DVP.5 | Core centre | 0.12 | 1439.02 | 352 | 363 | 0.26 | 0.275 | 0.4 | 0.33 |
| DVP.6 | Up-stream core | 17.1 | 1439.1 | 361.1 | 380 | 0.27 | 0.28 | 0.43 | 0.35 |
| DSP.1 | Down-stream core | −14.91 | 1438 | 96 | 358 | 0.07 | 0.27 | — | 0.33 |
| DSP.2 | Core centre | −2.92 | 1439 | 86 | 363 | 0.06 | 0.275 | 0.1 | 0.33 |
| DSP.3 | Up-stream core | 14.85 | 1439 | 86 | 380 | 0.06 | 0.28 | 0.1 | 0.35 |
The maximum values of pore water pressure obtained from piezometers and numerical analysis are 420 and 450 kPa, respectively. Due to the passage of time and proper consolidation of the core material, there is a very good fit between the data. The correlation coefficient between the pore pressure data obtained from piezometer results and numerical analysis is 67.31%. The value of Ar, the arching ratio obtained from the monitoring of precision instrument data, and the results of numerical analysis are 0.35 and 0.47, respectively, which are close to the value of the design stage (0.5). The likelihood of arching and hydraulic failure due to the value of the arcing ratio and the large width of the core is not possible. After impounding, due to the water pressure on the upstream of the dam, the arching ratio must be checked because if the value of this ratio is small at the end of the construction, the possibility of arching to occur is very high. Figure 8 shows the change curve obtained from electric piezometers, and the correlation coefficient between the data obtained from the results of pressure cells and numerical analyses are presented.
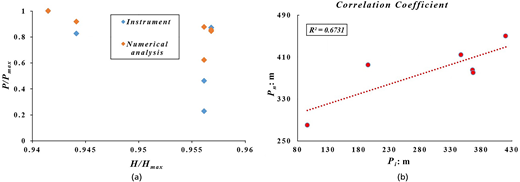
(a) Pore pressure changes and (b) correlation coefficient between numerical and experimental values of pore pressure
(a) Pore pressure changes and (b) correlation coefficient between numerical and experimental values of pore pressure
In Figures 8, H is the plate level, Hmax is the maximum dam crown level, ρ is the pore water pressure, and ρmax is the maximum pore water pressure.
In this section, we used 27 data with a correlation coefficient above 89%. Multivariate regression presented a relationship between the relative changes of the settlement (dependent variable) based on the relative changes of the pore water pressure and the total stress.
Equation 1 shows the relation of relative changes of the settlement.
where Y is the relative changes of settlement to maximum settlement (dependent variable), is the relative changes of stress to maximum stress (independent variable), and is the relative pore pressure changes to maximum pore water pressure (independent variable).
5.4 Reservoir impounding programme
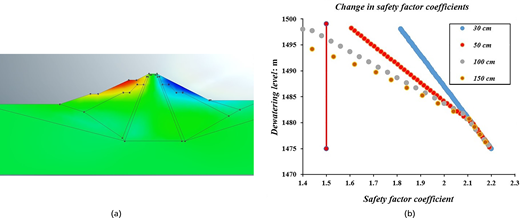
Due to the special conditions of the Madani rockfill dam, where the construction of the dam body took 10 years and another 10 years have passed since its completion, the reservoir impounding process will not follow conventional procedures. Therefore, a safe and specialised impounding plan for the Madani rockfill dam must be developed based on the dam’s specific conditions, including sensitivity analyses that involve numerical stability analyses assuming reservoir impounding at different levels. Simultaneous monitoring of key stability factors, such as impounding time, pore water pressure, stability safety factors, and effective stress, is essential. Furthermore, it is necessary to maintain appropriate monitoring of the dam’s stability during the reservoir impounding and operational phases by using data from settlement gauges, inclinometers, pressure cells, and electric piezometers installed at five cross-sections of the dam body. Based on this approach, it is recommended that for any dam that has not yet been impounded or is still under construction, a specialised impounding plan tailored to the specific conditions of that dam, including the construction period and other factors affecting dam stability, should be developed. Figures 9 and 10 show the dam body stability factors considering the time and different impounding levels, respectively. Figure 11 illustrates the changes in effect stress based on different reservoir impounding levels.

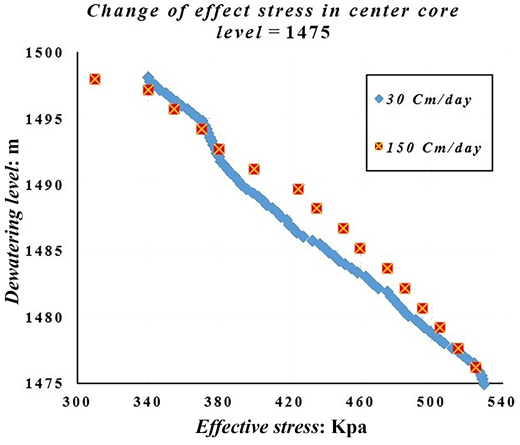
Variation of effective stress and levels of impounding the reservoir of the dam
Variation of effective stress and levels of impounding the reservoir of the dam
Figure 10 shows that the dam reservoir can be fully impounded in 80 d with a controlled filling rate of 30 cm/d. As the reservoir is filled, the clay cores become saturated, and water is expelled from the clay cores during this period. Under these conditions, the pore water pressure in the core and the dam body’s stability factor remain within acceptable limits. When the water level in the reservoir rises, the rate of pore pressure increase in the core slows down, and the rate of effect stress reduction decreases. In Figure 11, the changes in pore water pressure and effect stress in the core at two filling rates, 30 and 150 cm/d, are compared. Sensitivity analyses of the impounding process were conducted, and it is recommended that the reservoir be filled at a rate of 30 cm/d.
6. Conclusion
Max vertical settlement, based on instrumentation readings and numerical analyses, is 190 cm and 179 cm, respectively. The maximum vertical stress at the core-foundation interface, obtained from pressure cell readings and numerical analysis, is 1205 and 1440 kPa, respectively. The maximum pore water pressure recorded by installed piezometers and from numerical analysis is 420 and 450 kPa, respectively. The correlation coefficients between the instrument data and numerical analysis results for total stress, pore pressure, and settlement are 99.09, 67.31, and 83.8, respectively. The results indicate a very strong correlation between the numerical and experimental data. It is recommended to control the impounding rate of the reservoir to prevent increased pore water pressure during the impounding process and to avoid hydraulic failure. Based on the instrumentation data for the Madani dam body and numerical analysis results, it can be concluded that the dam’s instrumentation system provides accurate measurement and recording. The impounding of the reservoir for this specific dam should not be carried out solely based on conventional codes. Sensitivity analysis of the reservoir impounding at different levels until reaching the normal reservoir level was conducted. For this particular dam, given that 10 years have passed since the dam body was completed, with a maximum impounding rate of 30 cm/d, pore pressure in the core can be controlled, and by monitoring the stability safety factor and effective stress, the reservoir will be safely filled within 80 d. Therefore, it is recommended that for each earth or rockfill dam, a specific impounding plan should be developed, considering all safety aspects of the dam.

