
The Tohoku earthquake in 2011 caused several damages to the pipeline network in the Tokyo Bay area. Predominantly, the main damages were noticed in the artificial islands, where liquefaction destroyed and deformed numerous embedded pipelines. During a seismic event, lifeline systems are subjected to buoyancy forces in the liquefied soil, causing permanent deformations to pipelines and interrupting their serviceability. The current mitigation methods (backfill improvement) are not suitable for regions prone to future earthquakes because pipe excavation and improvement is time-consuming and costly. Therefore, the aim of this study is to present a new effective mitigation method: the so-called horn-type structure. This innovative mitigation method was analysed with different analytical, experimental and numerical methods.
Notation
- B
plate width
- D50
average grain size
- e
void ratio
- emax
maximal void ratio
- emin
minimal void ratio
- G
weight of the soil
- H
depth of embedment
- h
soil hardness
- ID
density index
- IR
dilatancy index
- k0
earth pressure coefficient at rest
- Nγ
dimensionless breakout factor
- p′
mean effective stress
- R(θ)
radius at the surface
- r
radius of the circular plate
- V
volume of soil above the plate
- γ
soil unit weight
- θ
angle of sliding surface
effective stress
internal friction at constant volume
maximal internal friction angle
Introduction
Historically, Japan is well known for being one of the most active seismic countries in the world. In the past century, Japan was struck by more than 40 earthquakes with a moment magnitude higher than 7.
The archipelago is located on the Pacific Ring of Fire and precisely between the Eurasian Plate, the Pacific Plate and the Philippine Plate. These are the most meaningful and active plate boundaries on the planet. Since Japan is a highly populated and infrastructurally advanced country, the potential numbers of fatalities and material costs provoked by an earthquake can be extremely high compared with those in other countries. Although the Japanese government is investing enormous effort for the seismic safety of structures and the development of new mitigation methods, the authorities were caught off guard on 11 March 2011, when the Tohoku earthquake struck the island of Honshu. The earthquake moment magnitude Mw was 9·0, and the epicentre was 70 km east of the Oshika Peninsula at an underwater depth of 30 km (Mimura et al., 2011). This earthquake, also called the Great East Japan earthquake, was the most powerful earthquake in the history of the nation.
Among the infrastructure damaged by the Tohoku earthquake were water supply pipelines. Figure 1 shows how the original design inclination of the pipeline was altered, and as consequence, an entire water supply network was compromised.
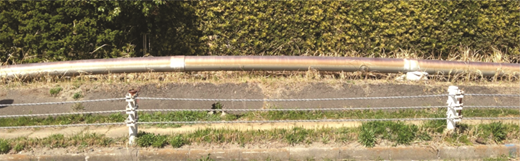
The depth of embedment of these pipelines varied from 0·5 to 1 m, and, therefore, they were categorised as shallow embedded pipelines. These damages caused permanent deformations to the pipelines and interrupted their serviceability for extended periods of time. Many of the pipeline damages were observed near Tokyo Bay. This area of the city is characterised for being expanded on reclaimed land. Reclaimed land is considered to be susceptible to liquefaction during seismic events (Bhattacharya et al., 2011). Several pipelines that were installed in this area were permanently deformed and uplifted because of the buoyancy force acting on them. As soon as the soil liquefies, all the embedded structures start to float in the liquefied soil and the lighter and shallower embedded pipelines tend to move upwards. As shown in Figure 1, the uplifting process can be so substantial that the pipelines are eventually uplifted above the ground surface.
In the past two decades, various authors have studied the problem of liquefaction-induced uplift of pipelines (Koseki et al., 1998). Despite being covered and protected by the surrounding soil, pipelines are subject to important uplift in the liquefied soil. The buoyant force affects them because their unit weight (0·39 g/cm3) is lower than that of the surrounding liquefied soil. When static, the shear strength and the weight of the soil prevent the flotation of the pipelines. During liquefaction, excess pore water pressure is generated, and the effective stresses are reduced drastically. The soil loses its shear strength and the pipeline tends to float.
The mitigation method derived by different authors suggests an improvement of the backfill by soil compaction and cement mixing. The old backfill is excavated and replaced with improved soil. The success of these methods was partially confirmed during the Chuetsu Offshore earthquake that occurred in 2007. One of the problems of these mitigation methods is that the enhanced backfill has to be applied in a larger portion of the pipeline system. In the case of a large pipeline network, the application of these methods can be time-consuming and expensive. After the 2011 Tohoku earthquake, the Japanese government started to show interest in new effective and inexpensive mitigation methods that could prevent damage to existing lifelines in the future. By considering these constraints, three new systems were developed (Towhata et al., 2015)
drainage pipes
chemical grouting
horn-type structure (HTS).
The common factor shared by these new methods is that the excavation is limited only in strategic locations along the network and little or no excavation is needed. This reduces the installation time and therefore the costs.
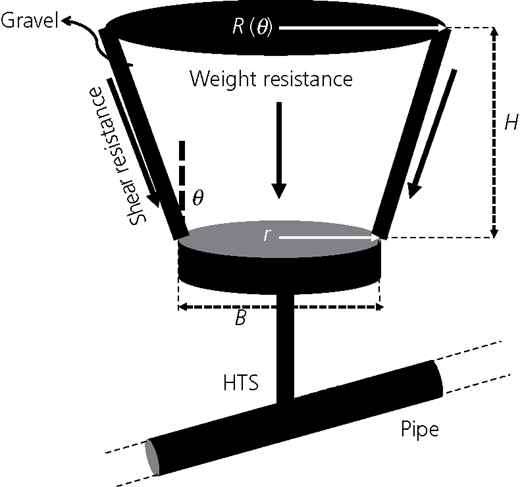
This study will focus on the HTS mitigation method (see Figure 2).
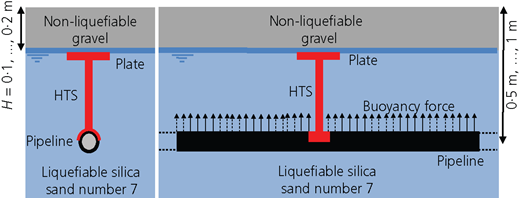
The plate is connected to the pipeline by way of a steel bar; during soil liquefaction, the pipe, which is surrounded by liquefied material, tends to move upwards because of the buoyancy force. At the same time, the plate is prone to move upwards, but due to the dead weight and the shear strength of the non-liquefiable soil at the surface, the pipe deformations are strongly reduced. The depth of embedment H of the plate varies between 0·1 and 0·2 m. Generally, a shallow embedment is considered for plates not deeper than 0·25 m. If a plate is embedded deeper than this value, it is known as a deep embedded plate. This study focused solely on shallow embedded plates (H = 0·1, …, 0·2 m); however, the differences between shallow and deep embedment will be outlined.
The HTS does not reduce the liquefaction potential, but it is a system that increases the uplift resistance of the pipeline. The objective of this research was to design the most appropriate HTS system depending on the soil properties present in the vicinity of the pipeline, the location (depth of embedment) of the pipeline and the dimension of the plate. The design formula developed in the past by various researchers (Dickin, 1988; Rowe and Davis, 1982) is verified with the new circumstances of the actual problem and used as a tool to optimise the design process of the HTS. This procedure also allows estimation of the numbers of HTS required depending on the length of the pipeline network.
To reach this goal, two main approaches were employed. The first approach was based on a qualitative analysis of the problem, and the second one on a quantitative analysis of the problem.
Three different qualitative tests were conducted
numerical modelling experiments
physical modelling experiments
particle image velocimetry (PIV) analysis.
The numerical modelling simulations were conducted with the finite-element model program Plaxis (Brinkgreve and Vermeer, 1998), and the physical modelling tests were performed at the drum centrifuge of the ETH Zurich (Springman et al., 2001). The main purpose of these qualitative experiments was to visualise the failure mechanism and to detect which forces are activated during the plate uplift.
On the other hand, the quantitative tests intended to develop an analytical formula that can approximate the resistance force. Dynamic and static plate uplift experiments were carried out to verify the results obtained by the analytical estimation.
The pull-out resistance of anchor plates in sand has been studied by various researchers. Rowe and Davis (1982) and Dickin (1988) analysed how the geometrical and soil variables influence the collapse load during the pull-out and proposed various formulas to define the resistance. In this study, the authors investigated the same problem with different approaches and verified the results obtained by previous researchers. After that, they derived their own empirical formula and applied it in the design of an HTS and the mitigation of pipeline deformation during seismic excitation.
Methods
To investigate the problem from several points of view, various tests were conducted at two different research institutes. The centrifuge and the numerical modelling experiments were carried out at the Institute of Geotechnical Engineering at ETH Zurich. The PIV analysis, the dynamic and the static plate uplift tests were performed at the University of Tokyo. The goal of the experimental part was to develop a reliable empirical formula that can predict the uplift resistance of the HTS system during a seismic event. The study focused solely on shallow embedded plates; however, the qualitative differences between the failure mechanism shapes of the deep and shallow embedment were evidenced.
Two approaches were used for the analysis of the problem. First, the failure mechanism during the plate uplift was analysed visually with the two-dimensional (2D) qualitative experiments. Second, the resistance force was estimated with three-dimensional (3D) quantitative experiments.
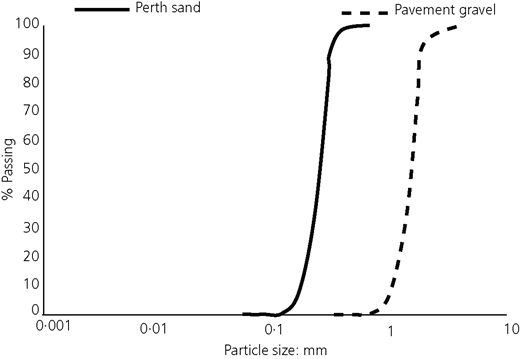
Since the main goal of the qualitative analysis was to visualise the failure mechanism, a fine-grained poorly graded sand (D50 = 0·22 mm), called Perth sand (Buchheister, 2009), was chosen. One of the reasons for choosing fine-grained sand was that with this material the borders of the shearing surface were sharper and therefore easier to identify. On the other hand, for the quantitative analysis, a more realistic and consequently coarser-grained material was chosen (D50 = 1·5 mm). Figure 3 illustrates the grain size distribution of the Perth sand and the gravel. Table 1 summarises the density properties.
Qualitative 2D experiments
The 2D approach consisted of
1g static qualitative pull-out experiments
physical modelling tests with the drum centrifuge at ETH Zurich
numerical modelling simulation with the finite-element program Plaxis.
The general goal of the 2D experiments was to visualise the failure mechanism of the shallow embedded plate during pull-out and to capture which forces were mobilised. Furthermore, the difference in the failure mechanism shape between the deep and shallow foundations was outlined.
2D 1g qualitative experiments
One of the advantages of the 2D 1g static pull-out experiments, compared with the 3D ones, was that during the plate uplift it was possible to visualise the development of the failure mechanism. In fact, the front wall of the soil container used for these experiments was made of a transparent poly(methyl methacrylate).
In the 3D experiments (Figure 4), the circular plate is placed in the middle of the box and the side-walls of the box are made of steel, and, therefore, the lateral visualisation of the failure mechanism was not possible. For the 2D experiments (Figure 5), the length of the plate (198 mm) is almost the same as that of the box (200 mm) and the front wall of the box is made of a transparent material, allowing the development and visualisation of the failure mechanism during the uplift.
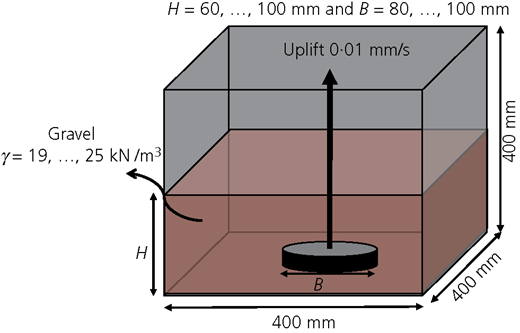
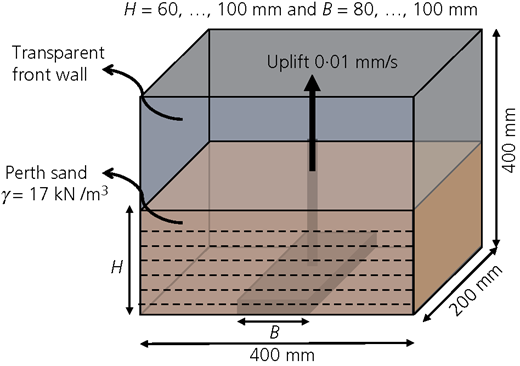
Figure 5 shows schematically the geometrical set-up of the tests. Throughout the plate uplift, the resistance force was measured with a load cell. The measured values were not pondered for the analysis of the problem since various boundary effects restricted the development of the failure mechanism and therefore reliable values were not delivered. However, the visualisation of the failure mechanism was indirectly important for the estimation of the resistance force. In fact, the observations outlined which forces were activated and relevant during the plate uplift.
The depth of embedment H and the plate width B varied between 60 and 100 mm (see Figure 5). These geometrical values are approximately in the same range of the prototype problem (100–200 mm) and accordingly consistent for the evaluation of the shape of the failure mechanism. The only difference was the material used for the embedment. In fact, an accurate identification of the failure mechanism and sliding surface required a clear and precise image analysis, and this was possible only with a fine-grained material, such as Perth sand.
The plate was positioned at the bottom of the soil container, and the soil was then poured in the box by air pluviation. The soil was released from a height of 40 cm out of a cone equipped with a sieve. The density of the soil was controlled by the diameter of the opening of the cone. A smaller diameter should provide a denser soil, while a larger diameter should provide a looser soil. With this method, it was possible to reach densities ρd of around 1·7 t/m3.
The 2D nature of the experiment was maintained since the length of the plate (198 mm) was nearly the same as that of the box (200 mm). This means that the analysis could be simplified with a plane strain problem. The small difference (2 mm) between the lengths of the box and the plate eliminated the friction between these two elements during the uplift. The boundary effects were reduced considering the fact that the depth of embedment of the plate was shallow (H/B < 1·5) (Hanna et al., 2007) and also because the affected area at the surface of the embedment was limited to a small area compared with the total width of the box.
The sand layers were marked by a thin layer of dark-coloured sand at the front transparent wall of the box, allowing the failure mechanisms to be clearly identified.
The transparent front wall allowed a camera to take pictures every 5 s during the uplift. The images taken by the camera were processed with the PIV software developed by White et al. (2003). The processed images outlined the failure mechanism shape. The plate uplift was displacement controlled with a constant uplift speed of 0·01 mm/s.
2D physical modelling tests
The 2D physical modelling experiments were carried out using the geotechnical drum centrifuge at ETH Zurich. The tests were conducted to determine the influence of the depth of embedment H on the failure mechanism shape. Table 2 shows the scaling law, or rather how an enhanced gravitational level influences the variables of the experiment. The tests were conducted at 10g, which means that the depth of embedment (Hmodel = 100 mm) was now ten times larger in the prototype dimensions (Hprototype = 1000 mm). The test set-up and the soil conditions were the same as the previous 1g experiments, and the only difference was that the experiment was conducted at 10g. A high-speed camera helped monitor the failure mechanism development during the plate pull-out.
Scaling law physical modelling
| Parameter | Model/prototype |
|---|---|
| Length | 1/N |
| Acceleration | N |
| Velocity | 1 |
| Strain | 1 |
| Force | 1/N2 |
| Mass | 1/N3 |
| Time | 1/N |
Since the plate uplift is a soil–structure interaction problem, the effect of the grain size should be minimised. To avoid the grain size effect, the width of the embedded plate (B = 100 mm) was 450 times larger than the average grain size diameter D50 = 0·22 mm. Various researchers (e.g. Dickin and Leung, 1983; Ovesen, 1981) suggested that the ratio (B/D50) between the width of the plate B and the average grain size D50 should be at least 50. This means that for this study the grain size effects were eliminated.
2D numerical modelling experiments
The numerical modelling analysis was performed with the 2D finite-element program Plaxis (Brinkgreve and Vermeer, 1998). This simulation was conducted to proof the results obtained from the physical modelling experiments at 10g (deep embedment).
Figure 6 shows the geometrical set-up for the numerical simulation, with the width of the plate (B) and the depth of embedment (H).
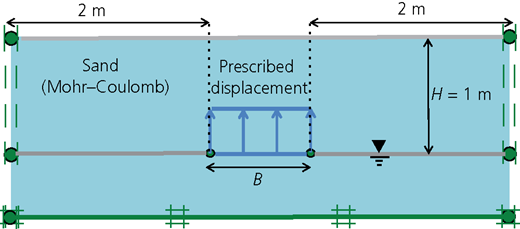
The boundary conditions of the physical modelling experiments were also reproduced in the numerical modelling simulation so that a direct comparison between the two methods was possible. The uplift movement of the plate was replicated with a prescribed displacement. This displacement was large enough to allow the failure mechanism to appear. The plate was modelled as an infinitely rigid material, which means that no bending was permitted. This assumption is also in good agreement with the full-scale problem, where it was supposed that the stiffness of the HTS was much greater than the soil stiffness.
The boundary conditions (see Figure 6) in this static analysis consisted of a free upper surface and a fixed side and lower boundaries. The groundwater level was confined in the liquefiable soil layer and therefore not relevant for the modelling of the upper non-liquefiable layer.
For the calculations, the Mohr–Coulomb model (Brinkgreve and Vermeer, 1998) was applied. The relevant material parameters for Perth sand are shown in Table 1.
Quantitative 3D experiments
The objective of the quantitative 3D experiments was to measure the resistant force during the plate pull-out and to verify the empirical formula proposed by previous researchers with the new conditions of the analysed problem. To reach this goal, static and dynamic 3D quantitative pull-out tests were conducted. All the experiments were carried out with the shallow embedded plate.
Since the dimensions and the material of the prototype and the tested models were comparable, the tests were conducted at 1g and the scaling effect was negligible.
3D static 1g uplift experiments
The test principles of the 3D experiments were similar to those of the 2D ones. The plate was located at the bottom of the box; the soil was poured per air pluviation, and at the end it was uplifted at a constant speed of 0·01 mm/s. A larger box (see Figure 4) was chosen and a different kind of soil was used.
For this set of experiments, a larger box was chosen with the aim of reducing the boundary effects and letting the failure mechanism develop freely without any restriction. The new boundary conditions allowed reliable uplift forces to be measured.
The employed soil differed from that used in previous qualitative experiments. A coarser-grained material (D50 = 1·5 mm) was chosen, and the most important parameters are summarised in Table 1. This type of soil represented the prototype situation properly since it was sufficiently available and inexpensive in the Tokyo Bay area.
The shape of the plate was circular, and the dimensions of the diameter B varied between 100 and 150 mm. A total of 17 tests were conducted with various combinations of the depth of embedment H, plate diameter B and soil unit weight γ (medium, loose and dense).
3D 1g dynamic uplift experiments
The dynamic experiments were conducted with the big shaking table at the University of Tokyo. The pipeline was embedded in a liquefiable soil layer of silica sand number 7 (Gs = 2·64, emax = 1·243, emin = 0·743, D50 = 0·206 mm, D10 = 0·115 mm, Uc = 2 and Dr = 30%), and its ends were connected to a rigid container with hinges (see Figure 7) (Rasouli, 2014).
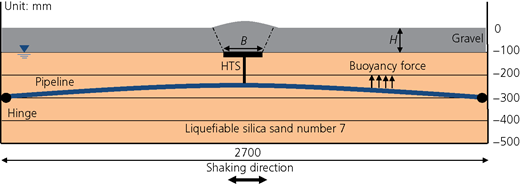
The pipeline was connected in the middle with the HTS system. On top of the liquefiable soil layer, the coarse-grained material, described previously, was poured into the box. The water was confined to the liquefiable soil layer. The input motion came from the shaking table located below the soil container. The time history of the input acceleration is shown in Figure 8 (1 Gal = 0·01 m/s2).
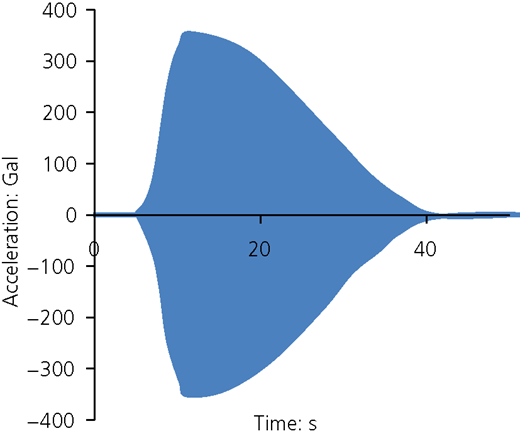
At this point, it has to be mentioned that the scaling law was negligible only for the upper non-liquefiable coarse-grained soil layer. To reproduce the liquefaction phenomena in the lower liquefiable soil layers, scaling measures had to be undertaken. The time history of the input acceleration consists of 250 cycles at 10 Hz with varying amplitudes from 0 to 350 Gal (0–3·50 m/s2) (Otsubo et al., 2016). The peak acceleration of the input motion is representative of a very rare earthquake (scaled to the boundary condition of a 1g shaking table event) that occurs once every 500 years. Since the size of the model was smaller than the prototype and consequently the effective stress in the liquefiable soil layer was lower, the frequency had to be increased by a factor of 10. The irregularity of a real earthquake was not crucial for the analysis of the vertical movement of the pipeline. The only goal of the horizontal input motion was to create the necessary condition so that the pipeline would start to float. The silica sand was made looser so that dilatancy should be similar in both the model and the prototype (Towhata, 2008). The excess pore water pressure development and the acceleration were measured. Load cells were installed inside the plate with the aim of measuring the resistance force acting on the plate during the uplift. The uplift movement was no longer displacement controlled. The upward movement was induced because of the buoyancy force. As the soil liquefied, the buried pipeline tended to move upwards and the HTS system prevented or reduced this tendency.
Results and discussion
Failure mechanism shape and activated forces
Figure 9(a) shows the failure mechanism obtained by the 1g 2D PIV analysis. These sets of experiments were conducted on shallow embedded plates. The sliding surface was straight and inclined from the vertical with an angle θ (°) and tended to curve outwards near the surface. This happened because the weight of the soil resisting the punching mechanism was smaller next to the surface and the affected area increased significantly in this upper region. To simplify the analysis, and being conservative at the same time (less shearing surface and less soil weight), the sliding surface was assumed to be straight along the entire height of the embedment following the inclination θ.
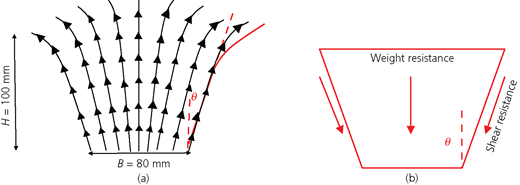
The qualitative study of the failure mechanism indicates that the soil affected by the plate uplift was not confined only to the area above the plate. Similar failure mechanisms were also noticed by Cheuk et al. (2008) and Murray and Geddes (1987) for pipelines buried in sand. As shown in Figure 9(b), the disturbed soil portion at the surface was bigger than the plate width itself, indicating the increase in the affected area above the plate. This means that in the case of a circular plate, the soil portion affected by the uplift corresponds to a truncated cone, since it is assumed that the sliding surface angle inclination θ stays constant along the entire height of the embedment (Figure 9). During the uplift, the shear forces along the sliding surface and the weight of the mobilised soil were activated.
Dilatancy and depth of embedment H effects on the failure mechanism shape
The qualitative experiments conducted on shallow embedded plates suggested that an increase in the soil density, and consequently the maximal internal friction angle , causes an enlargement of the sliding surface angle θ (see Figure 10).
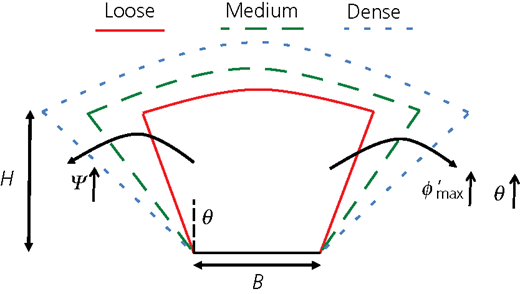
A higher density also leads to a higher maximal internal friction angle and consequently to a higher dilatancy angle Ψ. The following equation shows the dependency between the dilatancy angle Ψ and the maximal internal frictional angle , where represents the internal friction angle at constant volume
The test results suggest that between the angle of sliding surface θ and the dilatancy angle Ψ, a direct relationship persisted. In fact, as the maximal internal friction angle increases, the dilatancy angle also increases, and as a consequence, the angle of the sliding surface θ grows as well.
Studies conducted by Bolton (1986) proposed an empirical formula for the evaluation of the dilatancy index I R
where
The solution proposed by Bolton (1986) also outlines that the dilatancy index I R increases proportionally with the density index I D. On the other hand, the formula also shows that if the mean effective stress p′ increases, the dilatancy index I R decreases. This means that with the depth of embedment, the influence of the dilatancy is reduced.
Centrifuge and numerical modelling experiments also showed a similar behaviour for deep embedded foundations. The plate uplift was tested at 1g, at 10g and with the finite-element method program Plaxis. At 1g the depth of embedment H was 100 mm, and at 10g and with the numerical modelling simulation, H was 1000 mm. The observed failure mechanism differed significantly from that of the 2D qualitative shallow embedment analysis shown in Figure 9. In fact, the depth of embedment H of the tests conducted with the centrifuge at 10g and with the numerical simulation was ten times larger compared with that for the 1g tests (scaling effect) (Figure 11).
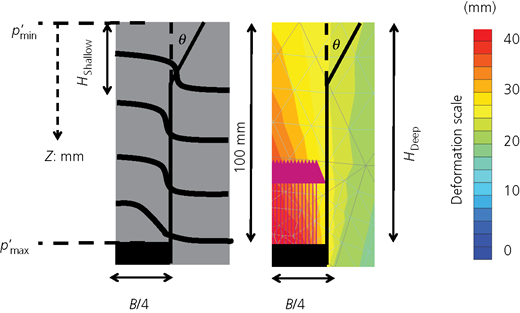
Failure mechanism shape of deep embedded plates obtained with physical modelling experiments (left) and numerical modelling simulation (right)
Failure mechanism shape of deep embedded plates obtained with physical modelling experiments (left) and numerical modelling simulation (right)
The experiments at 10g evidenced that from a certain depth of embedment (H shallow = 250 mm), the sliding surface remains constant and vertical (θ = 0°). This happens because the angle of sliding surface is directly proportional to the dilatancy angle and to the dilatancy index. As the depth of embedment H increases, the effective mean stress p′ also increases and subsequently the dilatancy index I R is reduced. A reduction in the dilatancy index causes a reduction in the sliding surface angle θ.
This study focused solely on the shallow embedded plates, and, therefore, it was assumed that the angle of the sliding surface θ differed from zero (θ ≠ 0°).
3D quantitative static results and empirical formula
The qualitative results suggest the shape of the failure mechanism and which forces were activated. From this information, it was possible to develop an analytical formula based on the principles utilised by previous researchers (Rowe and Davis, 1982) and to adapt it to the current problem. The analytical formula is summarised in Equation 5, and Figure 12 shows schematically the portion of the soil and the forces mobilised during the uplift (Otsubo et al., 2016; Taeseri et al., 2015).
where H is the depth of embedment, R(θ) is the radius at the surface, r is the radius of the plate, k 0 is the earth pressure coefficient at rest, γ is the soil unit weight, is the internal friction angle at constant volume and θ is the angle of sliding surface.
Two major forces composed the total resistance force: the weight resistance and the shear resistance. As evidenced in Equation 5 for a given soil unit weight γ and plate geometry, the total resistance force depends solely on the sliding surface angle θ. At this point, it was necessary to obtain experimentally an estimation of the total resistance force to back-calculate the angle of sliding surface θ. For this purpose, 17 3D static pull-out tests were conducted at 1g. The main variables were the gravel unit weight γ (kN/m3), the depth of embedment H (m) and the plate diameter B (m). The normalised results of these tests are shown in Figure 13 for medium and loose packing of the gravel.
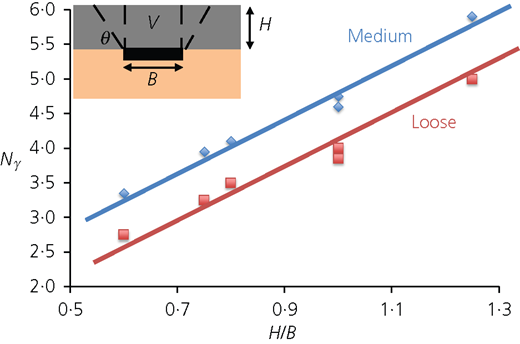
Relationship between Nγ and H/B for the loose and medium gravel density derived from the experimental analysis
Relationship between Nγ and H/B for the loose and medium gravel density derived from the experimental analysis
The total resistance is commonly expressed as a dimensionless breakout factor Nγ (Nγ = total resistance/(Vγ )), which is calculated by dividing the measured total resistance by the weight of the soil G (kN) above the plate (G (kN) = V (m3) × γ (kN/m3)).
As may be seen in Figure 13, an almost direct linear relationship exists for a given density between the dimensionless breakout factor Nγ and H/B. Thus, for a particular geometrical set-up H/B and soil unit weight γ, it is possible to quantify the resistance force.
As already deducted by the qualitative image analysis, the angle of sliding surface θ depends on the maximal internal friction angle . Using the 3D analysis, it was possible to quantify the relationship between and θ.
Figure 14 shows the values of the back-calculated inclination of the sliding surface θ for different densities of the overlying soil with θ increasing with density, and Table 3 summarises the results.
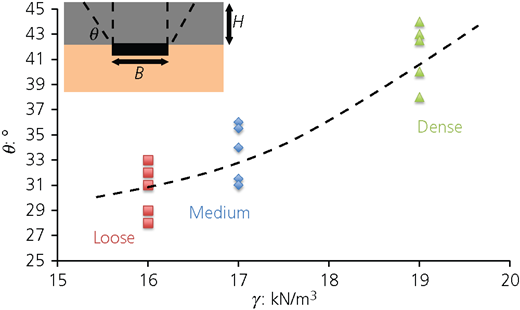
Relationship between maximal internal friction angle and the angle of sliding surface θ
| θ: ° | : ° | |
|---|---|---|
| Loose | 30 | 35 |
| Medium | 35 | 40 |
| Dense | 40 | 45 |
Considering the direct relation between the density of the soil and the maximum internal friction angle , a simple correlation between the inclination of the sliding surface θ and was suggested
Dynamic against static resistance
The angle of sliding surface and its relation to the maximum internal friction angle were further analysed using 1g shaking table tests. During shaking, the sand layer liquefies and the embedded pipeline tends to move upwards because of the buoyancy force, but the horn structure prevents the upward displacement. For the same geometrical set-up and density, static and dynamic tests were conducted. The results (Figure 15) show that the dynamic resistance was almost half of the static resistance.
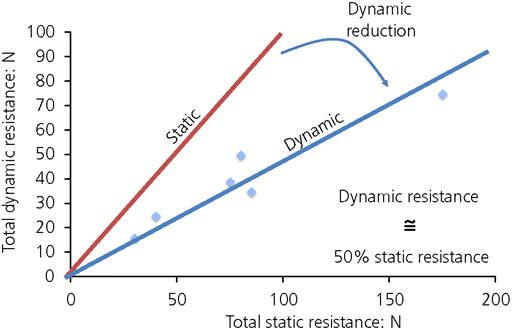
The main reason for the drop in the resistance force is the value of the angle of sliding surface θ. The back-calculated values of the sliding surface under dynamic load (θ Dynamic) showed much smaller values compared with those in the static case
Therefore, the effect of the angle of sliding surface almost disappears during seismic events and the portion of soil affected is almost restricted to the volume above the plate.
Conclusions
The main goal of this study was to understand the failure mechanism caused by the upward movement of the plate under static and dynamic conditions and to develop a simple formula for the design of the HTS.
The qualitative 2D numerical and physical modelling tests outlined the shape of the failure mechanism and suggested that the sliding surface was not vertical but inclined at an angle θ (°). The qualitative analysis indicates that two major components contribute to the total resistance: the weight of the soil acting on the plate and the shear forces along the sling surface. The qualitative results also suggest that with the depth of embedment H the failure mechanism shape changes. Physical and numerical modelling experiments reproduced the necessary conditions for a deep embedded plate. The results evidence that the portion of the soil activated above the plate changes for deep embedded plates compared with that for shallow embedded plates.
The influence of the density on the angle of sliding surface was also analysed, and a direct relationship between θ and was proposed.
A simple analytical formula was developed based on the information obtained from the 2D analysis. It is evident that the angle of sliding surface θ significantly influences the total resistance force. For this reason, 3D static and dynamic plate pull-out tests were conducted with the aim of first quantifying θ and then finding a simple relationship between θ and the maximum internal friction angle . The results show that in the static case, the angle of sliding surface θ is just 5° smaller than the maximum friction angle . During seismic events, this angle is reduced significantly by 30°.
Since excavation and backfilling of an existing pipeline network would be costly and time-consuming, a new mitigation method was required.
The results outline that the HTS can have a relevant impact on the uplift resistance of new and, particularly, existing pipelines. Different geometrical aspects and soil properties have to be considered for the design and installation of the HTS. In terms of effectiveness, the installation of the HTS is faster and therefore economical compared with that of the existing mitigation methods. One of the interesting points of this innovative mitigation method is that, owing to HTS, the upper non-liquefiable layer acts not only as pavement but also as support for the pipeline.
To confirm the conclusions derived from this research, further 3D quantitative numerical and physical modelling experiments have to be conducted. Furthermore, a more adequate and sophisticated constitutive model should be chosen for the numerical modelling.
The softening of the upper layer due to the dissipation of the excess pore water pressure during soil liquefaction should be analysed numerically and experimentally to understand the effect that can cause the physical phenomenon. Further experiments should be conducted with a permeable plate to detect any influences on the capacity of the HTS.
