

Tests on small-scale physical models of a strip footing resting on a dense sand bed containing a thin horizontal weak soil layer were carried out at normal gravity (1g). The results, reported in a companion paper, point out that the weak layer plays an important role in the failure mechanism and the ultimate bearing capacity of the footing if it falls within the ground volume relevant to the behaviour of the sand–footing system. The same problem was also investigated by means of centrifuge tests on reduced-scale models at 25g and 40g. The results of these tests, reported and discussed in this paper, confirm that failure mechanisms are governed substantially by the presence of the weak layer if its depth does not exceed a critical value and highlight marked scale effects involving the ultimate bearing capacity related essentially to the mean equivalent stress level in the soil beneath and around the footing. Equivalent bearing capacity factors, , for footings on a dense sand bed containing a thin weak layer are derived from experimental results and are proposed in the paper.
Notation
- B
footing width
- Bm
base width of model
- Bp
base width of prototype
- CU
uniformity coefficient
cohesion intercept of sand
- Dr
relative density
- d
particle diameter
- d50
mean particle size
- E′
Young’s modulus
- e
void ratio
- e0
initial void ratio
- emax
maximum void ratio
- emin
minimum void ratio
- Gs1
specific gravity of sand
- g
gravity acceleration
- K0
coefficient of Earth pressure at rest
- L
footing length
- lm
lateral extent of failure mechanism
- N
ratio between the centrifuge test and gravity accelerations
- n
porosity
- n0
initial porosity
- Q
vertical load applied to the footing
- q
mean vertical pressure acting on the footing base
- qlim
ultimate (or limit) bearing pressure (at peak) or ultimate bearing capacity
- qlim,0
ultimate bearing pressure (at peak) of footing on homogeneous sand bed
- t0
thickness of weak layer
- zi
depth from the ground surface of the weak layer
- zm
depth from the ground surface of the deepest point of the failure mechanism
- γd1
dry weight of sand
- γd2
dry unit weight of weak layer
- γs1
specific weight of sand
- δ′
angle of shearing resistance of the footing–sand interface
angle of friction of the glass–sand interface
- θ
emersion angle of the failure surface; θ L and θ R on the left and right sides of the footing, respectively
- ν′
Poisson’s ratio
- ρ
settlement of the footing
- ρ*
density (or volumic mass)
- ρlim
settlement of the footing in correspondence of q lim
- σ′
normal effective stress
vertical effective stress
- τ
shear stress
angle of shearing resistance of sand
angle of shearing resistance of sand at constant volume (or at critical porosity)
peak angle of shearing resistance of sand
mean equivalent angle of shearing strength
angle of shearing resistance of the weak layer
peak dilation angle of sand
Introduction
Minor geological and geotechnical details can have great relevance for seepage and consolidation processes as well as for the movements and stability of natural and manmade geotechnical systems (Leonards, 1982; Rowe, 1972; Terzaghi, 1929). The simplest of such details is probably exemplified by a thin horizontal weak soil layer interbedded in a mass of stiffer soil. This problem was recently investigated with reference to the ultimate bearing capacity of strip footings by 1g small-scale model tests discussed in a companion paper (Valore et al., 2017).
These tests highlighted that the weak layer, despite its thinness, can markedly affect the failure mechanism and significantly reduce the ultimate bearing capacity. However, it is well known that 1g tests on reduced-scale models suffer from severe limitations due to scale effects associated, first of all, with the very low stresses in the granular soil of the model (e.g. de Beer (1965), Vesić (1975), Kimura et al. (1985), Bolton and Lau (1989), Kusakabe et al. (1991), Ueno et al. (2001), Zhu et al. (2001), Lau and Bolton (2011a)).
To investigate scale effects on failure mechanisms and on the bearing capacity, centrifuge experiments at enhanced gravity of 25g and 40g were carried out. It is well known that these kinds of tests also serve the important purpose of providing reliable physical data to verify numerical methods as clearly pointed out by Ng (2014). Ten centrifuge tests were performed.
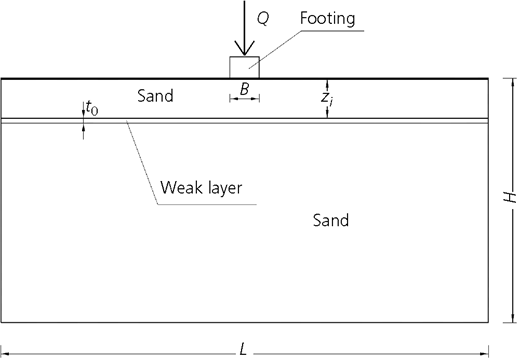
The problem dealt with can be schematised with reference to the front view of the reduced-scale model shown in Figure 1. The strip footing is a rigid punch and rests on the surface of a dry sand mass in which a thin horizontal layer, t0 thick, made of a weaker material than sand, is interposed at depth zi. Plane strain conditions are assumed.
The results of the tests are reported and discussed in the present paper.
Instrumentation
Centrifuge
The small-scale model tests were carried out using the Istituto Sperimentale Modelli Geotecnici (ISMGeo) seismic geotechnical centrifuge, which is a beam centrifuge made up of a symmetrical rotating arm with a diameter of 6 m, a height of 2 m and a width of 1 m, which gives it a nominal radius of 2 m. The arm holds two swinging platforms, one used to carry the model container and the other the counterweight. During the tests, the platforms lock horizontally onto the arm to prevent the transmission of the working loads to the basket suspensions. An outer fairing covers the arm; the arm and fairing concurrently rotate to reduce air resistance and perturbations during flight. The centrifuge has the potential of reaching an acceleration of 600g at a payload of 400 kg. Further details can be found in the papers of Baldi et al. (1988), Fioravante (1999) and Fioravante et al. (2012). The dimensions of the tested models are length = 0·62 m, height = 0·28 m and width = 0·16 m.
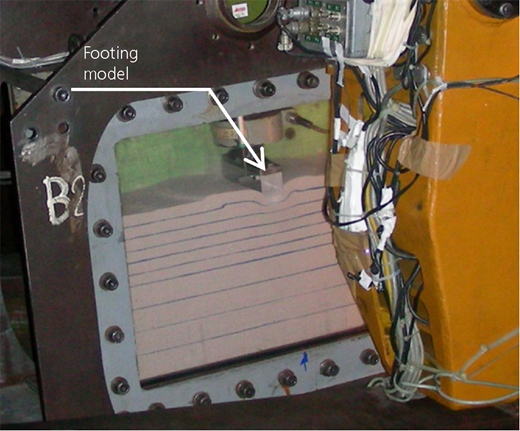
A picture of a model at the end of a test is shown in Figure 2.
Load application
The axial load is applied by a mechanical actuator that pushes the footing into the sand at a constant rate of displacement of 0·5 mm/min. The load is measured by a 50 kN hydraulic cell.
Data acquisition system and measurements
Data are recorded by an automatic six-channel system, with an acquisition frequency of one record every 2 s. The radial acceleration is measured by a piezoresistive accelerometer. The settlement of two opposite vertices of the top face of the footing and of a point of the soil surface located at a distance from the centroid of the footing base of 17·8 cm (equal to 4·45B) are measured by means of linear displacement transducers (LDTs). Images of the frontal face of the model are taken through a poly(methyl methacrylate) (PMMA) window by a video-recording colour digital camera.
Model preparation
The model was prepared in the ISMGeo geotechnical laboratory adjoining the centrifuge room and then placed aboard the centrifuge.
Sand
The foundation soil, apart from the weaker layer, consists of silica sand and is hereafter called sand B. The sand grains are subrounded to angular. Each soil model was reconstituted at 1g to the target void ratio by pluviating, in air, the dry sand into a rigid container by using a travelling sand spreader. The target density was obtained by calibrating the height of fall and the size of the spreader hole. The height of fall of 1 m was kept constant during the deposition in order to achieve uniformity of the soil density within the sand bed. The main characteristics of sand B are summarised in Table 1, where the average void ratio, e 0, the porosity, n, dry density, γ d1 and relative density, D r of the models before acceleration are also indicated.
Characteristics and initial index properties of sand B
| G s1 | γ s1: kN/m3 | e 0 | n 0 | e min | e max | D r: % | γ d1: kN/m3 | d max: mm | d 60: mm | d 50: mm | d 10: mm | C U = d 60/d 10 |
|---|---|---|---|---|---|---|---|---|---|---|---|---|
| 2·65 | 26 | 0·647 | 0·393 | 0·634 | 0·897 | 95 | 15·8 | 0·85 | 0·47 | 0·45 | 0·33 | 1·42 |
Minimum and maximum void ratios were determined according to ASTM standards D 4253-00 (ASTM, 2004a) and D 4254-00 (ASTM, 2004b)
From the mineralogical point of view, sand B is essentially composed of silica (more than 95%). There are, however, traces of feldspars and calcite.
In order to compare the results of 1g and centrifuge tests and to study the scale effects, sand B was also used in 1g tests on 40 mm wide footings (Valore et al., 2017), according to a well-established practice (Altaee and Fellenius, 1994; Kimura et al., 1985; Schofield, 1980; Toyosawa et al., 2013; Yamaguchi et al., 1977). It is worth noting that the ratio of the footing width to the mean particle size, B/d 50 = 40/0·45 = 88·9, is larger than 50, which is the minimum value beyond which the particle size effect can be considered negligible, as suggested by many researchers (e.g. Mikasa and Takasa (1973), Ovesen (1975), Gemperline and Ko (1984), Kutter et al. (1988), Tatsuoka et al. (1991), Kusakabe (1995), Herle and Tejchman (1997), Toyosawa et al. (2013)).
The crushing of the sand particles during the tests has been considered negligible due to the grading and the mineralogy of the sand and the mean stress level existing in the soil volume involved in failure (Valore and Ziccarelli, 2009).
The peak strength failure envelope of sand B, obtained from direct shear tests on dry sand (Figure 3), is strongly curvilinear in the range of low normal stresses. For very low normal stresses, the shear strength parameters vary as follows: = 0 and > 50° for σ′ < 20 kPa; = 0 and = 50° for σ′ < 50 kPa; and = 0 and = 45° for σ′ > 50 kPa, being the secant angle of shearing resistance. The relation between and the normal effective stress, , is shown in Figure 3(c). The peak dilation angle, , was obtained from the results of direct shear tests and decreases with normal stress, . Within the range of relevant to the present research, varies from 17 to 21° and is in good agreement with Bolton’s relation: = 1·25 ( − ) (Bolton, 1986). The angle of shearing strength at constant volume is 32°.
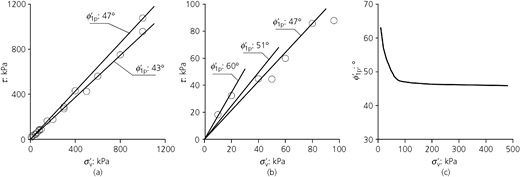
Peak strength failure envelope from direct shear results on dry silica sand B: (a) all tests and (b) tests at low stresses. (c) Secant angle of peak shearing resistance as a function of the effective vertical normal stress
Peak strength failure envelope from direct shear results on dry silica sand B: (a) all tests and (b) tests at low stresses. (c) Secant angle of peak shearing resistance as a function of the effective vertical normal stress
The average values of peak strength parameters at the average stresses relevant to the models tested in the centrifuge, modified for the effects of the intermediate effective principal stress for plane strain conditions (Meyerhof, 1951; Roscoe, 1970; Rowe, 1969; Tatsuoka et al., 1986a, 1986b), are summarised in Table 2.
Materials of the weak layer
The material used for the weak layer is the ‘CM3’ dry talc powder that was also used in tests at single gravity (Valore et al., 2017). The angle of peak shear strength, , of this material was determined by direct shear tests and is equal to 27°. The cohesion intercept and dilation angles of the CM3 talc powder are negligible. The initial (i.e. before centrifuge testing) weak layer thickness was 5 mm.
Footing
The footing is made of aluminium and can be considered rigid; its width, B, and length, L, are 40 and 160 mm, respectively. Sandpaper was glued onto the footing base. The settlements of the footing are uniform. The peak angle of shearing resistance, δ′, of the interface between the silica sand and the sandpaper was 42° (Valore et al., 2017). As the average peak shearing resistance angle, , of silica sand was about 48° at the stress level relevant to the model tests, the sand–footing contact can be considered perfectly rough (Hansen and Christensen, 1969; Kumar and Kouzer, 2007), since > 0·7 (Fioravante, 2002; Garnier and König, 1998; Kishida and Useugi, 1987; Lings and Dietz, 2005).
The values of the base width of the models (B m) and prototypes (B p) are summarised in Table 3.
PMMA–sand friction
To minimise the friction, the sand–PMMA interface was lubricated with silicone oil. Although the PMMA–sand friction is not nil, it is believed that the actual deformation state can be approximately considered two dimensional.
Model formation
The sand was poured into the test box by using the dry pluviation procedure. Through a proper apparatus with a 2 mm slit, a horizontal speed of 10 cm/s and a constant fall height of 100 cm, it was possible to obtain a dry soil with a uniform initial unit weight, γ 1d, of 15·8 kN/m3. The weak layer was formed with dry talc powder (type CM3). It was formed by pouring a known weight of talc powder into the test box, and then it was gently compressed by means of a flat wooden pestle in order to obtain a regular layer 5 mm thick.
Testing procedure
The following sequence was used.
The centrifuge was accelerated up to the selected acceleration, a (25g or 40g); in this phase, the footing was suspended over the soil.
The soil model densification due to self-weight at constant acceleration was monitored.
At the end of the in-flight densification (i.e. end of soil surface settlement, as measured by an LDT), a deceleration/acceleration cycle of a/2 (half of testing acceleration) was carried out. At the end of this phase, the settlement of the top surface of the homogeneous sand bed was 0·5 cm for both tests at 25g and 40g. This settlement implies an increase in the dry unit weight from 15·8 to 16·1 kN/m3.
The footing was gently lowered until contact with the model surface was achieved. The loading test was then performed. The footing was pushed at a constant rate of displacement of about 0·5 mm/min, and the axial load Q was measured by a load cell until the failure load was attained (ultimate bearing capacity). Subsequently, the loading continued until a settlement of about 25 mm (≈0·6B) was attained.
The duration (after the start of the loading proves) of each test ranged from 15 to 40 min.
The homogeneous sand bed test and the tests on sand containing a weak layer made of dry talc powder were, of course, drained since both the sand and the talc were dry.
Results
The results of tests are summarised in Tables 4 and 5 for a = 25g (N = a/g = 25) and a = 40g (N = 40), respectively.
Results of centrifuge tests performed at acceleration a = 25g on strip footing models resting on a sand bed containing a thin horizontal weak layer
| Weak layer | Test | zi/Bm | t0: mm | lm: mm | lm/Bm | zm: mm | zm/Bm | θL: ° | θR: ° | qlim: kPa | qlim/qlim,0 | ρm,lim: mm | ρm,lim/Bm |
|---|---|---|---|---|---|---|---|---|---|---|---|---|---|
| Dry CM3 talc powder | C02 | 1 | 7 | 106 | 2·65 | 40 | 1·00 | 39 | 36 | 2118·2 | 0·55 | 5·39 | 0·13 |
| C03 | 2 | 5 | 161·4 | 4·04 | 80 | 2·00 | 36 | — | 2413·9 | 0·62 | 5·95 | 0·15 | |
| C08 | 3 | 5 | 116·9 | 2·92 | 57·3 | 1·43 | — | 39 | 3117·3 | 0·81 | 7·09 | 0·18 | |
| Homogeneous sand bed | C01 | — | — | 104 | 2·6 | 40 | 1 | 30 | 31 | 3869·7 | 1 | 5·39 | 0·15 |
Results of test C01 on homogeneous sand bed is also reported for comparison
Bm = 40 mm, footing model width; zi, depth of the top surface of the weak layer; t0, thickness of the weak layer; qlim, ultimate bearing capacity; qlim,0 = 3869·7 kPa, ultimate bearing capacity for the homogeneous sand case; ρm,lim, settlement of footing model corresponding to ultimate bearing capacity; lm, maximum lateral extent of failure mechanism; zm, maximum depth of failure mechanism; θL and θR, emersion angles of the failure surface on the left and right sides of the footing, respectively
Results of centrifuge tests performed at acceleration a = 40g on strip footing models resting on a sand bed containing a horizontal thin weak layer
| Weak layer | Test | zi/Bm | t0: mm | lm: mm | lm/Bm | zm: mm | zm/Bm | θL: ° | θR: ° | qlim: kPa | qlim/qlim,0 | ρm,lim: mm | ρm,lim/Bm |
|---|---|---|---|---|---|---|---|---|---|---|---|---|---|
| Dry CM3 talc powder | C05 | 1 | 7 | 101 | 2·53 | 40 | 1·00 | 38 | 36 | 2575·1 | 0·52 | 5·38 | 0·13 |
| C06 | 2 | 7 | 179 | 4·48 | 80 | 2·00 | 33 | — | 3163·9 | 0·62 | 5·95 | 0·15 | |
| C07 | 2·95 | 7 | 180 | 4·5 | 71 | 1·77 | — | 40 | 4285·1 | 0·87 | 8·59 | 0·21 | |
| C10 | 0·5 | 6 | 47·3 | 1·18 | 35 | 0·88 | 46 | 45 | 3144·7 | 0·64 | 7·35 | 0·18 | |
| Homogeneous sand bed | C04 | — | — | 104 | 2·6 | 63 | 1 | 30 | 31 | 4937·2 | 1 | 6·62 | 0·17 |
| C09 | — | — | 155 | 3·87 | 57 | 1·43 | — | 39 | 4767 | 1 | 6·49 | 0·16 |
Results of tests C04 and C09 on homogeneous sand bed also reported for comparison
Bm = 40 mm, footing model width; zi, depth of the top surface of the weak layer; t0, thickness of the weak layer; qlim, ultimate bearing capacity; qlim,0 = 4937·2 kPa, ultimate bearing capacity for the homogeneous sand case; ρm,lim, settlement of footing model corresponding to ultimate bearing capacity; lm, maximum lateral extent of failure mechanism; zm, maximum depth of failure mechanism; θL and θR, emersion angles of the failure surface on the left and right sides of the footing, respectively
Failure mechanisms
Observed failure mechanisms are sketched in Figure 4 for tests at 25g (N = 25) and in Figures 5 and 6 for tests at 40g (N = 40). Some photographs of the models are shown in Figures 7 and 8. The photograph of test B63 performed at 1g (Valore et al., 2017) is included in Figure 8 for comparison.
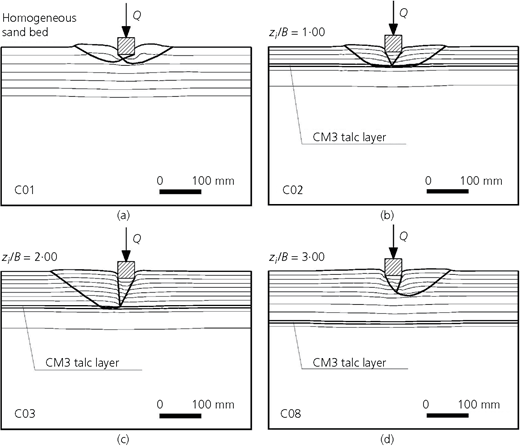
Failure mechanisms observed in centrifuge tests performed at 25g (N = 25). B m = 40 mm. (a) Homogeneous sand bed; (b) ratio zi/B = 1; (c) zi/B = 2; (d) zi/B = 3. The weak layer is shown as double-thickness lines; the thin lines are initially horizontally aligned coloured sand particles
Failure mechanisms observed in centrifuge tests performed at 25g (N = 25). B m = 40 mm. (a) Homogeneous sand bed; (b) ratio zi/B = 1; (c) zi/B = 2; (d) zi/B = 3. The weak layer is shown as double-thickness lines; the thin lines are initially horizontally aligned coloured sand particles
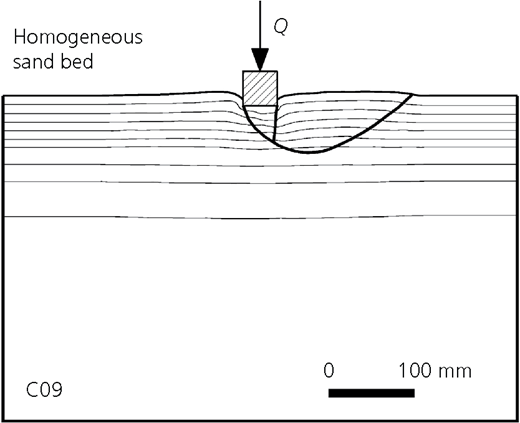
Failure mechanisms observed in centrifuge tests performed at 40g (N = 40). B m = 40 mm. Homogeneous sand bed. Thin lines are initially horizontally aligned coloured sand particles
Failure mechanisms observed in centrifuge tests performed at 40g (N = 40). B m = 40 mm. Homogeneous sand bed. Thin lines are initially horizontally aligned coloured sand particles
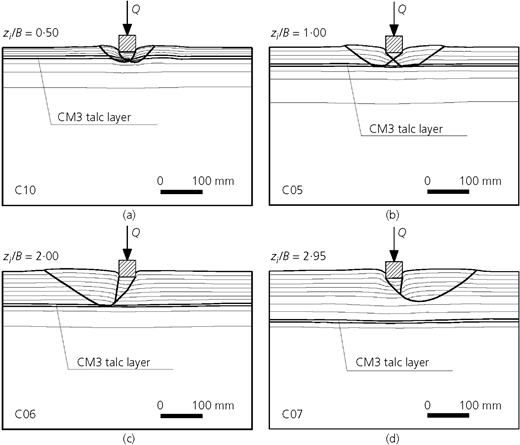
Failure mechanisms observed in tests performed at 40g (N = 40). B m = 40 mm: (a) ratio zi/B = 0·5; (b) zi/B = 1; (c) zi/B = 2; (d) zi/B = 2·95. The weak layer is shown as double-thickness lines; the thin lines are initially horizontally aligned coloured sand particles
Failure mechanisms observed in tests performed at 40g (N = 40). B m = 40 mm: (a) ratio zi/B = 0·5; (b) zi/B = 1; (c) zi/B = 2; (d) zi/B = 2·95. The weak layer is shown as double-thickness lines; the thin lines are initially horizontally aligned coloured sand particles
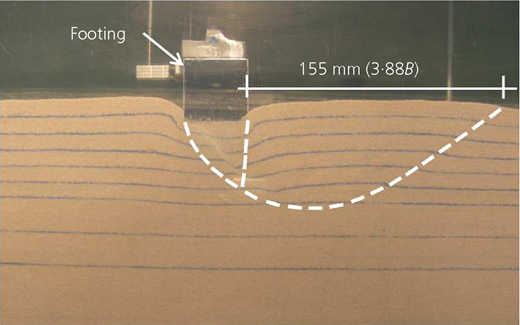
Failure mechanism for footing resting on homogeneous sand bed. Test C09 at 40g. B m = 40 mm
Failure mechanism for footing resting on homogeneous sand bed. Test C09 at 40g. B m = 40 mm
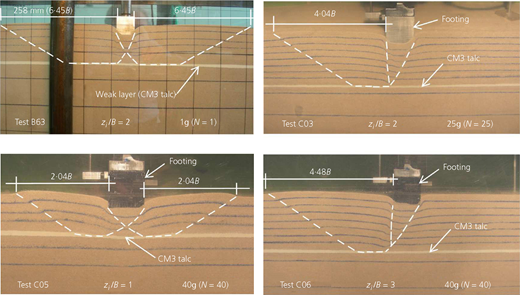
Typical failure mechanisms observed in tests on sand bed containing a weak layer, at 1g and at enhanced gravity. B m = 40 mm. Note that the scales of the photographs are not the same. White broken lines are failure mechanism
Typical failure mechanisms observed in tests on sand bed containing a weak layer, at 1g and at enhanced gravity. B m = 40 mm. Note that the scales of the photographs are not the same. White broken lines are failure mechanism
General shear failure mechanism (Vesić, 1973) was observed in all experiments. Some observed failure mechanisms were not symmetric. Every effort was made to ensure initial geometric and mechanical symmetry of the tested physical models. But symmetry at the macroscopic scale does not imply an always-perfect symmetry at the microscopic level. Non-symmetric mechanisms could originate from initial non-symmetric texture and non-perfectly symmetric distribution of the pores. Results of many physical model experiments on strip footings reported in geotechnical literature yield non-symmetric failure mechanisms, particularly for foundation soil consisting of sands (e.g. Muhs (1965), Yamaguchi et al. (1976), Kimura et al. (1985), Tatsuoka et al. (1991), Kusakabe (1992), Aiban and Znidarčić (1995), Tatsuoka (2001), McMahon and Bolton (2011)). It is worth mentioning that Yamaguchi et al. (1976) discovered non-symmetry in centrifuge models at 40g (B m = 20, 30 and 40 mm, B p = 0·80, 1·2 and 1·60) using radiography, while Kimura et al. (1985) demonstrated, also by means of X-ray techniques, that at 20g (B m = 30 mm, B p = 0·6 m) that the slip lines are not symmetric when the base of the footing is rough, while for smooth bases the slip lines are very nearly symmetric.
In the case of the homogeneous sand bed, the failure surfaces resemble that of Prandtl (1920), but their lateral extent is smaller; see Figures 4(a), 5 and 7. Failure surfaces emerge at the ground level at an average angle θ to the horizontal of about 45° − /2. When the weak layer is present, θ ranges from 33 to 39° and is very close to 45° − /2 ( = 15–20°). The failure surface crosses the weak layer if it is located at depth z i ≤ 0·5B m, both at 1g and at enhanced gravity, since its shear strength is high enough to transfer shear stresses to the underlying soil. In contrast, if z i ≥ 3B m, the mechanisms run entirely within the upper sand layer and are almost identical to those pertaining to the homogeneous sand bed but the ultimate bearing capacity is lower than that of the homogeneous case. This difference is probably due to the fact that the stress state, the stress paths and the strain paths in the sand bed with a weak layer differ from the corresponding ones in the homogeneous sand bed. If 0·5B m ≤ z i ≤ 3B m, the failure mechanisms run partly along the weak layer. It is to be noted that for a depth of the weak layer of z i/B = 2, the lateral extension of the failure mechanism relative to the 1g test is greater than that at enhanced gravity (see Figure 8).
The results of centrifuge tests confirm the great influence of the weak layer on failure mechanisms and on ultimate bearing capacity.
Ultimate bearing capacity
The bearing pressure–normalised settlement curves are shown in Figures 9 and 10 for accelerations of 25g (N = 25) and 40g (N = 40), respectively. Results of some 1g tests (cf. Valore et al. (2017)) are shown in Figure 11 for comparison.
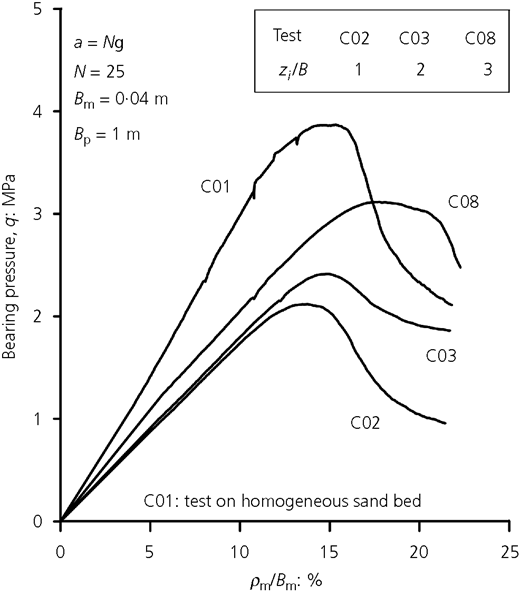
Bearing pressure-normalised settlement curves for tests performed at a = 25g. Results of test C01 performed on homogeneous sand bed are reported for comparison. B m = 40 mm; B p = 1 m; z i, depth of the weak layer. Weak layer made of CM3 talc powder
Bearing pressure-normalised settlement curves for tests performed at a = 25g. Results of test C01 performed on homogeneous sand bed are reported for comparison. B m = 40 mm; B p = 1 m; z i, depth of the weak layer. Weak layer made of CM3 talc powder
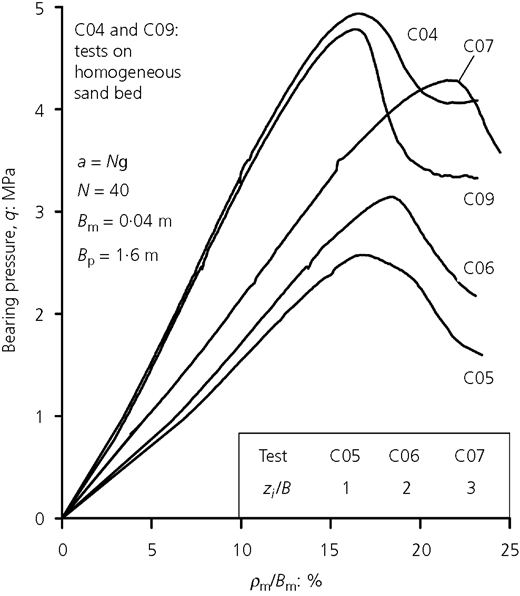
Bearing pressure-normalised settlement curves for tests performed at a = 40g. Results of tests C04 and C09 performed on homogeneous sand bed are reported for comparison. B m = 40 mm; B p = 1·6 m. z i, depth of the weak layer. Weak layer made of CM3 talc powder
Bearing pressure-normalised settlement curves for tests performed at a = 40g. Results of tests C04 and C09 performed on homogeneous sand bed are reported for comparison. B m = 40 mm; B p = 1·6 m. z i, depth of the weak layer. Weak layer made of CM3 talc powder
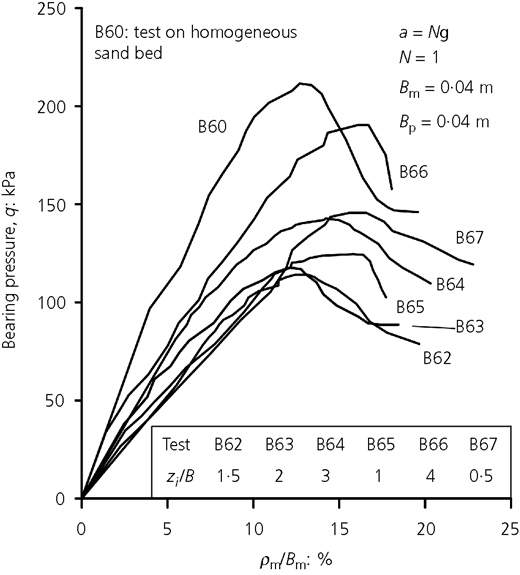
Bearing pressure-normalised settlement curves for tests at a = 1g on sand B. Test B60, on homogeneous sand bed, shown for comparison. B m = B p = 0·04 m. z i, depth of the weak layer. Weak layer made of CM3 talc powder
Bearing pressure-normalised settlement curves for tests at a = 1g on sand B. Test B60, on homogeneous sand bed, shown for comparison. B m = B p = 0·04 m. z i, depth of the weak layer. Weak layer made of CM3 talc powder
In all cases, the curves are characterised by a distinct peak corresponding to the ultimate bearing capacity, q lim. Beyond the peak, the applied pressure, q, undergoes a conspicuous, but not abrupt, decrease. The normalised settlement, ρ m,lim/B m, when the weak layer is lacking, is about 14 and 15·5% for the centrifuge tests at 25g and 40g, respectively; in the presence of the weak layer, ρ m,lim/B m varies from 14 to 18%, respectively, for the centrifuge tests at 25g and from 15 to 21% for the centrifuge tests at 40g. The settlements corresponding to the peak therefore range from about 0·15B m to 0·2B m; their influences on q lim are negligible according to Ovesen (1975), Pu and Ko (1988) and Dijkstra et al. (2013).
The normalised applied pressure, q/B p, in the function of the normalised settlement, ρ p/B p, is reported in Figure 12 for tests on homogeneous sand bed and in Figure 13 for tests on sand bed with a weak layer.
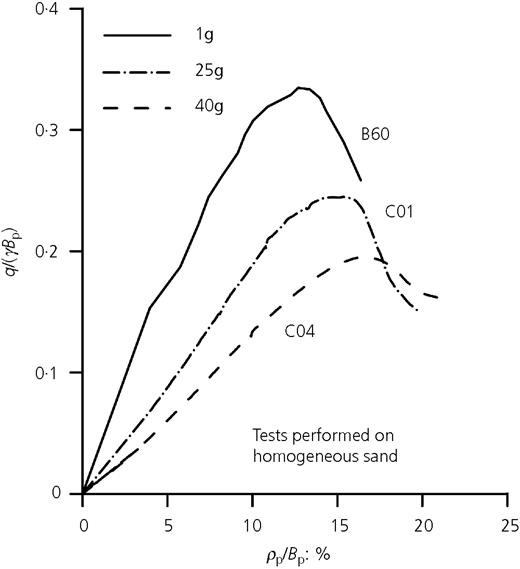
Tests on homogeneous sand. Normalised bearing pressure-normalised settlement curves at 1g (N = 1), 25g (N = 25) and 40g (N = 40)
Tests on homogeneous sand. Normalised bearing pressure-normalised settlement curves at 1g (N = 1), 25g (N = 25) and 40g (N = 40)
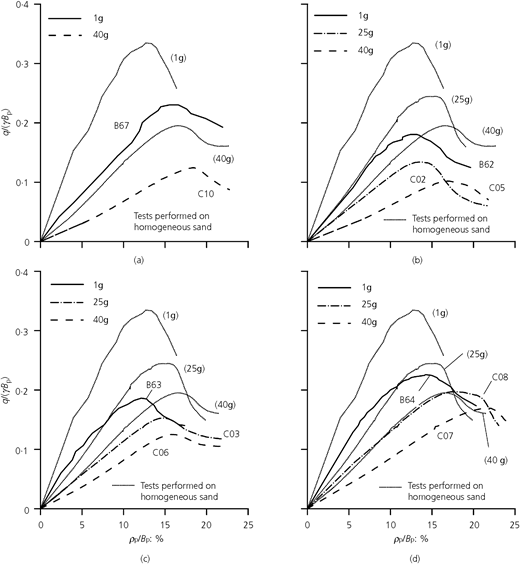
Normalised bearing pressure-normalised displacement curves in the function of the ratio z i/B for tests at 1g (N = 1), 25g (N = 25) and 40g (N = 40): (a) z i /B = 0·5, (b) z i /B = 1, (c) z i/B = 2 and (d) z i/B = 3. Dotted lines refer to tests carried out on homogeneous sand and are plotted for comparison
Normalised bearing pressure-normalised displacement curves in the function of the ratio z i/B for tests at 1g (N = 1), 25g (N = 25) and 40g (N = 40): (a) z i /B = 0·5, (b) z i /B = 1, (c) z i/B = 2 and (d) z i/B = 3. Dotted lines refer to tests carried out on homogeneous sand and are plotted for comparison
The results plotted in Figures 12 and 13 show that the normalised applied pressure decreases as the stresses increase with the centrifuge acceleration (a = N g), both in homogeneous soil and in the presence of the weak layer.
Figure 14 shows the bearing pressure q–normalised settlement ρ m/B m curves for a = 25g (N = 25) and an equivalent width of the prototype footing 40 × 25 mm = 1 m and for a = 40g (N = 40) corresponding to an equivalent prototype width of 1·60 m. These curves show a rather small-scale effect in compliance with the modelling concepts. Figure 14 also shows that the curves, at the same z i/B, are characterised by fairly comparable stiffnesses and that the stiffness in the presence of the weak layer is smaller than that for the homogeneous case (Figure 14(a)). Moreover, the stiffness increases with z i/B (Figures 14(b)–14(d)).
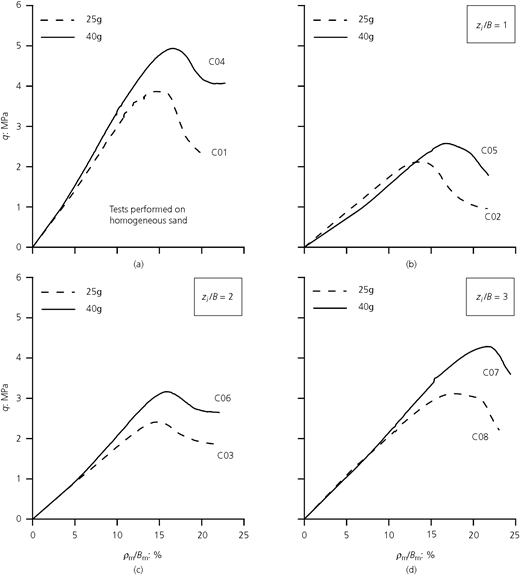
Bearing pressure–normalised settlement curves as a function of the ratio z i/B for tests at 25g (N = 25) and 40g (N = 40). Tests C01 and C04 performed on homogeneous sand. At 25g and 40g, the equivalent prototype footing widths B p are 1 and 1·6 m, respectively
Bearing pressure–normalised settlement curves as a function of the ratio z i/B for tests at 25g (N = 25) and 40g (N = 40). Tests C01 and C04 performed on homogeneous sand. At 25g and 40g, the equivalent prototype footing widths B p are 1 and 1·6 m, respectively
The ultimate bearing capacity, q lim, has been normalised with respect to the ultimate bearing capacity, q lim,0, relative to the case of the homogeneous sand bed. The values of q lim,0 are 3870 kPa for N = 25 and 4937 kPa for N = 40. The ratio q lim/q lim,0 is plotted against z i/B in Figure 15. In this figure, the results relative to those of 1g tests are also plotted for comparison. The minimum value of q lim/q lim,0 is attained at z i/B = 1 with a reduction of the ultimate bearing capacity from 45 to 50% compared to the homogeneous sand case for tests at 25g and 40g, respectively. For the single-gravity tests, this reduction is 46% and occurs at z i/B = 1. q lim tends to q lim,0 at z i/B larger than 4 for both 1g and centrifuge tests.
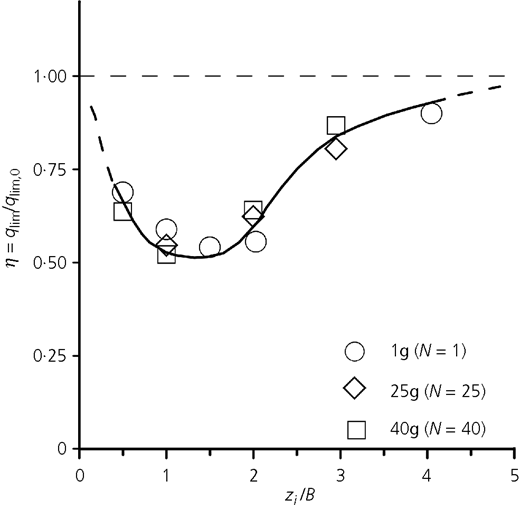
Normalised ultimate bearing capacity q lim/q lim,0 against normalised depth z i/B for different values of N = a/g of the weak layer. q lim,0, ultimate bearing capacity of the footing on homogeneous sand. B m = 40 mm, footing width; z i, depth of the weak layer. Data relative to 1g tests (sand B) reported for comparison. Weak layers made of CM3 talc powder with = 27°
Normalised ultimate bearing capacity q lim/q lim,0 against normalised depth z i/B for different values of N = a/g of the weak layer. q lim,0, ultimate bearing capacity of the footing on homogeneous sand. B m = 40 mm, footing width; z i, depth of the weak layer. Data relative to 1g tests (sand B) reported for comparison. Weak layers made of CM3 talc powder with = 27°
The results presented earlier demonstrate the strong influence of the presence of a thin weak layer on the ultimate bearing capacity, q lim, which can undergo reductions as high as 48% relative to weak layers made of CM3 talc powder with = 27°. Larger reductions are expected for < 27°. These results confirm those relative to tests performed at a = 1g on the same sand B (d 50 = 0·45 mm) and on a coarser sand A (d 50 = 0·95 mm) (Valore et al., 2017).
Scale effects
It is well known that the ultimate bearing capacity reduces with increasing footing size and with increasing mean stress level (e.g. Bjerrum (1973), de Beer (1970), Shiraishi (1990), Briaud and Jeanjean (1994), Cerato and Lutenegger (2007), Kumar and Katri (2008), White et al. (2008), Chakraborty and Kumar (2016)).
The stress effects originate, first of all, from the marked curvature of the dense sand failure envelope that is particularly relevant at low stress. In small-scale physical models, the self-weight stresses are very or extremely low under ‘normal-gravity’ conditions; as a consequence, the angle of shearing resistance is higher and variable along the failure surface, contrary to what happens for real footings. Stress effects may also depend on the heterogeneity of the foundation soil and progressive failure. According to Muhs (1965), Hettler and Gudheus (1988) and Lau and Bolton (2011a), progressive failure may be considered marginal in small-scale model tests such as the present ones.
Figures 16 and 17 show the results of the model tests at different accelerations (1g, 25g and 40g) on the same sand B (cp. Valore et al. (2017) for 1g tests). In Figure 16(a), the trend of the ‘equivalent ultimate bearing capacity factor’ = 2q lim/(γB p) is plotted against the prototype width, B p, while in Figure 16(b), the experimental results relative to footing on homogeneous sand were compared with other experimental data (Kimura et al., 1985; Yamaguchi et al., 1976) and with some theoretical solution (Brinch Hansen, 1970; Kumar and Kouzer, 2007; Terzaghi, 1943; Vesić, 1973). In Figure 17, the ultimate bearing pressure, q lim, is plotted against B p.
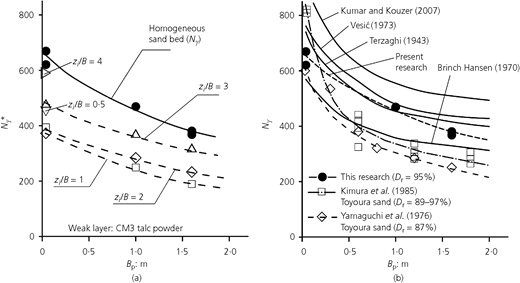
Strip footing on sand B with or without a weak layer at depth z i. Weak layer made of CM3 talc powder. (a) Equivalent ultimate bearing capacity factor Nγ * = 2q lim/(γ d B p) against B p equivalent prototype width. (b) Nγ for strip footing on homogeneous sand. Comparison of results of the present research with other experimental data and with theoretical solutions for values according to Figure 3(c)
Strip footing on sand B with or without a weak layer at depth z i. Weak layer made of CM3 talc powder. (a) Equivalent ultimate bearing capacity factor Nγ * = 2q lim/(γ d B p) against B p equivalent prototype width. (b) Nγ for strip footing on homogeneous sand. Comparison of results of the present research with other experimental data and with theoretical solutions for values according to Figure 3(c)
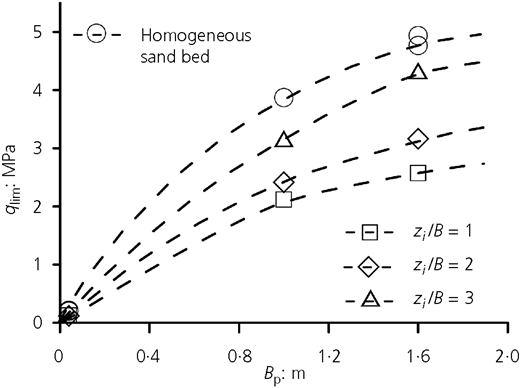
Ultimate bearing capacity q lim against prototype width B p. z i, depth of the weak layer made of CM3 talc powder
Ultimate bearing capacity q lim against prototype width B p. z i, depth of the weak layer made of CM3 talc powder
for centrifuge tests was computed with reference to γ d = 16·1 kN/m3 (instead of γ d = 15·8 kN/m3 pertinent to single-gravity tests) in order to account for the densification undergone by the sand during the densification cycle phase.
The results shown in Figures 16 and 17 and in Figures 12 and 13 clearly confirm the well-known scale effects relative to homogeneous soils, observed both in single-gravity and in centrifuge tests (Kimura et al., 1985; Kutter et al., 1988; Tatsuoka et al., 1991; Ueno et al., 1998; Yamaguchi et al., 1977). They also demonstrate that the scale effects are present and are important for footings resting on sand bed in which a weak layer is present at depths smaller than a critical value, z crit, depending on the ratio of its shear resistance angle () and that of the sand (). z crit for the tested physical models ranges from 4B m to 4·5B m.
In all the analysed cases, for footings resting on either a homogeneous sand bed or one with a weak layer, at the same relative density of the sand, the general failure mechanisms are similar but the lateral extent of the failure surface in centrifuge tests is smaller than that in 1g tests. This is due to the fact that higher mean angles of shearing resistance operate in 1g tests.
Back-analysis
The main aims of the numerical analysis are to back-calculate the mobilised mean equivalent constant angle of shearing resistance, , of the sand (Lau and Bolton, 2011b) corresponding to the ultimate bearing pressure, qlim, and to compare the features of the computed failure mechanisms against the experimental ones.
The reference scheme for the finite-element (FE) analysis is shown in Figure 18 along with the boundary conditions. Plane strain state and drained conditions are assumed. To avoid mesh-related dissymmetries, only the half model is analysed. The unit weight of the materials and the angle of shearing resistance of the weak layer are assumed to be known. The cohesion intercept is always considered nil. The numerical simulations are carried out using the FE code Plaxis 2D (Plaxis, 2008), considering the geometry of the reduced-scale physical model of the soil–footing system for single-gravity as well as for centrifuge tests. The unit weight of soils has been set equal to γ = Ngρ* (N = 1, 25 or 40, ρ* being the density). The footing is subjected to a vertical load, Q, corresponding to an average bearing pressure, q, on the soil–footing interface. Actually, a uniform vertical settlement of the footing base is imposed rather than the vertical load, Q, so duplicating the true experimental procedure and accounting for the high stiffness of the footing and for the roughness of its base (Lee et al., 2013). The simple elastic-perfectly plastic Mohr–Coulomb constitutive model with non-associated flow rule is used for soils as many other authors have (e.g. Bolton and Lau (1993), Yin et al. (2001), Potts (2003), Mabrouki et al. (2010), Kumar and Khatri (2011)). Geometric variations of the system and their effects on the stress state in the soil are not taken into account. This hypothesis and the assumption of perfect plasticity imply that pre-peak hardening, post-peak strain softening and the dependence of angle of shearing resistance, , on stress level variations within the relevant soil volume are not taken into account, although there are more sophisticated constitutive models available that allow modelling of the post-peak behaviour of the soil–footing system (e.g. Potts and Zdravkovic (1999), Yin et al. (2001), Potts (2003), Siddiquee et al. (1999, 2001), Cassidy et al. (2002), Salgado (2008), Loukidis and Salgado (2009, 2011)). An equivalent constant mean value of has been sought (Lau and Bolton, 2011b; Lee et al., 2013). Of course, under 1g conditions, the shear strength parameters in the low-stress range strongly depend on the effective stress level; consequently, they vary, within the relevant soil volume, from ‘lower’ values in the zone beneath the footing (where the effective normal stresses are relatively large) to higher values within the passive zone, where the stresses in tested 1g physical models are low or extremely low (Lau and Bolton, 2011a, 2011b). In contrast, in the case of centrifuge tests at 25g or 40g, the average stress intensity within the relevant soil volume is high enough so that only modest variations in occur along the failure mechanism.
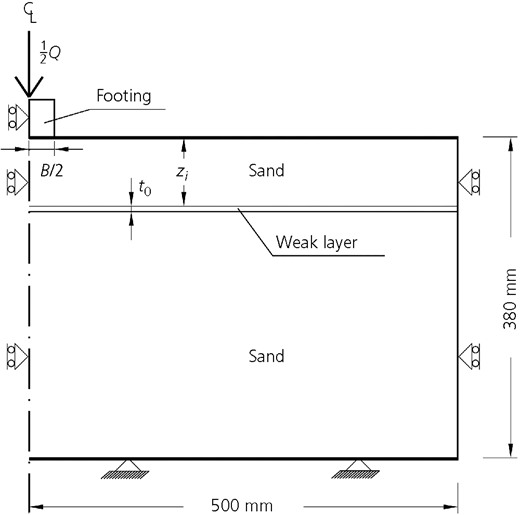
Reference scheme for FE analysis. Unit weight of soil γ = Ngρ* (N = 1, 25 or 40). Q, vertical load or resultant of the pressures transmitted to the soil by the footing
Reference scheme for FE analysis. Unit weight of soil γ = Ngρ* (N = 1, 25 or 40). Q, vertical load or resultant of the pressures transmitted to the soil by the footing
The dilatancy angle was always related to the peak shear strength, , by Bolton’s relation = 1·25 ( − ) (Bolton, 1986), in which = 32°. Progressive failure is not taken into account as suggested by the results in 1g small- and large-scale physical models and in centrifuge tests carried out by Muhs (1965), Hettler and Gudheus (1988) and Lau and Bolton (2011a). The preceding hypotheses do not permit the prediction of the behaviour of the soil–footing system beyond the peak bearing pressure (Potts and Zdravkovic, 1999, 2001).
Homogeneous sand bed
First, the homogeneous sand bed–footing systems were back-analysed. A good match of experimental and calculated results was reached as far as the ultimate bearing pressure, q lim,0, the bearing pressure–settlement curve (up to q lim,0) and the failure mechanisms are concerned.
The following parameters have been considered for the sand: Young’s modulus: E′ = 125 MPa, Poisson’s ratio ν′ = 0·15 and coefficient of Earth pressure at rest K 0 = 0·4. Results of the back-analysis for tests performed at acceleration a = 40g (N = 40) are shown in Figures 19 and 20. The failure mechanism (Figure 19) closely resembles Prandtl’s (1920) except for the angle of emersion at ground surface that nearly equals 45° −/2 (instead of 45° − /2). The small instability of numerical results in the pre-peak phase is due to the non-associativity of the constitutive model (Frydman and Burd, 1997).
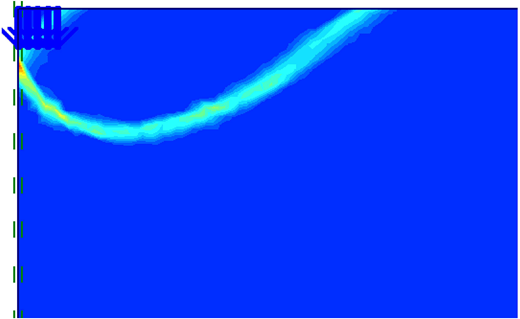
Footing on homogeneous sand bed, N = 40. Incremental shear strains at failure. Compare with test C04
Footing on homogeneous sand bed, N = 40. Incremental shear strains at failure. Compare with test C04
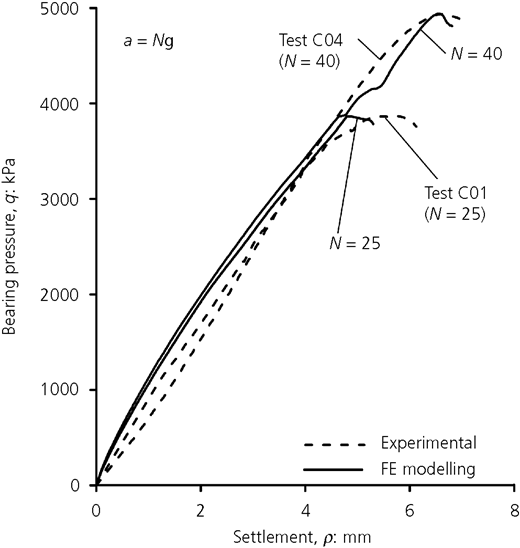
Footing on homogeneous sand bed. Comparison between numerical and experimental load–settlement curves (test C04, N = 40; test C01, N = 25)
Footing on homogeneous sand bed. Comparison between numerical and experimental load–settlement curves (test C04, N = 40; test C01, N = 25)
The values of the equivalent mean angle of mobilised shear strength are = 47·8° ( = 19·5°) for tests at 25g (N = 25) and =47·6° ( = 19·7°) for tests at 40g (N = 40).
The calculated values of are in good agreement with the experimental results of direct shear tests (Figure 3) pertaining to the range of normal stress from 250 to 350 kPa. This range has been selected according to Meyerhof (1951), who suggested that the value of the mean normal stress, , along the failure surface is about 1/10 of the ultimate bearing capacity, q lim, and according to de Beer (1965), who proposed the following relation: = 0·25q lim(1 − sin ).
Sand bed with weak layer
Despite its simplifications, the numerical analysis allows accurate identification of the failure mechanisms that match the experimental ones quite well, as shown, for example, by Figures 21–23, which are to be compared to the results of centrifuge tests at 40g: C10, C05 and C06. For the sake of simplicity of the numerical simulation, the values of Young’s modulus, Poisson’s ratio and the dry unit weight, γ d2, of the weak layer were assumed equal to those of the sand. The calculations were performed assuming, always (i.e. irrespectively of the depth of the weak layer), for sand = 47·6° obtained from the back-analysis of test C04 at 40g on homogeneous sand bed. The numerical analyses confirm that when the weak layer is located at depth z i = 0·5B, the failure mechanism crosses the weak layer, develops through a radial shear zone within the underlying sand and runs upwards along an inclined plane inclined 45° (Figure 6(a)), which crosses the weak layer again before emerging onto the ground surface. In the cases shown in Figures 22 and 23, the failure mechanisms found by the numerical analysis develop in part along the weak layer similarly to experimental results.
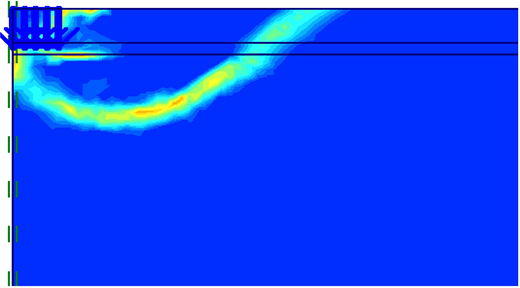
Incremental shear strains at failure for z i /B = 0·5. Weak layer made of CM3 talc powder. Compare with test C10 (Figure 6(a)). N = 40
Incremental shear strains at failure for z i /B = 0·5. Weak layer made of CM3 talc powder. Compare with test C10 (Figure 6(a)). N = 40
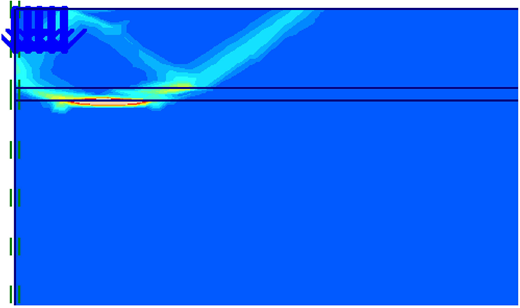
Incremental shear strains at failure for z i /B = 1. Weak layer made of CM3 talc powder. Compare with test C05 (Figure 6(b)). N = 40
Incremental shear strains at failure for z i /B = 1. Weak layer made of CM3 talc powder. Compare with test C05 (Figure 6(b)). N = 40
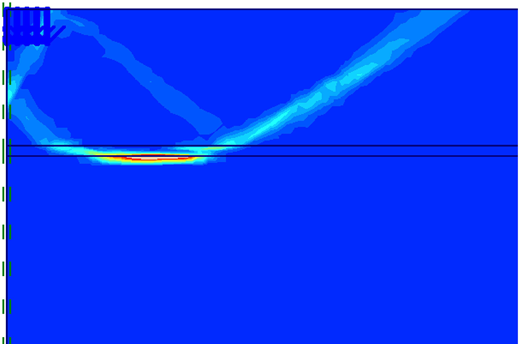
Incremental shear strains at failure for z i /B = 2. Weak layer made of CM3 talc powder. Compare with test C06 (Figure 6(c)). N = 40
Incremental shear strains at failure for z i /B = 2. Weak layer made of CM3 talc powder. Compare with test C06 (Figure 6(c)). N = 40
The values of q lim/q lim,0 calculated by using the equivalent constant strength parameters of the sand back-calculated for the homogeneous case for N = 25 and N = 40 are plotted in Figures 24 and 25, respectively.
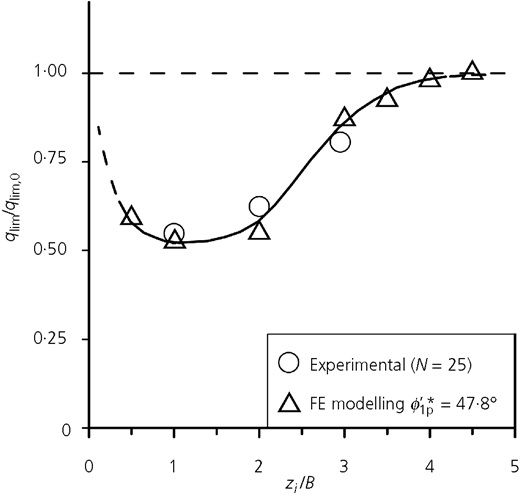
Results of back-calculations. Comparison between numerical and experimental values of q lim/q lim,0 against z i /B for N = 25. Weak layer made of CM3 talc powder
Results of back-calculations. Comparison between numerical and experimental values of q lim/q lim,0 against z i /B for N = 25. Weak layer made of CM3 talc powder
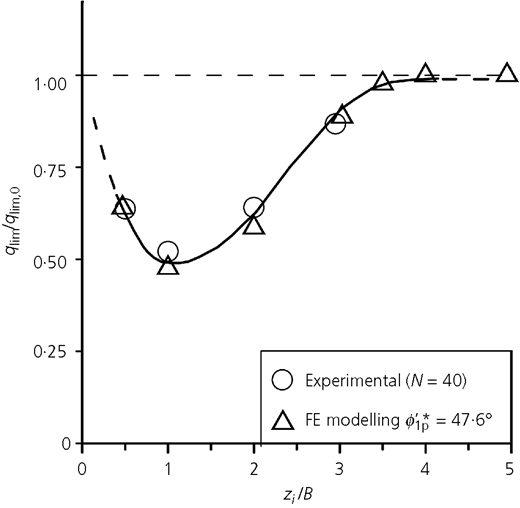
Results of back-calculations. Comparison between numerical and experimental values of q lim/q lim,0 against z i/B for N = 40. Weak layer made of CM3 talc powder
Results of back-calculations. Comparison between numerical and experimental values of q lim/q lim,0 against z i/B for N = 40. Weak layer made of CM3 talc powder
It can be observed that the results of numerical analysis match the experimental data very well. These figures prove that at enhanced gravity, the mean equivalent angle of shearing strength, , is not appreciably affected by the stress-related variability of and by the depth of the weak layer, in contrast with what occurs for 1g tests (Valore et al., 2017). The earlier-mentioned figures also confirm the remarkable effect of the presence of the weak layer on the ultimate bearing capacity, which may undergo reductions as high as 50% when the weak layer is made of CM3 talc powder with a shearing resistance angle, , equal to 27°. For this latter value of , the experimental results along with the experimental ones clearly suggest that the critical adimensionalised depth z i/B closely approaches 4.
Conclusions
The influence of a horizontal thin weak soil layer interposed in a dense sand bed on the behaviour of a shallow strip footing loaded to failure was investigated by means of centrifuge tests on small-scale physical models. From the test results, the following conclusions can be drawn.
The weak layer strongly influences both the failure mechanism and the ultimate bearing capacity, qlim, if its depth, zi, does not exceed a critical value of about 4B for the tested materials (sand and talc powder making up the weak layer). In general, this critical value varies as a function of the ratio / between the angles of shearing resistance of the sand and the material making up the weak layer. The failure surface cuts through the weak layer when the latter is located at small depths, zi, beneath the footing (zi/B ≤ 0·5); at larger depths (0·5 ≤ zi/B ≤ 3), the weak layer controls the maximum depth of the mechanism, forcing it to run partly horizontally along the weak layer before going up through the upper sand layer.
The ultimate bearing capacity, qlim, is always lower than qlim,0 pertinent to the homogeneous sand bed. The experiments show a reduction in qlim of up to 50% for weak layers made of talc powder with an angle of shearing resistance of 27°; larger reductions are expected for smaller values of .
The presence of a weak layer reduces the stiffness of the load–settlement curve before qlim is reached. Numerical simulations of the reduced-scale centrifuge physical model tests by FE analysis are able to capture the failure mechanisms and the ultimate bearing capacity correctly, even if the very simple constitutive Mohr–Coulomb model is used. Moreover, they point out that the equivalent mean constant value of the sand angle of shearing resistance in tests at enhanced gravity is little influenced by the location and the properties of the weak layer, in contrast with what happens for single-gravity tests.
The test results confirm those relative to single-gravity tests, reported in a companion paper (Valore et al., 2017), also carried out on a coarser sand and using materials for the weak layer with a wide range of angles of shearing resistance.
Scale effects, well known for homogeneous sands, also operate in sand beds containing a thin horizontal weak layer.
Bearing capacity factors, Nγ , derived from results of tests on footing on homogeneous sand bed decrease with the prototype width and are in good agreement with other published experimental results and with theoretical solutions by Brinch Hansen (1970), Terzaghi (1943) and Vesić (1973). An equivalent bearing capacity factor, , has been derived for a sand bed containing a thin weak layer; it is lower than Nγ and depends on the location and shearing resistance of the weak layer.
The results of tests carried out at different accelerations and of the back-analysis encourage confident numerical predictions of the behaviour of actual soil–footing systems of the kind dealt with in the paper.




Acknowledgements
This research was partly supported by the Ministry of Education, Universities and Research (Progetti di Rilevante Interesse Nazionale (Prin): Gallerie in ‘sezione mista’, Project 9908328717_009). This support is gratefully acknowledged. The authors wish to thank the laboratory technicians Dr Eng. A. Casella and Dr Geol. G. Sapienza of the geotechnical laboratory of the University of Palermo and the technicians of the ISMGeo for their assistance during the tests.

