


Glacial tills are a product of the glacial processes of erosion, transportation and deposition and could have been subjected to several glacial cycles and periglacial processes to the extent that they are complex, hazardous soils that are spatially variable in composition, structure, fabric and properties, making them very difficult to sample, test and classify. An overview of the formation of glacial tills and their properties shows that they are composite soils which should be classified according to their lithology, their mode of deposition to link the glacial processes with the facies characteristics and their engineering behaviour. This enables representative design properties to be assigned using frameworks developed for composite soils.
Notation
- A
activity
- Cc
coefficient of curvature
- Cc-g
global compression index
- Cu
coefficient of uniformity
- cu
undrained shear strength
- d10
particle size of 10% of the particle size distribution
- e, f
constants
- eg
global void ratio
- eg100
global void ratio at an effective stress of 100 kPa
- ei
intergranular void ratio
- eL
void ratio at the liquid limit
- em
matrix void ratio
- IL
liquid limit
- kh
coefficient of hydraulic conductivity
- mv
coefficient of volume compressibility
- pa
atmospheric pressure
- ϒd
dry density
effective vertical stress
- φ′
angle of friction
Introduction
Glacial tills, which are extensive throughout the temperate zone, are complex, hazardous soils that are spatially variable in composition, structure, fabric and properties, making them very difficult to sample, test and classify (Clarke, 2017; Griffiths and Martins, 2017). They are a product of the glacial processes of erosion, transportation and deposition and could have been subjected to several glacial cycles and periglacial processes to the extent that interpretation of investigations can be challenging.
There are four categories used in the classification of soils for engineering purposes: very coarse-grained, coarse-grained, fine-grained and organic soils. Glacial soils can be composed of one or more of these categories such that their engineering behaviour is not consistent with the engineering classification (Clarke, 2017). All glacial tills are subject to gravitational forces during deposition, and many are also subject to shear. Thus, it is possible to have tills with the same composition but distinctly different properties. Hence, tills should be categorised according to a lithological classification (e.g. BS EN ISO 14688-1:2002+A1:2013 (BSI, 2002)) as well as a genetic classification (e.g. Giles et al., 2017), to link the glacial processes with the facies characteristics, and according to a classification scheme based on their engineering behaviour (e.g. Clarke, 2017). This paper explains the reasons for this by providing an overview of the formation of subglacial tills and the impact that it has on their characteristics, and techniques that could be used to generate design properties. The spatial variability of tills means that it is difficult to assign representative characteristic design values. Using knowledge of the formation of tills and composite soil behaviour, a ground investigation strategy is introduced to improve the quality of the results.
Formation
Over the years, glacial geologists have developed classification schemes for till based on the modes of transport (i.e. subglacial, glacial or supraglacial) and deposition (e.g. deformation, lodgement, melt-out and comminution) (e.g. Benn and Evans, 2010). The current view is that glacial tills are a result of (a) deformation (glaciotectonite), (b) a combination of deposition and deformation (subglacial traction till) or (c) deposition alone (melt-out till). Glaciotectonite and subtraction tills are generally much denser than melt-out tills since those deposits are subject to shear as well as gravitational forces during deposition. Glacial tills may be the result of several periods of glacial and periglacial activities creating complex structures that are difficult to construct from borehole information.
Glaciers sliding over the substrate, formed of solid and superficial geology, initially deform the substrate to create glaciotectonite which retains some of the original structure of the parent substrate (e.g. Banham, 1977; Benn and Evans, 2010; Pedersen, 1988). Tectonic features are developed including brittle shear planes, faults and ductile folds. Extensive shear strain can produce laminations, with distinctly different soils between the laminations. Pods of stiffer material are generated because of the variation in stiffness in the substrate and because of the local temperature and pore pressure regimes. Glacial movement, with time, will start to erode the substrate by either abrasion (Hallet, 1979) or quarrying (Iverson, 2012), the amount depending on the glacier velocity, the temperature and pressure at the base of the glacier, the interface friction between the ice and the bed, a function of the bed roughness and the strength of the underlying sediment. Further deformation leads to increasing disaggregation of the sediment and abrasion, thus breaking down the sediment until it is eventually completely homogenised (Elson, 1961). Progressive crushing and abrasion result in a fractal particle size distribution with a dimension of 2·65 (Iverson et al., 1996). The eroded material forms glacial debris, which can be transported considerable distances by ice before it is deposited as subglacial traction till or melt-out till depending on whether the ice is advancing or retreating.
A vertical profile (Figure 1) through the substrate may show a sequence ranging from undisturbed sediment at depth to completely homogenised till at the top with no distinct boundaries between the layers. If the substrate is a glacial soil, then the deformed substrate can contain remnants of previous glaciations, the treacherous pockets of water-bearing sands and gravels and softer clays highlighted by Ansted (1888), for example.
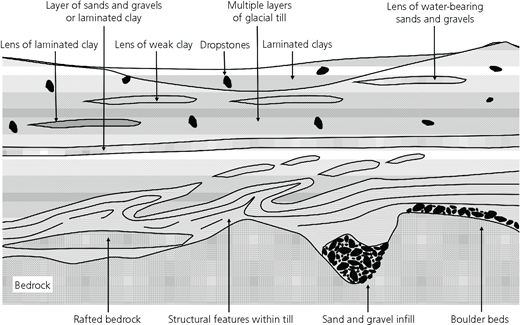
Features of subglacial tills highlighting the challenge of creating a three-dimensional image of glacial tills because of structural features associated with deformation and the difficulty of identifying bedrock due to rafted rock and boulder beds, lens and layers of weaker clays/water-bearing sands and gravels and dropstones (after Clarke (2017))
Features of subglacial tills highlighting the challenge of creating a three-dimensional image of glacial tills because of structural features associated with deformation and the difficulty of identifying bedrock due to rafted rock and boulder beds, lens and layers of weaker clays/water-bearing sands and gravels and dropstones (after Clarke (2017))
Subglacial traction till results from the lodgement of glacial debris beneath a glacier by pressure melting or other mechanical processes (e.g. Dreimanis, 1989) against an obstruction or when the frictional resistance between a clast and the underlying substrate exceeds the frictional drag of the glacier. Subglacial traction tills are usually very dense with a low water content because of the combination of the pressures of the ice and shear. They are sometimes described as overconsolidated because they are dense rather than being as result of the geotechnical process of consolidation. They are often fissile with potential slip planes, suggesting shear during deposition. These tills have bimodal or multimodal particle size distributions with distinct rock flour and gravel ranges. Cobbles and boulders are aligned with the direction of the ice flow.
Melt-out till is formed of englacial and supraglacial debris deposited from stagnant or slow-moving ice without further transport or deformation (Benn and Evans, 2010). The clast content reflects high-level transport in which particles retain their angularity. Melt-out till is generally poorly consolidated because it has not been subjected to high pressures or shear. Therefore, it has a relatively low density compared to other tills. More importantly, this till has been subjected to gravitational consolidation, whereas the other tills are subject to shear as well as gravitational loads.
The properties of glacial tills (Figure 2) are spatially variable, both vertically and horizontally, making it difficult to obtain representative samples and select appropriate design parameters. This can be attributed, in part, to the form of deformation, subglacial drainage and pore pressure (Table 1) as they control the rheology and strength of glacier beds and the glacial motion. It is now accepted that till undergoes deformation (at low effective pressures) and lodgement and ploughing (at high effective pressures) (e.g. Brown et al., 1987; Evans et al., 2006; Hart, 1995; Hart and Boulton, 1991; van de Meer et al., 2003). The effective pressure can vary laterally, creating areas of low and high effective stress that change with time (e.g. Alley, 1993; MacAyeal et al., 1995; Piotrowski et al., 2004; Stokes et al., 2007). Distinct till fabric is created (e.g. Andrews, 1971; Benn, 1995; Carr and Rose, 2003; Dowdeswell and Sharp, 1986; Hart, 1994). The local strength of tills depends on the constraints to the deforming layer; a constrained layer has a high strength (Benn, 1995; Hart, 2006), and a thicker, less-constrained layer will have a low strength (Dowdeswell and Sharp, 1986; Hart et al., 2004; Hicock et al., 1996).
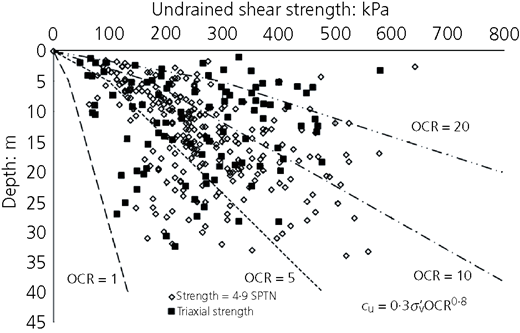
An example of a comparison of the variation in undrained shear strength (estimated from standard penetration tests (SPTN) and overconsolidation ratio (OCR)) with depth highlighting the difficulty of selecting a design profile because of the effects of composition and fabric on matrix-dominated till. This example is from north-eastern England (after Clarke (2017)); examples from other parts of the UK can be found in the paper by Culshaw et al. (2017)
An example of a comparison of the variation in undrained shear strength (estimated from standard penetration tests (SPTN) and overconsolidation ratio (OCR)) with depth highlighting the difficulty of selecting a design profile because of the effects of composition and fabric on matrix-dominated till. This example is from north-eastern England (after Clarke (2017)); examples from other parts of the UK can be found in the paper by Culshaw et al. (2017)
Possible pore pressure generation and groundwater flow within the substrate
| Groundwater movement | Bulk movement of pore water and soil particles within the deforming substrate (Clarke, 1997) |
| Movement of pore fluid (Boulton and Jones, 1979; Boulton et al., 1994; Murray and Dowdeswell, 1992) | |
| Pipe flow (Boulton et al., 1994; Smart, 1986) | |
| Dendritic channel networks at the ice–substrate interface either in the ice, in the substrate or within tunnel valleys (Boulton and Hindmarsh, 1987; Nye, 1973; Rothlisberger, 1972; Shreve, 1972) | |
| Linked cavity systems (Hallet and Anderson, 1980; Kamb, 1987; Sharp et al., 1989; Walder and Hallet, 1979) | |
| Braided canal networks formed of wide, shallow channels between the ice and deformable substrate (Clark and Walder, 1994; Walder and Fowler, 1994) | |
| Thin films of water at the ice–substrate interface (Hallet, 1979; Weertman, 1972) | |
| Pore pressure generation | Low pore-water pressure – the glacier is coupled to the till (Boulton and Hindmarsh, 1987), mobilising the strength of the very dense till, which resists deformation. The glacier does move with some brittle shear taking place in the till (Benn and Evans, 1996; Boulton and Hindmarsh, 1987) |
| Medium pore-water pressure – reduction in substrate strength to an extent that ductile deformation takes place (Alley, 1989) | |
| High pore-water pressure – decoupling of the glacier from the substrate, causing the glacier to slide over the substrate (Boulton et al., 2001; Fischer and Clarke, 1997; Iverson et al., 1996) |
The basal motion of a glacier (Figure 3) can be due to sliding between ice and substrate, ploughing of clasts through the upper layer of the substrate and pervasive deformation of the bed or shearing across discrete planes in the bed, which depend on the degree of coupling at the ice–bed interface. Pervasive bed deformation is more likely to occur if high pore-water pressures cause the substrate yield strength to drop below a critical shear stress that can be supported by the ice–bed interface (Alley, 1989; Boulton and Hindmarsh, 1987). Complete decoupling of ice and sediment can occur if a layer of highly pressurised water develops at the interface increasing the tendency for the glacier to slide over the bed (Alley, 1989; Iken and Bindschadler, 1986). Incomplete coupling creates a transitional state between sliding and pervasive bed deformation known as ‘ploughing’, in which clasts that protrude across the ice–bed interface are dragged through the upper layer of the substrate. This ploughing process, assisted by local elevated pore pressures developed in front of clasts, leads to a local reduction in strength and therefore local deformation (Alley, 1989; Brown et al., 1987).
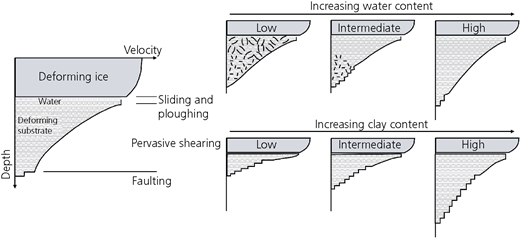
The effect of water content and clay content on the deformation of the substrate (after Alley (1989), Menzies (1989) and van de Meer et al. (2003)). An increase in water or clay content increases the depth of deformation and a possible switch from a brittle to a ductile behaviour
The effect of water content and clay content on the deformation of the substrate (after Alley (1989), Menzies (1989) and van de Meer et al. (2003)). An increase in water or clay content increases the depth of deformation and a possible switch from a brittle to a ductile behaviour
Deformation of subglacial traction tills causes preferred orientations of particles and micro- and macrofabric features, including weak fabrics parallel to the shearing direction (Clark, 1997; Dowdeswell and Sharp, 1986; Hart, 1994; Hicock, 1992); transverse fabrics (Carr and Rose, 2003; Glen et al., 1957); and variable fabric strength dependent on till porosity, water content or layer thickness (Dowdeswell et al., 1985; Evans et al., 2006; Hart, 1994); and with sufficient strain, it results in strong flow-parallel fabrics (Benn, 1995; Benn and Evans, 1996, 2010).
Consequences
Glacial processes result in complex, spatially variable, dense, composite soils.
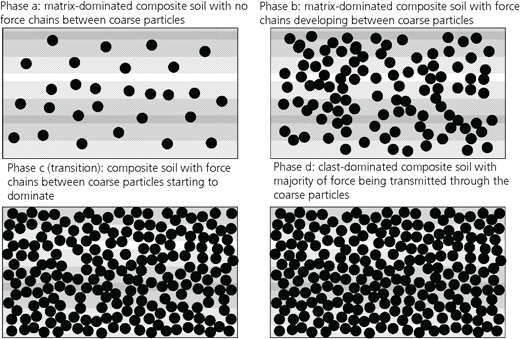
Composite soils – most glacial tills are either evenly graded or multigraded, containing a range of particle sizes from different categories of soils – that is, they are composite soils. Composite soils (Figure 4) are those soils that include more than one category of soil (BSI, 2002, 2009; Head, 1984; Omine et al., 1989). A till may be a fine-grained soil, a soil which is fully homogenised; a matrix-dominated soil, a soil which behaves as a fine-grained soil but contains coarse-grained particles; a clast-dominated soil, a soil which behaves as a coarse-grained soil but contains fine-grained particles; or a coarse-grained soil.
Spatially variable – the structure, fabric and properties are spatially variable because of the degree and type of deformation and the pore pressure and temperature regimes during deposition. The local conditions at the base of a glacier are complex such that the stress history of a glacial till layer can vary vertically and horizontally (Piotrowski et al., 2004). Two extremes can exist – an undrained condition in which the pore pressure increases with the thickness of ice, which means that there is no change in the effective vertical stress, and a drained condition (Figure 5) in which there is no change in pore pressure. The former leads to a normally consolidated till because unloading as the ice melts means that the pore pressure will reduce; thus, the effective vertical stress remains constant. The latter leads to a ‘heavily overconsolidated till’. It is likely that the actual conditions exist somewhere between these two extremes. Fully undrained conditions would result in very little change in deviator stress compared to the weight of ice. This process of gravitational consolidation is further complicated by shearing, resulting in particle breakage. The complex deposition process accounts for the scatter in strength index, density and water content with depth often associated with glacial tills.
Density – subglacial traction tills are often very dense, although these can contain pods, lenses and layers of less dense soils. The density is a result of the particle size distribution that can span across more than one category of soil and the combination of consolidation and shear during formation. These tills may be dense but not necessarily overconsolidated. The density depends on the pore pressure regime that existed during deposition. Thus, subglacial traction tills are likely to be dense no matter the degree of ‘overconsolidation’.
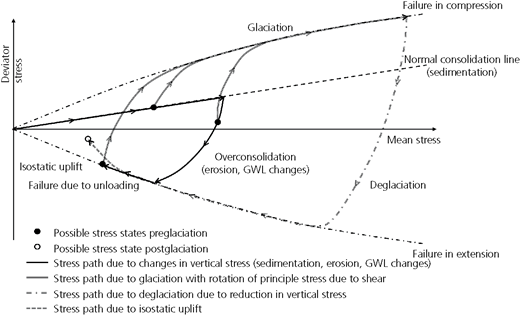
The effect of glaciation, deglaciation and isostatic uplift on the stress state within subglacial tills assuming fully drained conditions compared to the stress changes associated with sedimentation and erosion (after Clarke (2017)). GWL, groundwater level
The effect of glaciation, deglaciation and isostatic uplift on the stress state within subglacial tills assuming fully drained conditions compared to the stress changes associated with sedimentation and erosion (after Clarke (2017)). GWL, groundwater level
Classification characteristics of subglacial tills
Description
The composition, fabric and structure of tills, due to the erosional, depositional and postdepositional processes (Derbyshire et al., 1985), affect the mechanical properties of the soil (Table 2). Glacial tills can include rock flour, clay, silt, sand, gravel, cobbles and boulders depending on the source rock, the mode of deformation, the mode and distance of transportation and the mode of deposition. Discontinuities form in glacial tills (Boulton, 1996; Kirkaldie and Talbot, 1992) and can be horizontal (reduction in overburden and shearing) or vertical (isostatic unloading, freeze/thaw and shrinkage). Glacial tills also exhibit sedimentary structures, which are most easily observed in excavations and exposures. These complex structures are difficult to identify from boreholes, which means any projected cross-sections must be treated with caution.
Geotechnical characteristics of glacial tills (after McGown and Derbyshire (1977))
| Till | Class | Fabric | OCR | Relative comparison of geotechnical propertiesa | |||
|---|---|---|---|---|---|---|---|
| Density | Compressibility | Permeability | Anisotropy | ||||
| Deformation | G | Deformed basal sediments or bedrock | 1 | 5 | 3 | 5–8 | |
| W | |||||||
| Mg | |||||||
| Mc | |||||||
| Lodgement | G | Interlaying of glaciofluvial, joints, fissures, contortions; preferred clast orientation | 2–5 | 4–7 | 1 | 5–6 | 7 |
| W | 5–8 | 2 | 2–3 | ||||
| Mg | 6–8 | 2 | 4–5 | ||||
| Mc | 6–8 | 3 | 2 | ||||
| Melt-out | G | Occasional interlaying with glaciofluvial; clast oriented with englacial state | 1–2 | 2–4 | 2–4 | 7–9 | 3–5 |
| W | 2–6 | 3–5 | 4–5 | ||||
| Mg | 2–6 | 3–6 | 5–8 | ||||
| Mc | 2–7 | 4–7 | 3–4 | ||||
1 is low; 9 is high
G, granular till; Mc, matrix till (cohesive); Mg, matrix till (granular); W, well-graded till
Particle size distribution
Glacial tills have the most diverse range of particle size distribution of any soil, yet within any category of glacial till, it is possible to make some observations which help identify the type of till and how it will behave, as shown in Figure 6, a ternary diagram highlighting the relationship between particle size distribution and description. The principles of soil classification for engineering purposes are based on particle size distribution, plasticity, organic content and genesis. There are four categories of soil types: very coarse-grained, coarse-grained, fine-grained and organic soils. Glacial tills are often combinations of the first three, making them composite soils. McGown and Derbyshire (1977) suggested a description of tills based on the percentage of fines (Table 3). Gens and Hight (1979), Stephenson et al. (1988) and Al-Moadhen et al. (2017) showed that the behaviour of a composite soil is determined by the percentage of coarse-grained soils. A soil will behave as a fine-grained soil (matrix-dominated till) if the coarse-grained content is less than 85% and as a coarse-grained soil (clast-dominated till) if the coarse content exceeds 85%. The transition zone between the matrix-dominated and clast-dominated till will depend on the confining stress and clay type (Al-Moadhen et al., 2017). Thus, the description of a till based on engineering classification schemes may not be consistent with the engineering behaviour since a soil is classified as fine-grained if there is more than 40% by weight of silt and/or clay (BS EN ISO 14688-1:2004+A1:2013 (BSI, 2004a)), whereas it can behave as a fine-grained soil if there is more than 15% by weight.
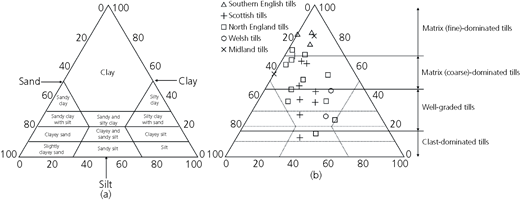
Ternary diagrams showing (a) the range of soils composition and their relation to engineering descriptions and (b) the composition of a number of UK tills (after Trenter (1999))
Ternary diagrams showing (a) the range of soils composition and their relation to engineering descriptions and (b) the composition of a number of UK tills (after Trenter (1999))
Relation between percentage of fines and type of till (modified from McGown and Derbyshire (1977))
| Dominant soil fraction | Nature of dominant fraction | % of fines | Textural description | Composite soil behaviour |
|---|---|---|---|---|
| Clasts | Coarse | 0–15 | Granular | Clast dominated |
| Non-dominant fraction | 15–45 | Well graded | Either matrix or clast depending on confining stress | |
| Matrix | Coarse | 45–70 | Granular matrix | Matrix dominated |
| Fine | 70–100 | Cohesive matrix |
Some matrix-dominated tills may exhibit a strength index (undrained shear strength) in excess of 300 kPa, which means that they are classified as weak rock according to BS EN ISO 14688-2:2004+A1:2013, although these are likely to be described as a soil.
Consistency limits
The limits are based on the fraction of fine-grained soil and the water content on the whole mass. For composite soils, the consistency limits will be based on the matrix, so any correlations with engineering properties will be based on the matrix properties using the mass water content – that is, published correlations for fine-grained soils may not be relevant.
The A-line on the Casagrande chart, based on experimental evidence, separates clays from silts. Erosion products include clay minerals and rock flour depending on the source material and the degree of weathering such that the consistency limits of many glacial soils lie astride the T-line (Figure 7) defined as
where PI is the plasticity index and I L is the liquid limit. The T-line lies above the A-line, suggesting that the matrix is a clay, whereas the evidence is that they can be combinations of clays, silts or rock flour.
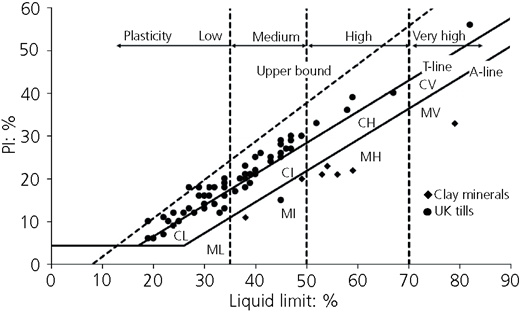
Consistency limits for UK matrix-dominated tills and clay minerals (after Trenter (1999) and Clarke et al. (2008)) showing the T-line (Boulton and Paul, 1976). C, clay; H, high plasticity; I, intermediate plasticity; L, low plasticity; M, silt; V, very high plasticity
Consistency limits for UK matrix-dominated tills and clay minerals (after Trenter (1999) and Clarke et al. (2008)) showing the T-line (Boulton and Paul, 1976). C, clay; H, high plasticity; I, intermediate plasticity; L, low plasticity; M, silt; V, very high plasticity
Glacial tills weather by oxidation, hydration, leaching and mechanical disintegration (Eyles and Sladen, 1981; Sladen and Wrigley, 1983), which leads to increased silt and clay content by disintegration and formation of clay minerals due to chemical weathering (Sladen and Wrigley, 1983). A weathered till tends to have a higher water content, lower density and a greater plasticity than the underlying, unweathered till (e.g. Bell and Forster, 1991; Clarke et al., 2008; McKinlay et al., 1974; Robertson et al., 1994).
Density
Soils can be described as even-graded soils (Table 4), in which the particles are of a similar size (e.g. even-graded sand); multigraded soils (e.g. glacial tills); and gap-graded soils (e.g. bimodal glacial tills). Multigraded and gap-graded soils are likely to be composite soils. The theoretical maximum density of a composite soil varies between 1·92 and 2·30 Mg/m3 for a water content of 30–10% assuming a particle density of 2·65 Mg/m3 (Clarke, 2017). The in situ densities of glacial tills (other than melt-out tills) created by the deposition processes of compression, shear and abrasion are similar to the theoretical densities as are the water contents.
The shapes of grading curves of glacial tills (after BS EN ISO 14688-2:2004+A1:2013 (BSI, 2002))
| Description | C u | C c |
|---|---|---|
| Multigraded | >15 | 1 < C c < 3 |
| Medium graded | 6–15 | <1 |
| Even graded | <6 | <1 |
| Gap graded | Usually high | Any (usually <0·5) |
Geotechnical characteristics
The density, composition and fabric of subglacial traction tills make it difficult to retrieve quality samples. The spatial variability of tills makes it difficult to select representative samples. The size of samples in relation to the fabric makes it difficult to determine the mass strength, stiffness and permeability of these tills. Therefore, it is prudent to use frameworks developed for composite soils to assess the quality of the results and select design parameters.
Hydraulic conductivity
The primary or intrinsic hydraulic conductivity, k h, of a soil can be determined in the laboratory by using reconstituted samples consolidated to the same density as the in situ density. Al-Moadhen et al. (2018) undertook tests on composite soils and compared the results to published data to produce Figure 8, which shows that matrix-dominated tills with a fine-grained content in excess of 35% have a conductivity of less than 10−9 m/s. The conductivity of clast-dominated soils is typically greater than 10−7 m/s. There is a transition zone between these two, which depends on the soil density, type of fine-grained particle and confining pressure.
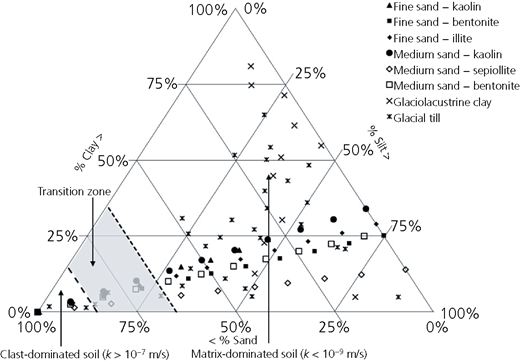
A comparison between the experimental observations of coefficient of hydraulic conductivity of composite soils (after Al-Moadhen et al. (2018)) and those reported by Stephenson et al. (1988) for glacial soils
A comparison between the experimental observations of coefficient of hydraulic conductivity of composite soils (after Al-Moadhen et al. (2018)) and those reported by Stephenson et al. (1988) for glacial soils
Al-Moadhen et al. (2018) showed that the k h of composite soils, both plastic and non-plastic, is stress dependent and decreases with fine-grained content. The data, replotted in Figure 9 using the matrix void ratio (e m = volume of voids/volume of fine-grained particles), show that for a fine-grained content in excess of 30%, the variation in hydraulic conductivity with effective stress falls within a narrow band – that is, it is the matrix that dominates the permeability of the soil. This is consistent with the concept that flow is governed by the fine-grained matrix, with the coarse-grained particles having little effect provided that the coarse-grained content is less than 30%. The k h of fine-grained soils depends on the activity, A, and matrix void ratio, e m
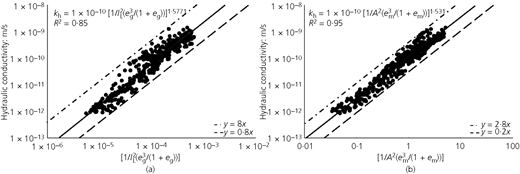
The variation in hydraulic conductivity of matrix-dominated soils with (a) the global void ratio and liquid limit and (b) the matrix void ratio and activity (after Al-Moadhen et al. (2017))
The variation in hydraulic conductivity of matrix-dominated soils with (a) the global void ratio and liquid limit and (b) the matrix void ratio and activity (after Al-Moadhen et al. (2017))
Thevanayagam (1998) and others suggested that the shear behaviour of clast-dominated composite soils is a function of the intergranular void ratio (e i = (volume of voids + volume of fine-grained particles)/volume of coarse-grained particles). This also applies to hydraulic conductivity (Figure 10) even though the intergranular void ratio includes the fine-grained volume. The hydraulic conductivity of coarse-grained soils is a function of d 10 (Hazen, 1892) and the intergranular void ratio, e i
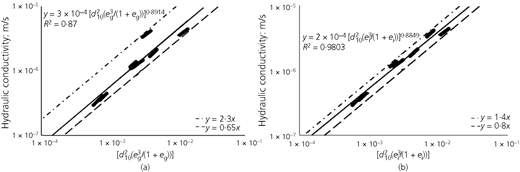
The variation in hydraulic conductivity of clast-dominated soils with (a) the global void ratio and (b) the intergranular void ratio (after Al-Moadhen et al. (2017))
The variation in hydraulic conductivity of clast-dominated soils with (a) the global void ratio and (b) the intergranular void ratio (after Al-Moadhen et al. (2017))
Inspection of the data from the paper by Stephenson et al. (1988) also shows that for soils with less than 10% clay content (Figure 11) and less than 75% coarse-grained content – that is, the fine-grained content is predominantly silt – the hydraulic conductivity is the same as that for the transition zone, which is typically between 10−7 and 10−9 m/s.
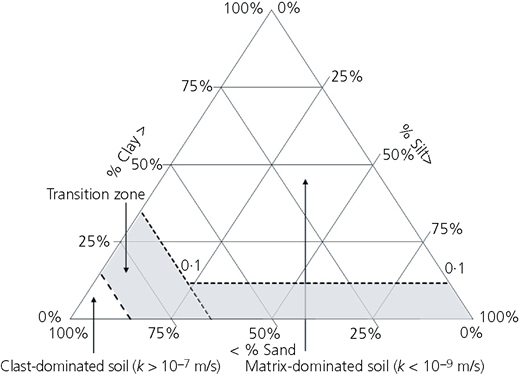
A relationship between the composition of composite soils and the coefficient of hydraulic conductivity showing that there are four distinct zones: matrix-dominated soils, clast-dominated soils, the transition between matrix- and clast-dominated soils and soils that are predominantly formed of silt (after Al-Moadhen et al. (2018))
A relationship between the composition of composite soils and the coefficient of hydraulic conductivity showing that there are four distinct zones: matrix-dominated soils, clast-dominated soils, the transition between matrix- and clast-dominated soils and soils that are predominantly formed of silt (after Al-Moadhen et al. (2018))
The mass (in situ) permeability of glacial tills is a function of the intrinsic conductivity and the secondary conductivity, which is a function of the soil fabric, which in glacial soils can have a significant effect (e.g. Keller et al., 1986; Little, 1984; McKay et al., 1993; Sims et al., 1996). Thus, the mass permeability is likely to exceed the intrinsic permeability. Further, matrix-dominated tills contain discontinuities that vary in width with depth. Sims et al. (1996) suggested that fissures within matrix-dominated tills have a significant effect on the permeability but the effect reduces with depth because the density of fissuring decreases with depth and the in situ stress increases, closing the fissures such that if the effective stress exceeded 120 kPa (that is about 12 m), the in situ conductivities of the intact and fissured clay are similar. The permeability of clast-dominated and melt-out tills is highly variable because of the variability in composition, and glacial tills can contain lenses of more permeable materials, which have significantly different conductivity to the surrounding soil.
Compressibility and deformation
Stiffness
Stiffness is the most difficult parameter to assess (BS EN 1997-1:2004+A1:2013 (BSI, 2004b)). It is possible to assess the module decay curve from triaxial tests on class 1 samples by using local strain measurements (Atkinson and Little 1988; Chegini and Trenter, 1996; Finno and Cho, 2010; Hird et al., 1991; Long and Menkiti, 2007). This could be attributed to the fabric as well as the effects of sampling very dense soils. It has generally been observed that results from tests on quality samples provide data that are consistent with in situ measurements but the predicted decay curves may be less than those back-figured from field observations.
Published correlations of the variation in the global compression index, Cc-g, with liquid limit (Figure 12) show that for a liquid limit less than 40%, there is reasonable agreement with the empirical correlations proposed by Skempton and Jones (1944), Terzaghi et al. (1996) and Sridharan and Nagaraj (2000). However, Cc-g is also dependent on the stress state such that
where eg100 is the global void ratio at an effective stress of 100 kPa and eL is the void ratio at the liquid limit. Al-Moadhen and Clarke (personal communication) found a linear relationship between the matrix void ratio, em, and the effective vertical stress for matrix-dominated soils. An implication of this conclusion is that it is possible to test reconstituted composite soils to determine the mechanical characteristics to overcome the difficulty of recovering sandy, gravelly clay, for example, since the coarse-grained content has a significant impact on the behaviour of a small test sample although the behaviour in situ may be largely unaffected by the coarse-grained content. This is the procedure recommended by Atkinson et al. (1985), Lewin and Powell (1985) and Clarke et al. (1997) for testing clay matrix-dominated tills as the effects of fabric and large coarse particles are removed, leading to more consistent results. While more consistent results may be obtained, they are likely to be a lower bound to the in situ mass values.
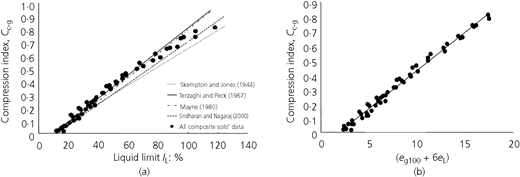
The global compression index of composite soils: (a) compared with published empirical correlations; (b) as a function of liquid limit and void ratio at 100 kPa pressure (after Al-Moadhen and Clarke (personal communication))
The global compression index of composite soils: (a) compared with published empirical correlations; (b) as a function of liquid limit and void ratio at 100 kPa pressure (after Al-Moadhen and Clarke (personal communication))
Further, Al-Moadhen and Clarke (personal communication) showed that the coefficient of volume compressibility, mv, is related to the dry density. A reduction in mv is associated with an increase in fine-grained content and an increase in the dry density, ϒd, for matrix-dominated soils. Al-Moadhen and Clarke (personal communication) showed that
where [e = 16·45(IL)−1·19; f = 1·422(IL)−1·534] for composite soils and [e = 19·78(IL)−0·816; f = 1·696(IL)−1·176] for matrix-dominated soils.
Strength
Undrained shear strength
The density of matrix-dominated tills is such that the soil skeleton is so stiff that some of the load is taken by the soil particles, which means that during undrained loading of a saturated sample, the pore pressure will be less than the confining pressure in a triaxial test. Therefore, if unconsolidated undrained tests are carried out on samples of saturated till with the same density and water content at three different confining pressures, a low angle of friction and high cohesion are obtained (Figure 13(b)). This is an unsafe result. It is better to interpret unconsolidated undrained tests as fully undrained tests, quoting the average deviator stress at failure.
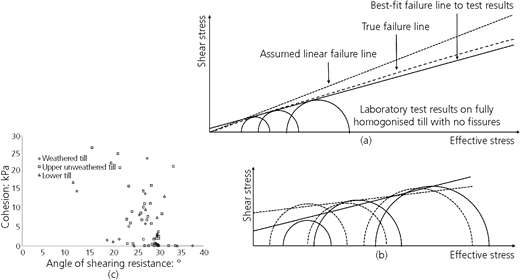
The effects of (a) the assumed failure model and (b) the fabric and composition of glacial tills have on the interpreted effective strength parameters from consolidated tests on those tills showing how c′ can be overestimated and φ′ can be underestimated, producing (c) scatter in standard test results (after Clarke (2017))
The effects of (a) the assumed failure model and (b) the fabric and composition of glacial tills have on the interpreted effective strength parameters from consolidated tests on those tills showing how c′ can be overestimated and φ′ can be underestimated, producing (c) scatter in standard test results (after Clarke (2017))
This is further complicated if a till is fissured and/or contains gravel since this can influence the failure mechanism. McGown et al. (1977) suggested that the ratio of fissured strength to intact strength varies with the volume of the specimen (Figure 14).
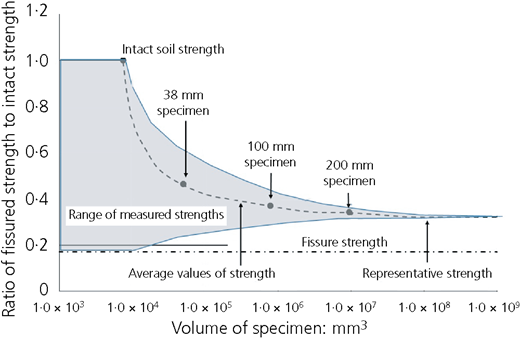
Effect of specimen size on strength of fissured tills highlighting the need to test larger specimens (after McGown et al. (1977))
Effect of specimen size on strength of fissured tills highlighting the need to test larger specimens (after McGown et al. (1977))
Most subglacial tills have a low sensitivity (<8) (Anderson, 1974; Bell, 2002; McGown, 1975) because of the remoulding that took place during deposition. Skempton and Bishop (1954), Skempton and Brown (1961), Bishop and Vaughan (1962), Vaughan et al. (1975) and Vaughan et al. (1978) all showed that the remoulded strength was a reasonable estimate of the in situ strength provided that the remoulded sample had the same density as the in situ soil.
The profile of undrained shear strength with depth shown in Figure 2 is typical of most matrix-dominated tills (e.g. Clarke, 2017; Griffiths and Martin, 2017). The scatter is attributed to natural variation in water content (Millmore and McNicol, 1983; Vaughan et al., 1978) and density, a consequence of the deformation process, the impact of fabric and composition on the failure and the consequences of sampling and testing composite soils. In order to reduce the scatter, do the following.
Test 100 mm dia. samples to determine the undrained shear strength for each sample.
Assess the fabric of each sample and determine whether this influenced the failure. If the fabrics are significant, disregard the results. Note that this applies to the sample only; the mass strength should take into account the fabric.
Group the results according to their liquidity index, water content, density and fabric to remove any outliers.
This procedure reduces the scatter in the data, making the selection of a design profile possible.
An alternative method is to test reconstituted soil consolidated to the in situ density. This removes the effects of fabric and composition to produce the intrinsic strength of the matrix. The design strength will be less than the intrinsic strength to take into account the effects of fabric (Figure 13).
Effective strength
Effective stress tests on a fully saturated clay show that these soils have a non-linear failure envelope (Figure 13(a)) which is considered linear over the typical stress ranges found in practice. Tests on fissured soils or soils containing a range of particle sizes may produce high values or even negative values of cohesion because of the influence of discontinuities/coarse particles on the failure mechanism of each specimen (Figure 13). The effect of fabric on sampling and testing and the interpretation of the test, which is a simple curve-fitting routine, suggest that scatter is inevitable (Figure 15).
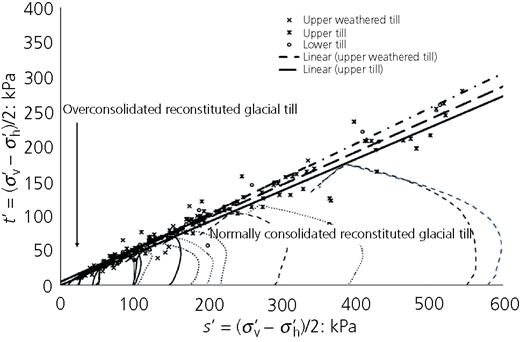
A comparison between the failure envelope from tests on undisturbed and reconstituted samples of glacial till showing that the tests on reconstituted samples produce a lower bound to the field specimens provided that the density is similar
A comparison between the failure envelope from tests on undisturbed and reconstituted samples of glacial till showing that the tests on reconstituted samples produce a lower bound to the field specimens provided that the density is similar
For these reasons, values of cohesion and angle of friction derived from standard tests should be treated with caution. There are a number of ways to obtain more representative values.
Plot the deviator stress and mean stress at failure of all tests on specimens from the same stratum. This may mean more tests are required to be significant. In an ideal situation, the results would lie on a line, possibly curved (Figure 15).
Brooker and Ireland (1965), Ladd et al. (1977) and Terzaghi et al. (1996) suggested a relation between the angle of friction and PI which shows that an increase in clay content reduces the angle. The range of PIs in Figure 7 suggests that the angle of friction of glacial tills would vary between 25 and 35° (Figure 16). Data from various sources suggest that the results of triaxial tests on a glacial till do lie about the predicted relationship, but the scatter in the data suggests caution.
Stark et al. (2005) suggested that the angle of friction is a function of the clay mineralogy (expressed in terms of the liquid limit), clay fraction and the density (expressed in terms of the confining stress), consistent with the concept of a non-linear failure envelope (Figure 17). This is recommended by BS 8004:2015 (BSI, 2015).
Sorensen and Okkels (2013) undertook tests on range of composite soils to show that for stiff matrix-dominated soils (i.e. soils with a clay fraction less than 80%), the best estimate and lower bound angle of friction, φ′, for composite soils with (4% < PI <50%) is given by
6Subglacial tills have a low plasticity; therefore, according to Lupini et al. (1981), these tills should exhibit turbulent shear with little reduction in strength, which is consistent with the view that subtraction tills were remoulded during deposition. Since the tills were remoulded, Atkinson et al. (1985), Lewin and Powell (1985), Chegini and Trenter (1996) and Clarke et al. (1997) suggested that tests can be carried out on reconstituted till at the same density as the natural till. The effects of fabric and large coarse particles are removed, leading to more consistent results, although fabric will have to be considered when selecting a design value.
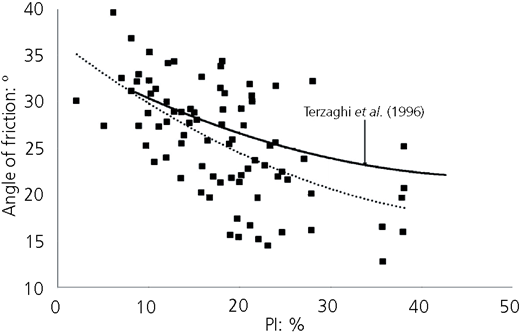
The variation in angle of friction with PI for UK glacial tills compared to that suggested by Terzaghi et al. (1996) showing the scatter in the results due to fabric, composition and interpretation (after Trenter (1999))
The variation in angle of friction with PI for UK glacial tills compared to that suggested by Terzaghi et al. (1996) showing the scatter in the results due to fabric, composition and interpretation (after Trenter (1999))
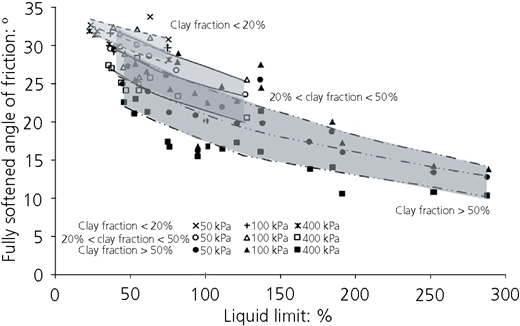
Variation in fully softened angles of friction with clay fraction and liquid limit (after Stark et al. (2005))
Variation in fully softened angles of friction with clay fraction and liquid limit (after Stark et al. (2005))
Given the stiffness of subglacial tills, sensitivity of strength to water content and the difficulty of establishing the stress history, it would appear that tests on reconstituted matrix-dominated tills should provide a reasonable assessment of the characteristic effective strength provided that the specimens are reconstituted at the in situ water content and consolidated to the in situ density. The values obtained are likely to be a lower bound to the in situ intact values but do not include the effect of fabric. The main advantage of this approach is to remove the gravels, which, in situ, will have little effect on mass strength because of their random distribution and quantity but will influence the strength of laboratory specimens.
Conclusions
A review of the formation of glacial tills has highlighted a number of points that should be considered when engineering these soils.
Glacial tills can contain boulders, cobbles, gravel, sands, silts and clays – that is, they are composite soils containing a mix of very coarse-, coarse- and fine-grained particles. Clay size particles can be formed of clay minerals or rock flour depending on the source rock.
Boulders, cobbles and gravel have a significant effect on the quality of a sample and test results but, in situ, may have little effect on the behaviour of the glacial soils. It depends on the quantity and whether they are randomly distributed throughout the soil or not. However, they impact on construction, which is affected by local anomalies.
A description based on an engineering classification (i.e. the dominant particle type) does not necessarily describe the engineering behaviour of a glacial till since the fine-grained content, as little as 15%, has a significant influence.
Glacial tills can be either matrix-dominated soils (at least 35% fine-grained content), which have characteristics similar to those of fine-grained soils, or clast-dominated soils (less than 15% fine-grained content), which have characteristics similar to those of coarse-grained soils. The behaviour of glacial tills with fine-grained content between 15 and 35% will depend on the confining stress.
Glacial tills were transported by ice, but the composition and fabric will depend on whether they were deformed during deposition (subtraction tills) or were deposited gravitationally during a period of deglaciation (melt-out tills). They are spatially variable both vertically and horizontally, because of these depositional processes.
The deposition and postdepositional processes mean that matrix-dominated tills can contain discontinuities and randomly distributed coarse particles, which will impact on the quality of a sample. Tests should be carried out on as large as samples as possible, which means more samples are required than suggested by standards.
Discontinuities will reduce the strength and stiffness and increase the permeability of matrix-dominated tills. These discontinuities can open up during excavation, further increasing the permeability.
It is likely that laboratory tests to determine geotechnical characteristics will be based on reconstituted glaciofluvial soils, clast-dominated tills and, possibly, matrix-dominated tills. It is important to carry out the tests at the in situ density.
The effective strength of tills should be based on tests on a large number of samples rather than specimens from one sample to overcome the difficulty of obtaining representative samples.
Matrix-dominated tills are remoulded during deposition so that these can be reconstituted to the in situ density to give the intact properties of the till, thus removing the effects of fabric and coarse grains. The results may have to be adjusted to take into account fabric.
Correlations developed between geotechnical properties and consistency limits for sedimented clays may not apply to matrix-dominated tills because of the different mode of deposition.
In situ and laboratory test results should not be expected to give the same results. Site-specific correlations need to be developed to relate in situ penetration test results to geotechnical characteristics.
Glacial tills are difficult to sample and test because they are very dense (strong) and fissile and contain gravel. A full description of a glacial till should be based on (a) its mode of deposition (e.g. Giles et al., 2017), (b) an engineering classification scheme (e.g. BS EN ISO 14688-1:2002) and (c) its engineering behaviour (e.g. Clarke, 2017) because the simple model of gravitational consolidation in a marine environment does not describe the formation of glacial till.
When planning an investigation it is necessary to consider the following.
The number of boreholes, samples and in situ tests should exceed those recommended in standards to take account of the impact that fabric and composition can have on the results.
An initial investigation is necessary to determine the spatial variability of the deposits so that the main investigation can be designed to obtain representative samples which should be as large as possible to overcome the influence of fabric and composition.
Methods of sampling, testing and interpretation have a significant effect on the geotechnical characteristics derived from the investigation; hence, more samples than those suggested in standards should be taken.
The results should be validated using appropriate frameworks.

