


Selective erosion of fine particles from granular soils can affect the draining properties of hydraulic structures with time, and it is important to identify unstable soils and characterise their hydraulic and erosional behaviour. To this end, this study focuses on the design and set-up of a new laboratory device for testing the suffusion and piping phenomenon occurring in an internally unstable cohesionless material. The proposed procedure offers the possibility of quantifying the hydraulic gradient at which erosion starts and evaluates the mass of fine particles washed out of the sample under controlled hydraulic conditions. The quantity of eroded particles, the exit water flow rate and the hydraulic gradient distribution along the flow paths are also measured during the process. The procedure was tested on an erosive soil under saturated conditions and under unconfined seepage, allowing the assessment of the hydraulic behaviour of this internally unstable material.
Notation
- Cc
coefficient of curvature
- Cu
coefficient of uniformity
- DI
minimum gap size for gap-graded soil
- i1
upper hydraulic gradient measured based on hydraulic heads measured between heights of 75 and 125 mm from the bottom of the permeameter
- i2
bottom hydraulic gradient measured based on hydraulic heads measured between heights of 25 and 75 mm from the bottom of the permeameter
- iapp
applied hydraulic gradient
- ich
critical hydraulic gradient when suffusion starts off
- k1
upper hydraulic conductivity calculated based on the measured upper hydraulic gradient (i 1)
- k2
bottom hydraulic conductivity calculated based on the measured bottom hydraulic gradient (i 2)
- kmoy
mean value between hydraulic conductivities (k 1) and (k 2)
- ktot
total hydraulic conductivity calculated based on measured applied hydraulic gradient (i app)
- Mp
total mass of eroded fine particles normalised per unit area
- OF
opening size of the geotextile
- RR
retention ratio (=O F/D I)
Introduction
Practical rules derived from theoretical and experimental studies define filter criteria to prevent water-related damages on granular media (Burenkova, 1993; Cedergren, 1985, 1988; Kenney and Lau, 1985, 1986; Lafleur, 2003; Lafleur and Savard 2004; Sherard et al., 1984; Terzaghi, 1943). However, even if a material is well selected, segregation may occur under field conditions due to placement or compaction or even during cyclic loading (Chapuis et al., 1996). In such cases, selective erosion of fine particles from a matrix of coarse soil particles could exhaust the drainage system of earthen hydraulic structures with time (Lafleur and Savard, 2004). Once the fine particles are removed from an internally unstable soil by seepage forces (suffusion), the hydraulic and mechanical behaviours change accordingly and lead to a reduction in the soil shear strength, the onset of settlements and dense cracking (Israr and Indraratna, 2017; Skempton and Brogan, 1994). Moreover, suffusion usually occurs in gap-graded granular soils and broadly graded soils with a steep slope in the coarse fraction and a gentle slope in the fine fraction (Chang and Zhang, 2011; Kenney and Lau, 1985; Lafleur et al., 1989).
The initiation and development of suffusion within a soil have been extensively investigated experimentally. In most laboratory routines, erosion tests are conducted to define geometrical limits between internally stable and unstable materials although many authors have analysed the impact of parameters such as flow direction, stepping time intervals, hydraulic head increasing rate, volume of specimen, initial dry density and confining pressure on internal erosion (Chang and Zhang, 2011; Li, 2008; Marot et al., 2010; Moffat and Fannin, 2006; Reddi et al., 2000; Shwiyhat and Xiao, 2010; Skempton and Brogan, 1994; Wan and Fell, 2004a). The erosion phenomenon has also been characterised by grain size distribution (GSD) analyses at different locations in granular specimens (Kenney and Lau, 1985; Li, 2008; Ronnqvist and Viklander, 2016). Nevertheless, the main drawback of such a procedure is that erosion starts at low flow rates and measurements should be done at different stages (Wan and Fell, 2008). Moreover, Shwiyhat and Xiao (2010) investigated changes in the permeability and volume of soils during the internal erosion process under a constant hydraulic gradient using a triaxial cell. These experimentations pointed out that settlements and permeability reduction might occur in soil specimens after suffusion.
The influence of other factors on the erosion and transport of particles has also been tested, as GSD analysis does not take hydraulic conditions into account (Reddi et al., 2000; Tomlinson and Vaid, 2000). Local hydraulic gradient measurements showed that this parameter varies by several orders of magnitude within the same sample during filtration tests (Fannin and Moffat, 2006; Li, 2008; Sail et al., 2010). The variation of the permeability of a soil–geotextile interface over time under a range of applied hydraulic gradients can be assessed using ASTM D 5101-12, ‘Standard test method for measuring the filtration compatibility of soil–geotextile systems’ (ASTM, 2017a). During testing, measurements of hydraulic heads are taken at several locations of the apparatus and are used to measure the variation in hydraulic gradients and fine particles’ movements across the specimen (Fannin et al., 1996). The opening size (OF) of geotextile must be chosen carefully to ensure the long-term stability of particles in the interface zone of the base soil and filter. The retention ratio (RR = OF/DI), where DI is the minimum gap size for a gap-graded soil, was identified to distinguish the three following filtration processes – namely, (a) piping if RR ≫ 1, (b) bridging (equilibrium flow conditions) if RR ≈ 1 and (c) blinding with suffusive soils if RR ≪ 1. GSDs, head losses and hydraulic conductivities are functions of RR. Soils are stable if less than 2500 g/m2 of fine particles are washed out of the specimen (Lafleur, 1999; Lafleur et al., 1989). All these experimental procedures apply severe hydraulic conditions to the tested material (vibrations and high applied hydraulic heads), differ from real conditions and could lead to overestimated security factors, oversizing design parameters and high undesirable costs.
This study documents an experimental procedure for investigating the initiation and development of internal erosion under multistage seepage flow for an unstable sub-base material subjected to a unidirectional downward flow. Specifically, the research objectives are to (a) quantify experimentally the suffusion critical gradient leading to movement and transport of fine particles within internally unstable soil; (b) improve the understanding of the general hydraulic behaviour and processes when the suffusion phenomenon occurs; and (c) identify the effect of internal erosion on the exit water flow, the local and general heads and the local GSD. The key point of this study is to suggest an economical and easy-to-implement experimental procedure that can replicate the erosional behaviour of an internally unstable material under real in situ conditions.
Experimental set-up
The general layout of the testing apparatus is shown in Figure 1(a). It is composed of a de-aired water supply system, a permeameter and a system for collecting particles. The detailed description of each component is presented in the following sections.
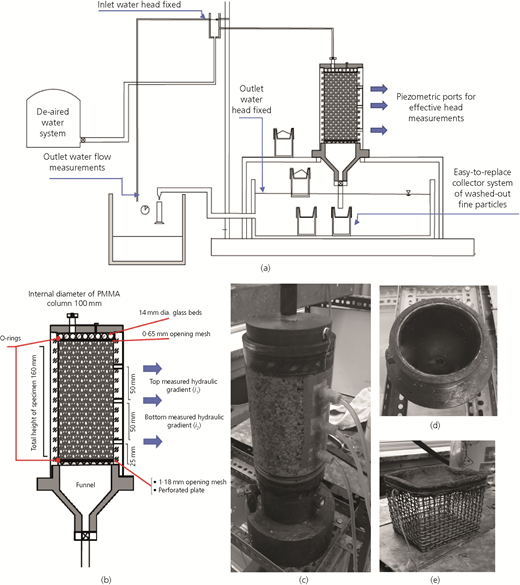
Key components of the experimental set-up: (a) the general layout; (b) details of the permeameter; (c) tested specimen following saturation; (d) the funnel installed at the bottom of the permeameter; (e) the fine-particles collector system. PMMA, poly(methyl methacrylate)
Key components of the experimental set-up: (a) the general layout; (b) details of the permeameter; (c) tested specimen following saturation; (d) the funnel installed at the bottom of the permeameter; (e) the fine-particles collector system. PMMA, poly(methyl methacrylate)
De-aired water supply system
To prevent any desaturation of the samples, the tests are performed with de-aired water. The de-aired water is stored in tanks after being prepared in a system composed of a vacuum pump, a pressure gauge and a pressure regulator connected to a compressed-air circuit. The system allows dissolution of gas bubbles for de-aeration. The tanks are connected to an overflow reservoir which regulates the hydraulic charge applied to the tested specimen. The inlet water head can be either increased gradually, kept constant or decreased gradually. The precision of the hydraulic head is equal to 1 mm.
Permeameter
The permeameter is composed of a poly(methyl methacrylate) (PMMA) cylinder (100 mm dia. and 160 mm high) connected to three piezometric ports at different elevations (25, 75 and 125 mm). During the test, the water goes downwards through the soil sample and a 14 mm glass bed layer lying on a 0·65 mm mesh allows the distribution of the flow over the surface of the sample. A 1·8 mm mesh relying on a perforated plate is placed at the bottom of the soil sample to support the soil skeleton while allowing the finest particles to exit. These specific elements are shown in Figures 1(b) and 1(c). Note that the air- and waterproofness of the cell were tested prior to any erosion test.
Soil collector system
The soil collection system was designed to retrieve continuously the washed-out particles using a filtration system as recommended by Chang and Zhang (2011). This system is composed of a double colander whose finest opening is 0·064 mm (only cohesionless soil was tested here) and whose largest is 5 mm (see Figure 1(e)). This methodology prevents any desaturation or changing of the hydraulic gradient when sampling the eroded particles (rapid drainage). The eroded particles pass through the funnel to settle down finally on the sieve placed directly under the bottom valve of the permeameter (see Figure 1(d)).
Experimental procedure
The proposed procedure takes into account some observations made by different authors: (a) suffusion can occur even if a low hydraulic gradient is applied (Skempton and Brogan, 1994), (b) the erosion process is influenced by the rate of the hydraulic gradient increase (Tomlinson and Vaid, 2000) and (c) the measurements should be performed in permanent hydraulic conditions (Wan and Fell, 2004b).
The experimental procedure was tested on a road foundation material, but it can be implemented on any type of soil.
Soil preparation
In the present study, the erosional and hydraulic behaviours of a sub-base road material were assessed to validate the erosion test procedure. Indeed, up to 90% of pavement problems are related to internal flooding (Cedergren, 1988) and road aggregates must provide good capacity to infiltrate and store water.
The tested specimens were prepared by mixing soils of different sizes to obtain a GSD curve within the gradation limits required by the Ministry of Transportation of Quebec (MTQ), Canada, for sub-base aggregates as presented in Table 1. The mix of soils presents a coefficient of uniformity, C u, of 13 and a coefficient of curvature, C c, of 6·25, which makes it a poorly graded soil with a concave upward gradation curve. This material is internally unstable following the five theoretical criteria presented in Table 2 and is particularly representative of gap-graded soils.
Geotechnical characteristics of tested soil
| Physical characteristic | Results |
|---|---|
| GSD |  |
| Unified Soil Classification System classification | Silty sand (SP) |
| Relative density, D r | 2·658 |
| Maximal density, γ dmax: Mg/cm3 | 1·87 |
| Optimum water content, W opt: % | 5·4 |
| Coefficient of uniformity, C u | 13 |
| Coefficient of curvature, C c | 6·25 |
Internal stability assessment of the tested soil following theoretical criteria
| References | Criterion | Notes | Stability of tested soil |
|---|---|---|---|
| Kezdi (1979) | D 15(coarse)/D 85(fine) < 4 < D 15(coarse)/D 15(fine) |
|
|
| Sherard et al. (1984) | I r = D 15(coarse)/D 85(fine); I r < 5 |
|
|
| Kenney and Lau (1985, 1986) | H = F 4d − Fd H > F for F ∈ [0, X] |
|
|
| Burenkova (1993) | 0·55(D 90/D 15)−1·5 < D dv/D max < 1·87(D 90/D 15)−1·5 0·76 log(D 90/D 15) + 1 < D 90/D 60 < 1·86 log(D 90/D 15) + 1 |
|
|
| Wan and Fell (2008) | P = exp(z)/[1 + exp(z)] z = 3·875 log h″ + 3·591h′ + 2·436 |
|
|
The soils used for the mixture were initially oven-dried at 105°C for 24 h. The dry soils were then mixed thoroughly with a volume of de-aired water equal to 18% in mass. Thereafter, the mixed wet soil was kept in water for at least 24 h to facilitate the saturation stage. The wet soil was then deposited in the permeameter filled with de-aired water by layers. A ladle was used to prevent segregation up to a height of 160 mm (Figure 1(b)).
Saturation
After installing the specimen in the permeameter, a sieve plate, a glass bead layer 14·0 mm high and a metal spring were put in place before adding the top cap (Figure 1(c)). The saturation was performed according to ASTM D 2434-68(2006), ‘Standard test method for permeability of granular soils (constant head)’ (ASTM, 2006). This step was completed when the degree of saturation – calculated using the mass and volume method defined by Chapuis et al. (1989) – was at least 97%.
Erosion test
Following saturation, the specimen was subjected to a downward seepage water flow. The hydraulic gradient (i app) was increased in 10 min steps (i app = 0·1, 0·2, 0·3, 0·4, 0·5, 0·6, 0·7, 0·9, 1·0, 1·5, 2·0, 5·0, 8·0 and 10·0), which is identified as loading in the present investigation. For each step, hydraulic heads were measured from piezometric ports and the exit flow rate was measured after 1, 2, 4, 7 and 10 min. After 10 min, the eroded fine particles were retrieved. The bottom and top valves were closed during collection so that the hydraulic conditions of the specimen were not disturbed. The soil collector system was then substituted by an empty one. The eroded fines were put in a recipient to be oven-dried for 24 h before being weighed. To evaluate the hydraulic behaviour of the specimen after erosion, the hydraulic head was decreased gradually (i app = 5·0, 2·0, 1·0 and 0·3), which is identified as unloading in this research. This final step also aims to compare hydraulic conductivities before and after erosion in laminar flow conditions.
Post-erosion GSD
At the end of the erosion test, the permeameter was disconnected from the general set-up. The specimen was split into three layers (top, middle and bottom). The soil samples were oven-dried at 105°C for 24 h, and the GSD of each layer was evaluated according to ASTM D 6913/D 6913M-17, ‘Standard test methods for particle-size distribution (gradation) of soils using sieve analysis’ (ASTM, 2017b), to investigate the effect of suffusion.
Validation of the procedure
The erosion test procedure was reproduced twice for validation.
Exit water flow
The exit flow rate was measured during loading and unloading to assess the hydraulic behaviour of the tested soil (Figure 2(a)). At the beginning of the erosion test, clogging occurs at an applied hydraulic gradient (i app) of 0·4 and continues until some fine particles are detected in the effluent, which happens at a gradient (i app) of 0·7. Then, the flow rate increases from 0·11 to 3·97 cm3/s. During unloading, the water flow rate measured under a gradient of 0·3 was equal to 7·98 cm3/s, compared with 0·11 cm3/s during the loading step. This observation is due to the increase that occurs in pore volumes as a large amount of fine particles is leached out of the specimen. As the pore volume increases, the hydraulic conductivity increases, and according to Darcy’s law (with the applied hydraulic gradient and area remaining constant), the flow rate must increase. Results are in concord with the statements of Tomlinson and Vaid (2000). Indeed, the outlet water flow increases abruptly following migration of fine particles. The outflow is initially proportional to the gradient; thereafter a large increase in the flow rate occurs after suffusion occurs. These results were also demonstrated experimentally by Skempton and Brogan (1994), illustrating flow increasing disproportionately with gradient due to piping.
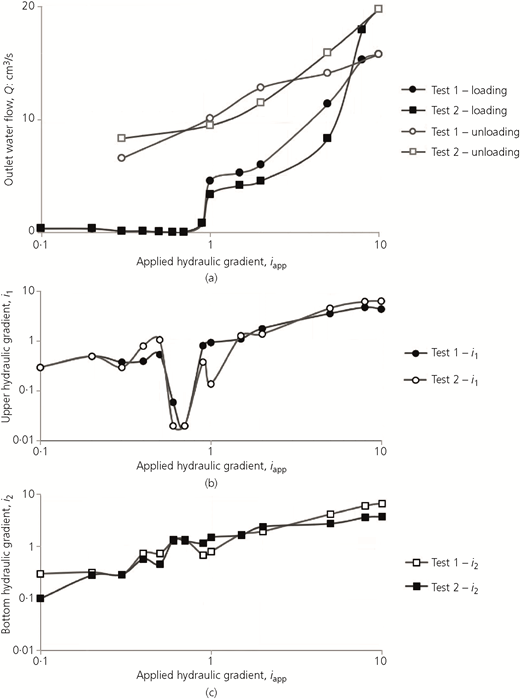
Hydraulic measurements during erosion test: (a) outlet water flow; (b) local hydraulic gradients at the top (i 1); (c) local hydraulic gradients at the bottom (i 2) of specimen
Hydraulic measurements during erosion test: (a) outlet water flow; (b) local hydraulic gradients at the top (i 1); (c) local hydraulic gradients at the bottom (i 2) of specimen
Effective hydraulic gradient
At the beginning of the erosion test (0·1 < i app < 0·3), the top hydraulic gradient (i 1) – between 75 and 125 mm – is slightly higher than the bottom hydraulic gradient (i 2) – between 75 and 25 mm. As fine particles start to migrate through the specimen under seepage water flow, the hydraulic gradient becomes higher at the bottom of the specimen (i 2), which means that the fine particles have been transported from the top to the bottom (Chapuis, 2016). During the fine particles’ transportation process (for 0·5 < i app < 0·9), the top hydraulic gradient (i 1) decreases abruptly and increases again when fine particles start to be detected in the effluent. Moreover, after erosion (starting from i app = 5), the bottom and top hydraulic gradients are similar, which translates the rearrangement of particles within the soil skeleton. Across all the erosion tests, the hydraulic gradient at the bottom of specimen (i 2) is much more stable than the top hydraulic gradient (i 1) as particle migration starts from the top (Figure 2(b)).
Hydraulic conductivity
Hydraulic conductivities at the top (k 1) – between 75 and 125 mm – and the bottom (k 2) – between 75 and 25 mm – were evaluated based on the local hydraulic gradients for loading and unloading (Figure 3). k moy is the mean value between k 1 and k 2. k tot is the hydraulic conductivity based on the applied hydraulic gradient.
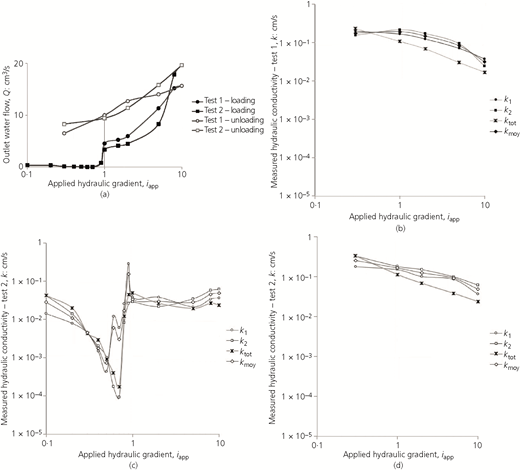
Hydraulic conductivities k 1 at the top, k 2 at the bottom, k moy as the mean and k tot based on the applied hydraulic gradients during (a, c) loading and (b, d) unloading for tests 1 and 2
Hydraulic conductivities k 1 at the top, k 2 at the bottom, k moy as the mean and k tot based on the applied hydraulic gradients during (a, c) loading and (b, d) unloading for tests 1 and 2
Hydraulic compaction of specimens occurs during the loading test, which explains the general reduction in hydraulic conductivities before erosion, for 0·1 < i app < 0·5 (Figure 3(a)). Tomlinson and Vaid (2000) demonstrated that hydraulic conductivity decreases gradually as soil forms a self-filtration zone over time. The self-filtration zone decreases the hydraulic conductivity of the system as the smaller fraction of the soil infills the bottom layer of the soil. As suffusion occurs, the various hydraulic conductivities tracked, locally and totally, increased by several orders of magnitude as a consequence of channel formation and loss of fine particles. These results were similar to those stated by Tomlinson and Vaid (2000) and Chang and Zhang (2011).
The total height of the specimen was measured at the end of the loading step and compared with the initial height. A total settlement of 17·9% was noticed, but applied hydraulic gradients were not adjusted accordingly in this test procedure. This value is higher than what was reported by Chang and Zhang (2011) and Xiao and Shwiyhat (2012). Note that the soil specimen was tested at its loose state in the present investigation. In contrast, those authors tested their cohesionless soil specimen at relative compaction higher than 91% and at optimum water content. Skempton and Brogan (1994) suggested that the primary structure formed by the coarse fraction of soil remains stable and only fine particles sustaining low lateral forces within macropores of the coarse skeleton are easier to erode.
During erosion, a difference occurs between local hydraulic conductivities along the specimen. Then, a stable behaviour of hydraulic conductivities is observed from i app = 1 and appears to reflect the rearrangement of soil particles within the soil skeleton and new equilibrium state (Chang and Zhang, 2011).
A slight increase was also detected due to specimen swelling as the applied hydraulic head decreases (Figure 3(b)). The ratio between hydraulic conductivities measured during loading (pre-erosion) and unloading (post-erosion) at an applied gradient range varies between 33·4 and 68·4 for the top (k 1), bottom (k 2), mean (k moy) and total (k tot) hydraulic conductivities. In general, the hydraulic conductivity is much higher after the erosion of fine particles. This phenomenon is due to the increase in pore volume in the soil skeleton following the erosion of fine particles out of the specimen. k 1 increases significantly following erosion and compared with k 2. The top part lost much more fines than the bottom one.
Mass of eroded particles and critical gradient
The total mass of eroded particles (M p) was normalised per unit area. The total mass retrieved all over the test was 180 g, which corresponds to 23 076 g/m2 (Figure 4(b)). In this test, failure takes place by piping, as M p is higher than 2500 g/m2 and R R = 3·9 ≫ 1 (Lafleur, 1999; Lafleur et al., 1989). The quantity of eroded particles is equal to 6·4% of the initial total mass and represents 20% of the initial proportion of fine particles.
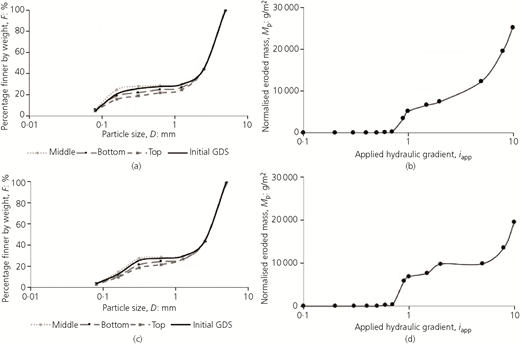
Change in the GSD due to loss of fine particles: (a, c) GDS post-erosion at different elevations among specimens and (b, d) normalised mass of fine particles collected out of specimen at various applied hydraulic gradients for tests 1 and 2
Change in the GSD due to loss of fine particles: (a, c) GDS post-erosion at different elevations among specimens and (b, d) normalised mass of fine particles collected out of specimen at various applied hydraulic gradients for tests 1 and 2
The critical hydraulic gradient (i ch) is defined as the gradient corresponding to the initiation of suffusion – namely, the gradient when the fine particles are detected at the effluent. The fine particles started to erode at an applied gradient i ch equal to 0·7, which is lower than Terzaghi’s critical gradient (Skempton and Brogan, 1994). Note that specimens herein, in contrast with those of Skempton and Brogan (1994), were subjected to a downward seepage flow. Although it might be the reverse in real-life situations, piping will be accentuated because gravity is assisting soil grains in their mobility (Tomlinson and Vaid, 2000).
GSD post-erosion
GSDs measured after the tests demonstrate that fine particles were more eroded at the top than at the bottom of the specimens (Figure 4(a)). Indeed, fine particles eroded from the top layer under seepage flow are captured in the bottom layer (Chang and Zhang, 2011; Kenney and Lau, 1985). In the middle layer, the amount of fine particles is slightly higher than in the initial soil because of the capture of some fine particles coming from the top layer. The general trend of the GSD in different layers matches well with changes noticed in local hydraulic gradients measured at the top (i 1) and the bottom (i 2) of the specimens. The local hydraulic gradient is higher in the top layer than that at the bottom, inducing more fine particles being eroded in the top (Fannin and Moffat, 2006; Moffat and Fannin, 2006; Moffat et al., 2011).
Conclusion
The proposed experimental procedure was developed to investigate the initiation and development of internal erosion under multistage seepage flow to quantify the suffusion critical gradient and understand the general hydraulic behaviour of an internally unstable granular material subjected to a unidirectional downward flow.
The procedure was tested on an internally unstable soil, which showed a critical gradient equal to 0·7 and a suffusion phenomenon by piping. The GSD curve analysed following erosion showed that more fine particles were eroded at the top compared with those at the bottom of specimens.
Finally, this test procedure was compared and validated with existing findings. It is easy to reproduce for a quick analysis of a soil’s hydraulic behaviour to evaluate the hydraulic performance of specific on-site granular materials at the design stage of a project or to help identify causes of failure, such as particle loss or clogging. The applied hydraulic heads, volume of specimen and water flow seepage direction could vary to meet field conditions.
Acknowledgements
This research was supported by the Natural Science and Engineering Research Council of Canada, the Fonds de Recherche du Québec Nature et Technologies and Menard Canada. The authors would like to thank the technicians at the geotechnical laboratory of Polytechnique Montréal, Geneviève Fruhauf, Samuel Chenier and Eric Turgeon, for their help during the elaboration of the procedure.

