
Surface subsidence induced by mining subsidence affects the overlying buildings and nearby utilities. Therefore, an investigation of the internal displacement and surface settlement is very important. A small-scale transparent soil model was developed to study the surface settlement profile and displacement field induced by mining subsidence. An analysis of the continuous change of the displacement field inside the transparent soil models indicates that the subsurface settlement at different subsidence stages can be approximated by a normal probability curve. Additionally, the observed surface settlements are consistent with settlement predictions of both the probability integral method and the Gaussian distribution method. The results indicate that it is a good way to study further the underground structure–soil interaction.
Notation
- B
horizontal displacement coefficient
- b
horizontal movement coefficient
- Cc
gradation coefficient
- Cu
uniformity coefficient
- c
soil cohesion
- f, g
greyscale intensities of images
- H
depth
- i
horizontal distance
- k
empirical constant of proportionality
- m
mining thickness
- P
inflection point of the settlement trough
- q
subsidence coefficient
- R
width of the depression
- r
main influenced radius
- r(z)
radius of the influence zone
- Smax
maximum settlement
- U(x)
horizontal movement
- Ue(x)
elemental horizontal displacement
- VL
ground loss volume
- VLti
ground volume loss rate at time t i
- W0
maximum subsidence
- W(x)
surface settlement
- we (x, y)
elementary subsidence
- x
horizontal distance measured from the centre of the depression to the point where settlement is measured
- x, y
dimensions of the interrogation area A
- (x, y, z)
global coordinates
- α
dip angle of coal seam
- β
angle of the influence zone of ground settlement
- (ξ, ζ, η)
local coordinates
- ψ
internal friction angle of soil
Introduction and motivation
Ground subsidence and environmental hazards caused by high-intensity and large-area exploitation of coal resources have become more and more serious in China (Chen et al., 2013). Significant horizontal and vertical movements at the ground surface not only damage the overlying buildings and nearby utilities, but also seriously restrict the sustainable development of urban areas (Dejun et al., 2016; Marino et al., 2013; Quanyuan et al., 2009; Shu et al., 2016). The structure’s behaviour and the damage caused by the strain and curvature in the subsidence have been studied (Boscardin and Cording, 1989; Speck and Bruhn, 1995). Frequent cases of mining subsidence attract many experts and scholars to pay attention, so geodetic measuring and experimental and theoretical investigations have been used to study the adverse impacts of subsidence on surface structures (Cui et al., 2000; Jung et al., 2007; Mair et al., 1997; Qin and Perissin, 2015). Regrettably, up to now, few methods have been able to make a full evaluation of the structural damage because of the uncertainties about the soil–structure interaction phenomena that may occur (Bell et al., 1988; Potts and Addenbrooke, 1997; Son and Cording, 2008) or because of the uncertainties regarding building characteristics. However, except for the complexity of mining strata, estimating the magnitude and the shape of mine subsidence ground movement profiles is critical in assessing the likely damage potential to surface or buried structures. Fortunately, Franza et al. (2019) and Marshall et al. (2012) have done a lot of work on greenfield tunnelling in sands: the effect of size, depth, volume loss, soil density and relative depth on greenfield displacements. It is crucial to eliminate the discrepancies and improve the accuracy of the influenced structures’ safety.
Measurement of the internal deformation fields is critical to the understanding the of soil response induced by mining subsidence. Researchers have made numerous attempts in the past to seek further improvement by measuring the whole displacement. Subsequently, the development of transparent soil modelling, involving the use of laser-aided tomography, digital imaging and particle image velocimetry (PIV) technology, has made it possible to observe ground movements and soil internal displacements in laboratory tests (Bathurst and Ezzein, 2015; Chatellier et al., 2013; Iskander and Liu, 2010; Lehane and Gill, 2004; White and Bolton, 2004; White et al., 2003). Furthermore, transparent soil modelling using the PIV technique has been widely used in geotechnical research, such as soil–structure interaction problems (Ezzein and Bathurst, 2014; Iskander et al., 2003; Suleiman et al., 2014), tunnelling-induced settlements (Ahmed and Iskander, 2011, 2012) and pile installation problems (Hird and Stanier, 2010; Ni et al., 2010; White and Bolton, 2004; Xiao et al., 2016, 2017). Previous studies showed that transparent soil combined with the PIV technique is an appropriate method for solving internal displacement field and surface settlement problems.
Although the basic principle of modelling using the transparent soil and PIV technology is well established, its application is still restricted to a cluster of researchers and is not yet widely used in mining engineering. Hence, there is a need to propagate its potential further and explore its research values in mining subsidence.
This paper describes surface subsidence using transparent soil and PIV technology. The objective is to establish a small-scale physical modelling method, in which the internal displacement field of the soil induced by mining could be observed non-intrusively and could be precisely quantified by the PIV technology. Results of soil subsidence processes are then presented and compared with the predictions of the probability integral method (PIM) and Gaussian distribution method. It is intended that, once established, such a transparent soil model test system could be used to investigate more complicated geotechnical processes (e.g. pile foundations, pipelines and even other building foundations induced by subsidence) in mining subsidence areas that have not been previously and directly observed at the laboratory scale.
Experimental methodology
Model test set-up
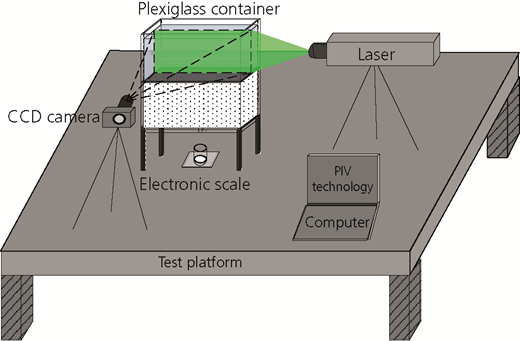
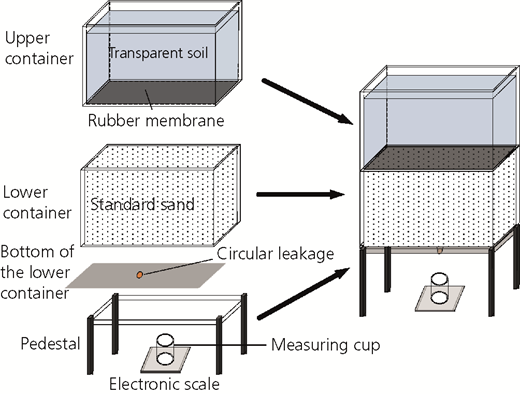
The model test set-up (Figure 1) includes the upper container, the lower container, the pedestal, the electronic scale, an optical platform, a 3 W linear laser, a charge-coupled device (CCD) camera and a computer for image processing. The laser light produces a maximum output power of 3 W and is able to shoot through the model plexiglass. The images (before and after deformation) are captured and stored in the computer. The dimensions of the upper transparent soil container and lower sand container are 400 × 250 × 300 and 400 × 260 × 200 mm (length/width/height), respectively. The sand container is seated on the pedestal with a circular leakage opening at the bottom. The outflow flux of sand is controlled by adjusting the diameter of the hole, which is 2 mm. The electronic scale located beneath the leakage hole is used for the measurement of sand weight flowing out of the lower container and controlling the settlement quantity. The upper container is placed on the lower container with a rubber membrane at the interface to insulate the transparent soil and sand. Figure 2 shows the details of the model chamber for ground deformation induced by mining.
Transparent soil
Transparent soil is a kind of manufactured saturated soil, formed by certain graded fused quartz and a pore fluid with a matching refractive index (RI) that has a high transparency (Figure 3). The engineering properties of transparent soils have been extensively investigated and discussed and shown to be broadly similar to those of many natural soils, suitable for simulating geotechnical properties (Iskander et al., 1994; Liu and Iskander, 2010; Sadek et al., 2002). In this study, fused quartz was manufactured by melting the natural quartz crystals present in quartzite sand at approximately 580°C and then cooling them. More than 99·5% of the fused quartz was silicon dioxide (SiO2) with small amounts of other trace elements. The fused quartz is angular in shape and was manufactured by Xuzhou Xinyi Wanhe Minerals (China). Its size ranges from 0·1 to 1·0 mm, with a uniformity coefficient (C u) and a gradation coefficient (C c) equal to 1·87 and 1·01, respectively (Kong et al., 2015). The RI of fused quartz is 1·4585 (Ezzein and Bathurst, 2011; Guzman et al., 2014; Kong et al., 2015). To provide the best match to the fused quartz, a series of tests was designed to find the optimum oil blend, while the total fluid volume and device weight were kept constant. The aforementioned tests and the model test were performed in an air-conditioned room, where the temperature was kept constant to within ±1°C.
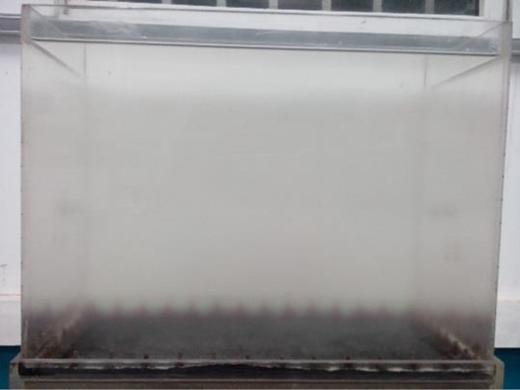
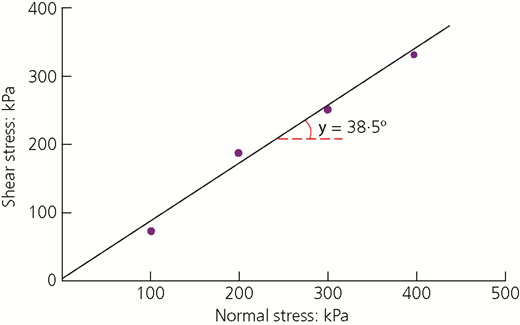
Table 1 and Figure 4 present the physical properties of the transparent soil. The strength parameters derived from the direct shear tests on specimens are c = 0 and Ψ = 38·5° (Figure 4), similar to the values reported for natural sands.
Physical properties of transparent soil
| Material | Relative density: g/cm3 | RI | Moving viscosity: cSt |
|---|---|---|---|
| Fused quartz | 2·186 | 1·4585 | — |
| N-Dodecane | 0·749 | 1·419 | 2·01 (20°C) |
| Number 15 white mineral oil | 0·832 | 1·464 | 14·2 (40°C) |
The properties of the sandy soil in the bottom layer and its relative density are in Table 2.
Displacement field measurement using the PIV technology
In this study, the interaction between the transparent soil and laser light produced a distinctive speckle pattern. Movements of small particles can result in changing the speckle distribution on the plane of measurement. Two images captured before and after incremental displacements were used to calculate the displacement fields by using the PIV technology, which was originally developed in the field of experimental fluid mechanics (Adrian, 1991) and is a widely recognised pattern-recognition and image-registration technique used in surface settlement and internal displacement analysis, as well as many other applications (Chatellier et al., 2013; White et al., 2003). Then, the magnitudes and directions of soil displacements can be recorded. After each test, the image-processing methods for PIV described earlier were applied to generate an array of displacement vectors for the desired subsidence procedure.
The discrete form of the standard cross-correlation function (Huang and Tsai, 1981) is as follows
where x and y are dimensions of the interrogation area A and f and g are the greyscale intensities of the two images. The cross-correlation function is applied repeatedly while shifting the images by distances Δx and Δy. The correlation function given in Equation 1 is sensitive to the average intensities of the two images. Therefore, the zero-normalised cross-correlation function is normally used in the whole analysis (Ezzein and Bathurst, 2014).
Experimental set-up
Two plexiglass containers were used in the test. The upper one contains transparent soil, and the lower one contains sand (Figure 2). The sand container was filled by the sand pourer. The tests were conducted by triggering ground loss by using the outflow of sand from the lower container, simulating underground excavation. An electronic scale was used to weigh the sand leaking from the container. That means that the soil surface subsidence process could be controlled by leakage from the hole at the bottom of the sand container and the electronic scale at the same time.
During subsidence, the laser light sheet was used to illuminate the deformation of measurements inside the model, and the CCD camera captured every image at the same time. These images were processed to obtain corresponding deformations relative to the soil subsidence and displacement field in the soil mass induced by mining subsidence. Complete surface settlement and internal displacement fields were obtained from the set of images captured in the test.
Ground displacement vectors
According to the test system and the experimental set-up, the ground movements should be approximately axisymmetric with respect to the vertical axis passing through the leakage hole. All of the following displacement vectors and contours take half of the symmetry.
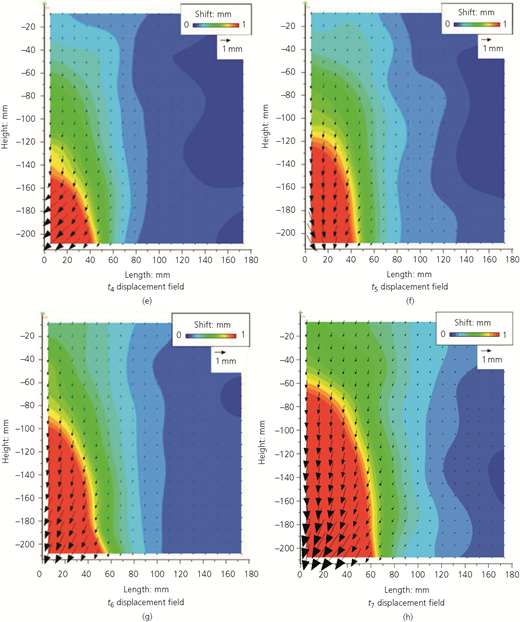
The typical displacement vectors observed in the transparent soil models are shown in Figure 5 for eight subsidence stages. Arrows indicate spatial displacements in the transparent soil. Figure 5(a) presents the initial displacement field before subsidence. Figures 5(a)–5(h) indicate how the displacement field proceeds with soil subsidence at different subsidence stages. Soil internal displacements over and around the leakage tend to manifest at the surface in a sinkhole extending from the circular leakage axis. The displacement vectors observed in the transparent soil model were distributed symmetrically. Surface displacement gradually develops from bottom to top during the whole mining process. The scope of subsidence influence was gradually expanding from Figures 5(a) to 5(h). This fact is consistent with the contour of vertical displacement shown in Figures 6(a)–6(h) for the eight subsidence stages.
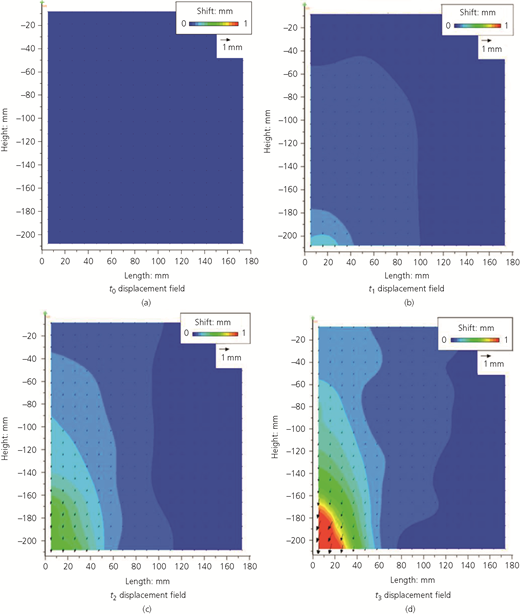
Displacement vectors observed in the transparent soil model. Arrows indicate spatial displacements in soil. (a) The initial displacement field before subsidence; (b–g) different displacement fields during subsidence; (h) the final displacement field after subsidence
Displacement vectors observed in the transparent soil model. Arrows indicate spatial displacements in soil. (a) The initial displacement field before subsidence; (b–g) different displacement fields during subsidence; (h) the final displacement field after subsidence
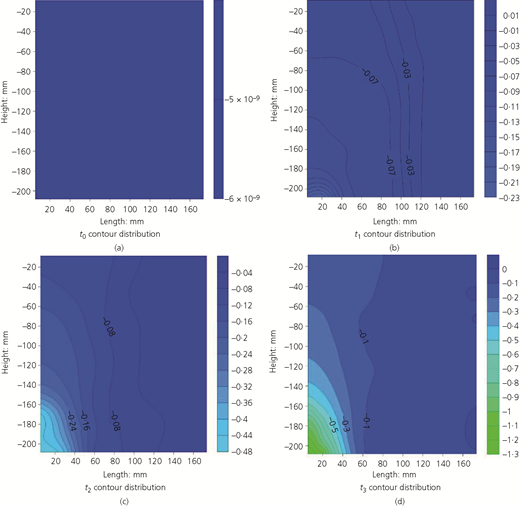
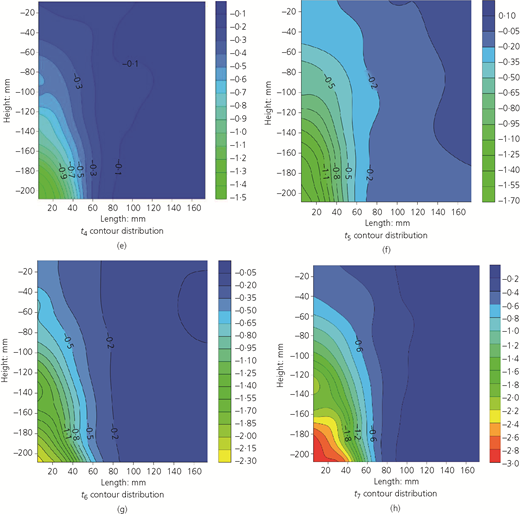
Vertical contour distribution during the subsidence process; unit: millimetres. (a) The initial contour distribution before subsidence; (b–g) different contour distributions during subsidence; (h) the final contour distribution after subsidence
Vertical contour distribution during the subsidence process; unit: millimetres. (a) The initial contour distribution before subsidence; (b–g) different contour distributions during subsidence; (h) the final contour distribution after subsidence
Figure 6 shows the displacement distributions during the mining subsidence. This trend shows more settlement towards the edge of the leakage hole, which is consistent with what is observed for the above displacement vector figures. The horizontal displacement and vertical settlement expanded considerably with continuing sand leakage, as seen in Figures 6(a)–6(h). The maximum soil displacement was observed near the circular leakage region.
Figure 7 shows the horizontal contour distribution during the subsidence process at time t = 7. In Figure 7, three horizontal section contours were extracted from the bottom to the top, and the subsidence gradually developed from the bottom up. The horizontal scope of subsidence gradually expanded. All these also show that the ground movements are approximately axisymmetric with respect to the vertical axis passing through the leakage hole.
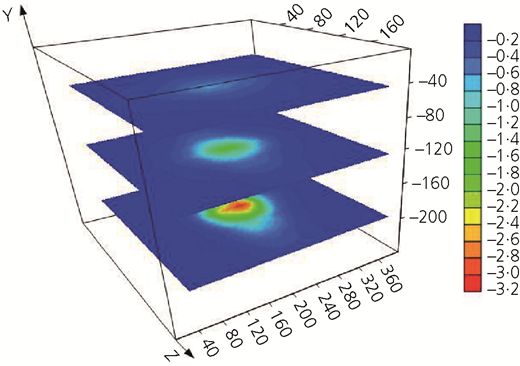
Horizontal contour distribution during the subsidence process (t = t7). All units of measurement are in mm
Horizontal contour distribution during the subsidence process (t = t7). All units of measurement are in mm
Evaluation of surface settlement
Ground subsidence prediction: PIM
Polish scholar J. Litwinisyn first proposed the stochastic medium theory in rock movement in 1957. Based on this theory, Chinese scholars Liu and Liao (1965) developed PIM, which has been widely used in mining subsidence prediction. The law of strata and ground movement caused by mining is similar to the law of stochastic medium granule modelled at the macroscopic scale. An example of an elementary excavation with dual coordinate systems is shown in Figure 8: one for global coordinates (x, y, z) and the other for local coordinates (ξ, ζ, η). The elemental excavation has dimensions of dξ by dζ by dη, as shown. Considering an extreme case where the underground excavation has totally collapsed, the elementary subsidence w e (x, y) induced by the elementary excavation can be obtained from (Sroka and Schober, 1982)
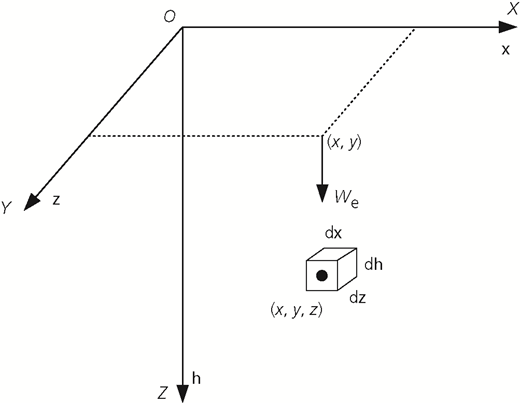
The elemental horizontal displacement U e(x) induced by the elementary excavation in plane strain state is
where B is the horizontal displacement coefficient; r(z) is the radius of the influence zone (= z/tan β); and β is the angle of the influence zone of ground settlement.
For an underground cavity induced by longwall mining, the ground surface subsidence and ground surface horizontal displacement are given as follows
where for the surface settlement W(x), the maximum subsidence is W 0 = mq cos α, the mining thickness is m, the subsidence coefficient is q and the dip angle of the coal seam is α. , and r is the main influenced radius. The horizontal movement is U(x), and the horizontal movement coefficient is b. Both Equations 4 and 5 are the basic formulae for developing the equations for ground surface movement due to mining.
Ground subsidence prediction: Gaussian distribution curve
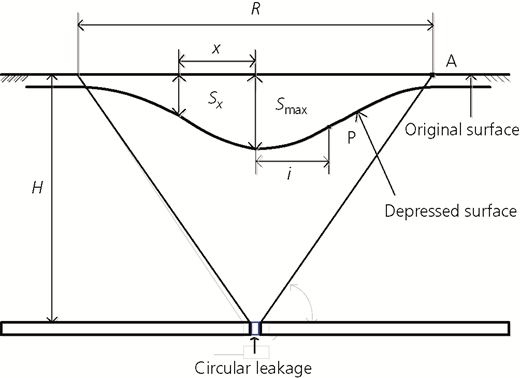
Peck (1969) proposed a Gaussian distribution curve for estimating the ground settlement due to tunnelling and excavation. Although the method has very little theoretical basis, the shape of the distribution curve is similar to the commonly observed profiles and it can easily fit each particular case with a few parameters, so it has been widely used to estimate the ground settlement due to tunnelling and excavation in engineering practice. To understand the influence of important parameters, the three-dimensional (3D) problem can be idealised by considering a circular cavity at a depth H (Figure 9). The PIVview software program was able to capture images before and after the subsidence in order to measure the resulting displacements within the transparent soil. Uniformity was ensured by the displacement vectors showing uniform consolidation of the transparent soil (Figure 5(a)).
Then, the surface depression that developed after opening the sand leakage was assumed to be defined by a Gaussian distribution function, as follows
where S max is the maximum settlement; i is the horizontal distance to the inflection point P of the settlement trough; x is the horizontal distance measured from the centre of the depression to the point where settlement is measured; and R is the width of the depression (Figure 9). The influence zone in Figure 9 is represented by straight external failure surfaces emerging from the corner of circular leakage region and intersecting the surface of the soil at point A based on the geometry shown in Figure 8.
O’Reilly and New (1982) furthered Peck’s method and defined i as
where k is the empirical constant of proportionality. In practice, the empirical solution given by Peck (1969) and the parameter k introduced by O’Reilly and New (1982) are most commonly used to determine the surface settlement trough induced by excavation. A variety of different empirical solutions of the settlement trough parameter x i have been derived, and an agreement has been reached that x i is related to the excavation, with the limitation of the expected ground loss volume, V L (Ahmed and Iskander, 2011), so predicting the magnitude of ground loss is important. The ground loss volume, V L, can be measured in this experiment.
Comparison of surface settlements with different methods
In most cases, little detailed information is present for the whole subsidence process, but it would be practical to estimate the amount of surface settlement according to generally known excavation characteristics. Figure 10 shows the surface settlements in the ground subsidence periods t 0, t 1, …, t 7. Eight moment settlements (subsidence moments t 0–t 7) exhibiting the concave settlement profile are used to verify the continued subsidence subjected to excavation in Figure 10. Obviously, the magnitude of the surface settlement changes significantly due to ground loss volume (sand loss volume in the test). At the initial moment t 0, the surface settlement is zero and the surface curve is straight. From the initial moment t 1 to the last subsidence moment t 7, the maximum surface settlement is at 200 mm in length, just over the leakage hole, and increases with ground loss volume, which gradually transforms into a normal settlement trough.
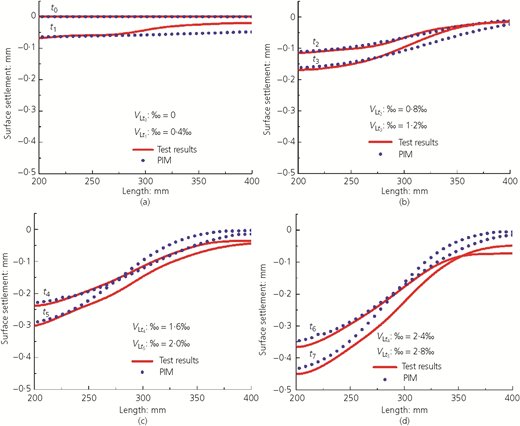
Comparison of measured Gaussian distribution and PIM-predicted surface settlements. V is the volume of transparent soil and the volume of sand. V L is the volume loss. V Lti is the volume loss at time t i in the subsidence process. The ground volume loss rate at time ti is V Lti: ‰ = V Lti/V × 1000 (i = 1, 2, 3, …, 7). The surface settlements at (a) t 0 and t 1; (b) t 2 and t 3; (c) t 4 and t 5 (d) t 6 and t 7
Comparison of measured Gaussian distribution and PIM-predicted surface settlements. V is the volume of transparent soil and the volume of sand. V L is the volume loss. V Lti is the volume loss at time t i in the subsidence process. The ground volume loss rate at time ti is V Lti: ‰ = V Lti/V × 1000 (i = 1, 2, 3, …, 7). The surface settlements at (a) t 0 and t 1; (b) t 2 and t 3; (c) t 4 and t 5 (d) t 6 and t 7
Figure 10 also shows the surface settlement trough calculated using PIM and the Gaussian distribution method with V L. This figure shows that the measured settlement trough is in good agreement with both prediction methods. The authors note that the fitting result of the Gaussian distribution method is better than that of PIM, while both surface settlement prediction methods are widely used in engineering. This means that this transparent soil test system could display a normal settlement trough, which can indicate the subsidence settlement induced by underground excavation.
Subsurface settlement profiles
Four typical subsurface settlement profiles observed in the transparent soil models are shown in Figure 11 during mining subsidence. The subsurface settlement profiles indicate that soil movements tend to manifest at the surface of a sinkhole extending from the subsidence centre. Vertical soil movements over the subsidence centre were found to be the maximum, and then the movement at the subsidence centre was transmitted to the surface, as it gradually reduced. The settlements at moment t1 are the smallest, and the settlements at moment t7 are the largest. In the same subsurface profile, for instance Figure 11(d), it can be seen that the settlement in the lower region is larger than that in the upper region. The settlement trough in the overburden over the excavation becomes wider from the lower area to the upper area in the direction of the ground surface.
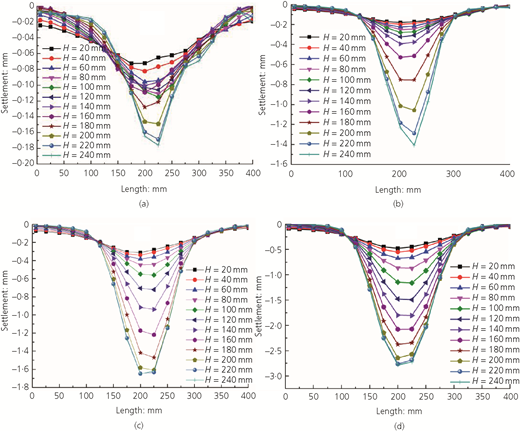
Subsurface settlement profiles in the transparent soil model during subsidence (H, height): the subsidence settlement profile at (a) t1; (b) t3; (c) t5; and (d) t7
Subsurface settlement profiles in the transparent soil model during subsidence (H, height): the subsidence settlement profile at (a) t1; (b) t3; (c) t5; and (d) t7
Results and discussion
The small-scale model test can be used to observe and measure complex subsidence patterns induced by mining in 3D laboratory tests, combining PIV technology and transparent soil. Spatial displacement fields inside the soil that are perpendicular to the mining subsidence are obtained. The prediction of PIM is used to verify the rationality of the test. The following conclusions are drawn from the transparent soil model tests completed to date.
Based on the continuity of the sand drain method and continuous shooting of the CCD automatic camera, a small-scale transparent soil model test can continuously and completely simulate the whole mining subsidence process. At the same time, the surface settlements and displacement contours can be obtained in the ground subsidence process by the PIV technique.
The authors conclude that the developed transparent soil model with PIV technology can describe and visualise reasonably well the mining-induced ground settlement profiles of the soil. Both ground settlement prediction methods, PIM and the Gaussian distribution method, confirm the test results.
A more intuitive study of the soil internal displacement due to mining subsidence can be realised. Furthermore, it is very useful and important for further study on buried structures (such as piles, pipelines, bridges or building foundations) in mining engineering or civil engineering.
Although the subsidence process could be well modelled by transparent soils, the study was performed using a low confining stress, so the effect of dilation may have been overemphasised. Furthermore, this scaled model cannot be simply proportioned to relate to field performance. In addition, considering the laser penetration rate, the model scale is limited and only one internal displacement is triggered by leaking sand from the sand container in this study – multipoint displacement can be simulated in the future – the transparency of the model gradually degrades as the size of the model is increased.
The limited size of the sample might have a boundary effect, particularly in the case of deep mining. High-purity fused silica and fluid with a better match of the RIs should be investigated for future studies.
Acknowledgements
The authors wish to thank Professor Hanlong Liu and Professor Xuanming Ding of the University of Chongqing of China for providing soil testing equipment and data acquisition system to the project and Professor Barry Lehane of the University of Western Australia for help and guidance. The authors also wish to acknowledge the financial support from the National Natural Science Foundation (Numbers 51508166 and U1404527) and Henan Provincial Department of Education Project (Numbers 15A560007 and 14B560021).
