
This paper presents a detailed analysis of the effect of oil contamination on the geotechnical behaviour of bridge pile foundations, focusing on the influence of soil type, oil-contamination intensity and oil-contamination depth. A thorough parametric study of these dominant parameters was carried out through numerical analyses that were performed using Flac3D software. The analyses were designed using three types of soils: poorly graded sand (SP), silty sand (SM) and kaolinite clay. Oil contamination degrades the geotechnical behaviour of bridge pile foundations. Soil type has a clear effect on the internal forces induced in the piles, with maximum normal forces occurring in SP, the maximum bending moment in kaolinite clay and maximum shear forces in SM. The variation of oil-contamination intensity in the soil changes the induced internal forces in the piles by ratios increasing to 40, 34 and 20% of the bending moment, the shear forces and the normal forces, respectively. However, the alterations in the displacements of the soil and the piles are more significant, with ratios up to 150%. In contrast, the oil-contamination depth has a limited effect on the internal force of the pile (up to 4%) but has a considerable effect on the displacement of the foundation.
Notation
- C
soil cohesion
- Cv
coefficient of consolidation
- Dp
diameter of the piles
- E
Young’s modulus of the piles
- E × A
axial stiffness
- E × I
bending stiffness
- Eos
Young’s modulus of the soil
- Est
Young’s modulus of the superstructure
- Lp
length of the piles
- M
lumped mass representing the bridge superstructure mass
- Mmax
maximum bending moment in the piles
- mv
coefficient of volume compressibility
- Nmax
maximum normal force in the piles
- S
soil contamination depth
- Tmax
maximum shear force in the piles
- Umax
maximum soil vertical displacement
- ζs
damping ratio of the soil
- ν
Poisson’s ratio of the piles
- νs
Poisson’s ratio of the soil
- νst
Poisson’s ratio of the superstructure
- ξ
damping ratio of the piles
- ξst
damping ratio of the superstructure
- ρ
mass density of the piles
- ρs
mass density of the soil
- ρst
mass density of the superstructure
- φ
friction angle of the soil
- Ψ
soil dilation angle
Introduction
Oil is currently the most significant source of energy in the world, and as such, it has crucial importance on the development of the world economy in terms of satisfying the accelerating demands for energy, particularly in the industrial and transportation sectors. However, the increasing global demand for oil products has several negative effects. The possibility of oil leakage into soils increases with its global usage; oil contamination can occur during warfare, accidents, drilling, storage, transportation or natural disasters. According to a report by the European Environment Agency (EEA, 2014), crude oil (comprising mainly alkanes, alkenes and cycloalkanes) is one of the main pollutants in European contaminated sites, forming 23·8% of total soil contaminants. For example, 39% of Hungary’s and 55% of Ireland’s reported ground contamination are mainly the result of oil spills from transport operations. It is also reported that 32% of the contamination in Belgium (Flanders) has been caused by oil handling and refining within industrial and commercial activities. Around 450 000 contaminated sites have been reported in the USA. Soil contamination by oil products is a serious geo-environmental issue that poses serious health and environmental risks (Bermúdez-Couso et al., 2012). Crude petroleum is a complex mixture constituted mainly of hydrocarbons, organic sulfur compounds, nitrogen and oxygen. This mixture contains hundreds of thousands of hydrocarbons, ranging from light, volatile, short-chained organic compounds to heavy, long-chained, branched compounds. Soil contamination can include this full range of hydrocarbons and combinations thereof. Contaminated soil presents different geotechnical properties in comparison with clean soils. There is thus some research interest in the geotechnical behaviour of contaminated soils and their effect on engineering structures such as piles. In addition, there is further interest in the remediation of hydrocarbon-contaminated sites. Experimental tests of oil-contaminated soils, with varying contamination concentrations, have been carried out on sandy soils (Khamehchiyan et al., 2007; Puri, 2000; Shin and Das, 2001), clayey soils (Karkush and Kareem, 2017; Khamehchiyan et al., 2007), clayey silts (Resol, 1999), basaltic residual soils (Rahman et al., 2010), soft clays (Elisha, 2012), lateritic soils (Ijimdiya, 2013), kaolinite soils (Khosravi et al., 2013; Ota, 2013), bentonite–kaolinite–sand mixtures (Daka, 2015), silty sand (Hafshejani and Hajiannia, 2016) and silty soils (Kermani and Ebadi, 2012). Given the variety of different soils and the variety of different petroleum products that have been tested, it is not surprising that the results of the tests sometimes indicate different and sometimes contrary outcomes. Some of the key observations of oil-contaminated soils are reviewed here for convenience. Most studies have observed immediate effects of contamination. A long-term study (2 years) indicated that the full effects of oil contamination on the geotechnical properties of soils (outlined here) occur at approximately 6 months (Nazir, 2011).
Basic soil properties
For clayey and basaltic residual soils, the values of the liquid and plastic limits decrease with increasing oil contamination (Khamehchiyan et al., 2007; Rahman et al., 2010). However, for silty soils and soft clayey soils, increase in the plastic limit and liquid limit have been observed, alongside a decrease in the plasticity index (Elisha, 2012; Kermani and Ebadi, 2012). For lateritic soils, the liquid and plastic limits and the plasticity index all increase with increasing oil contamination (Akinwumi et al., 2014). For pure kaolin, the plastic limit decreases, but the liquid limit increases and then decreases again at high oil content (16%) (Khosravi et al., 2013). In addition, the amount of linear shrinkage increases with increased contamination (Ota, 2013). Specific gravity has been observed to decrease with increasing oil content (Akinwumi et al., 2014). Due to the formation of differently sized soil clods, particle size distributions vary with different oil types. In general, the grading modulus increases with increasing oil content (Daka, 2015).
Compaction behaviour
The maximum dry density of sand containing oil is higher than that of sand containing water, but the peak occurs at the same degree of saturation (irrespective of the fluid used) (Khamehchiyan et al., 2007; Mohammadi et al., 2018; Puri, 2000). However, the optimum moisture content (OMC) peak decreases with increasing oil content. Moreover, according to results, the maximum dry density would occur at approximately the same total saturation if the oil is mixed with water. For silty soils, a similar pattern was observed by Kermani and Ebadi (2012). Using engine oil as the contaminant for basaltic soils, a reduction in both the maximum dry density and OMC is observed (Rahman et al., 2010). In this case, summing the oil and water would generate higher soil saturation for maximum dry densities with increasing oil content. One question, however, is the volatility of the oil used and how this may affect the measured moisture contents by way of standard oven-based tests.
Strength properties
Sandy, bentonite-rich and pure kaolin soils tend to display a reduction in the angle of friction, alongside a small increase in cohesion, with the addition of oil (Khamehchiyan et al., 2007; Khosravi et al., 2013; Mohammadi et al., 2018), whereas clayey and silty soils display an increase in the angle of friction and a reduction in cohesion (Kermani and Ebadi, 2012; Khamehchiyan et al., 2007). These combined effects result in a reduction in peak shear strength for clayey and sandy soils (Puri, 2000) and basaltic residual soils (Rahman et al., 2010). Other authors have observed a decrease in both the cohesion and angle of friction of clayey soils (Karkush and Kareem, 2017). In unconfined compressive strength tests, small amounts of oil have produced additional strength, which has decreased rapidly with increasing oil content (Ijimdiya, 2013).
Consolidation behaviour
During consolidation tests on silty and clayey soils, the presence of oil increases the compression index under identical loads (Karkush and Kareem, 2017; Kermani and Ebadi, 2012) and also reduces the coefficient of volume compressibility (m v) and the coefficient of consolidation (C v) (Ijimdiya, 2013). However, Talukdar and Saikia (2013), after studying several soils, identified that a reduction in C v is statistically significant only for low-compressibility clay soils and not for intermediate- and high-compressibility clay soil and clay–sand mixtures.
Permeability behaviour
As oil content increases, permeability tends to decrease for all soils (Daka, 2015; Khamehchiyan et al., 2007; Rahman et al., 2010). Oil contamination also decreases swelling pressures (Elisha, 2012).
Structural behaviour
Only limited research has been carried out on the effect of oil-contaminated soil on the geotechnical behaviour of foundations of structures and infrastructure (buildings, roads and bridges). Oil contamination drastically reduces the bearing capacity of undrained oil-contaminated sand (Shin and Das, 2001). Using numerical modelling, the ultimate bearing capacity of piles buried in oil-contaminated silty sand is reduced by approximately 30% (Hafshejani and Hajiannia, 2016).
This brief literature review indicates the variability of reported results in the literature, showing the complexity of this subject. Including soil type and oil contamination type as variables, there are a wide variety of engineering responses. In general, however, on the basis of the preceding discussion, three major soil types with differing behaviours can be identified: sand (poorly graded) (SP), silty sand (SM) and kaolinite clay.
This study evaluates the geotechnical behaviour of a bridge piles foundation embedded in oil-contaminated soils. The focus of this study is (a) the geotechnical effects of contamination by oil, (b) the effect of contamination depth, (c) the impact of contamination intensity and (d) the variation of the oil-contamination effect according to soil type. The model selected for this study is a bridge supported by a group of six piles emplaced into a non-linear Mohr–Coulomb constitutive model.
Numerical model
Soil–pile–bridge model (uncontaminated kaolinite clay)
The model consists of a bridge supported by a group of six floating reinforced-concrete piles with a length and a diameter of L p = 10·5 m and D p = 0·8 m, respectively. One layer of homogenous soil with a depth of 40 m supports the emplaced piles; those piles are rigidly connected in a 1 m thick reinforced-concrete cap as shown in Figure 1. Tables 1 and 2 present the properties of the piles and the superstructure, respectively. The mechanical and geometrical characteristics of the model are presented in Figure 1(a). The piles being rigidly connected by way of the rigid pile cap ensures both full shear and moment transfer; the interpile spacing is S = 3·75D p = 3 m. The cap is placed 0·5 m above the soil surface. In this model, the soil behaviour is described by an elastic–plastic law without hardening according to the standard Mohr–Coulomb elasto-plasticity model. The analyses are performed initially for an uncontaminated kaolinite clay (C = 146 kPa, φ = 8·1°) (Khosravi et al., 2013). The characteristics of soil layer are given in Table 3. A small viscous Rayleigh-type damping model is used for the soil to improve numerical stability. A 0·05 damping ratio is used for the soil and 0·02 for the structural elements. The behaviour of the structural elements – piles, cap and bridge pier – is assumed elastic. The superstructure is modelled by a pillar supporting a lumped mass at the top of M = 350 000 kg. Symmetrical boundary conditions are applied at the model boundary, while the base of the soil mass is assumed fixed and rigid.
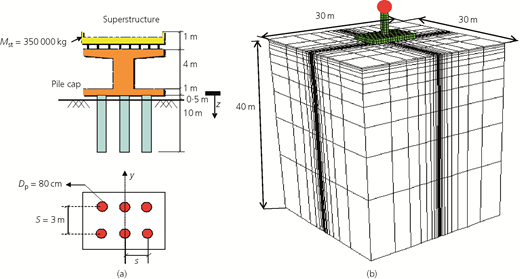
Soil–piles–bridge system: (a) system geometry; (b) three-dimensional numerical mesh (138 structural elements and 12 138 nodes)
Soil–piles–bridge system: (a) system geometry; (b) three-dimensional numerical mesh (138 structural elements and 12 138 nodes)
Elastic properties of the pile materials
| Material | Diameter: m | Mass density, ρ: kg/m3 | Young’s modulus, E: MPa | Poisson’s ratio, ν | Damping ratio, ξ: % | Height: m |
|---|---|---|---|---|---|---|
| Pile | 0·8 | 2500 | 20 000 | 0·3 | 2 | 10 |
Elastic properties of the superstructure
| ρ st: kg/m3 | E st: MPa | ν st | ξ st: % | Mass: kg |
|---|---|---|---|---|
| 2500 | 8000 | 0·3 | 2 | 350 000 |
ρ st, E st and ν st, density, Young’s modulus and coefficient of Poisson’s ratio of the superstructure, respectively; ξ st, percentage of critical damping; E × A and E × I, axial stiffness and bending stiffness, respectively
Properties of uncontaminated kaolinite clay (Khosravi et al., 2013)
| ρ s: kg/m3 | E os: MPa | ν s | K o | ζ s: % | C: kPa | φ: ° | Ψ: ° |
|---|---|---|---|---|---|---|---|
| 1770 | 15 | 0·4 | 0·9232 | 5 | 146 | 8·1 | 0 |
ρ s, E os and ν s, density, Young’s modulus and coefficient of Poisson’s ratio of the soil; K o, earth pressure at rest; ζ s, percentage of critical damping; C, φ and Ψ, cohesion, internal friction angle and dilatation angle of the soil
A variable density mesh is employed to minimise the analysis cost; thus, the mesh is densified at the centre of the model. The used mesh shown in Figure 1(b) includes 3856 zones of eight nodes and 138 three-dimensional (3D) structural elements of two nodes.
Results and discussion
Table 4, Figures 2 and 3 show the internal forces induced in the piles. Negligible bending moment and shear forces are produced in the central pile accompanied by a significant normal force. For the corner piles, the maximum internal forces occur towards the ground surface.
Response of a group of 2 × 3 piles
| C: kPa; φ: ° | Internal forces | |||||
|---|---|---|---|---|---|---|
| Corner piles | Central piles | |||||
| Nmax: kN | Tmax: kN | Mmax: kN m | Nmax: kN | Tmax: kN | Mmax: kN m | |
| 146; 8·1 | 839·3 | 18·15 | 53·09 | 758·1 | 0·0001 | 0·00056 |
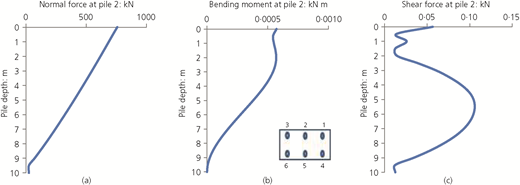
Internal forces at central pile 2: (a) maximum normal force; (b) maximum bending moment; (c) maximum shear force
Internal forces at central pile 2: (a) maximum normal force; (b) maximum bending moment; (c) maximum shear force
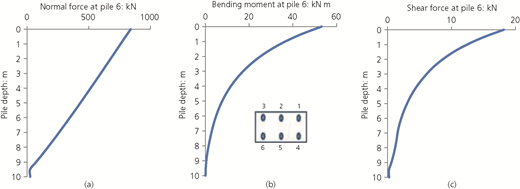
Internal forces at corner pile 6: (a) maximum normal force; (b) maximum bending moment; (c) maximum shear force
Internal forces at corner pile 6: (a) maximum normal force; (b) maximum bending moment; (c) maximum shear force
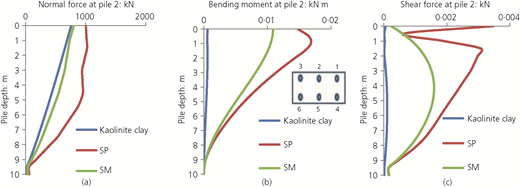
Effect of soil type
Soil type is one of the crucial factors that considerably alters the impact of crude oil contamination on geotechnical behaviour. To examine this effect, the model has been analysed for two additional types of uncontaminated soil. The parameters for these were obtained from experimental studies: poorly graded sand (SP) (Khamehchiyan et al., 2007) and silty sand (SM) (Hafshejani and Hajiannia, 2016). The characteristics of these soils are repeated here for convenience in Table 5.
Results and discussion
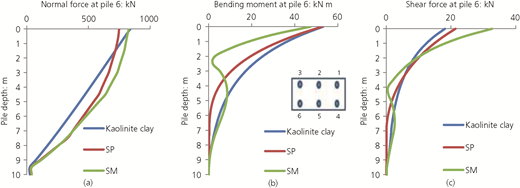
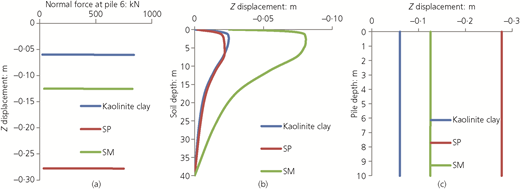
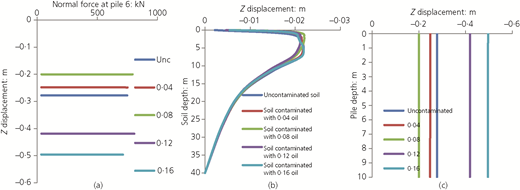
The internal forces (bending moment and shear and normal forces) induced in the piles are presented in Table 6 and Figures 4 and 5. These identify negligible bending moments and shear forces in the central piles, accompanied with considerable normal forces, with a maximum value Nmax = 1024 kN for poorly graded sand (SP), while the bending moment and the normal forces obtained in the corner piles have maximum values in kaolinite clay of Mmax = 53·09 kN m and Nmax = 839·3 kN, respectively. The peak shear force occurs in silty sand (SM) of Tmax = 32·73 kN. The central piles hold approximately 22% higher normal forces than that in the corner piles. In addition, the maximum internal forces occur in the upper part of the piles. In Figure 6, the maximum soil vertical displacement occurs in the upper quarter of kaolinite soil (Umax = 0·08 m), while the maximum vertical displacement of piles occurred in poorly graded sand (SP), with Umax = 0·28 m. Figure 6(a) shows the normal force load–displacement for the three types of soils. The highest bearing capacity occurs in the piles emplaced in kaolinite clay with a load of 839·3 kN with a displacement of about 0·08 m. The lowest bearing capacity was for SP soil with a load smaller by about 11% and a displacement three times greater. These results coincide with the difference in essential geotechnical characteristics between kaolinite clay (C = 146 kPa, φ = 8·1°) and poorly graded sand (SP) (C = 0 kPa, φ = 34·5°).
Response of a group of 2 × 3 piles for selected soils
| Soil type | Internal forces | |||||
|---|---|---|---|---|---|---|
| Corner piles | Central piles | |||||
| Nmax: kN | Tmax: kN | Mmax: kN m | Nmax: kN | Tmax: kN | Mmax: kN m | |
| Kaolinite clay | 839·3 | 18·15 | 53·09 | 758·1 | 0·00010 | 0·00056 |
| Poorly graded sand (SP) | 749·2 | 21·41 | 52·71 | 1024·0 | 0·00345 | 0·01680 |
| Silty sand (SM) | 827·1 | 32·73 | 47·30 | 802·6 | 0·00158 | 0·01089 |
Internal forces at central pile 2: (a) maximum normal force; (b) maximum bending moment; (c) maximum shear force
Internal forces at central pile 2: (a) maximum normal force; (b) maximum bending moment; (c) maximum shear force
Internal forces at corner pile 6: (a) maximum normal force; (b) maximum bending moment; (c) maximum shear force
Internal forces at corner pile 6: (a) maximum normal force; (b) maximum bending moment; (c) maximum shear force
Maximum displacements at corner pile 6: (a) maximum normal force plotted against displacement; (b) maximum soil displacement; (c) maximum pile displacement
Maximum displacements at corner pile 6: (a) maximum normal force plotted against displacement; (b) maximum soil displacement; (c) maximum pile displacement
Effect of contamination
In order to analyse the effect of contamination on the response of the soil–piles–bridge system, the calculations were carried out for a range of contamination ratios for the soils. These are 4, 8, 12 and 16% for SP and SM soils and 2, 5, 8, 10, 15 and 20% for kaolinite clay. The principal geotechnical properties of each type of soil for each examined ratio of contamination are presented in Tables 7–9.
Principal geotechnical properties of oil-contaminated poorly graded sand (SP) (Khamehchiyan et al., 2007)
| Contamination: % | C: kPa | φ: ° | Ψ: ° | ρ s: kg/m3 |
|---|---|---|---|---|
| 0 | 0 | 34·5 | 0 | 1830 |
| 4 | 3·922 | 32·0 | 0 | 1825 |
| 8 | 8·825 | 32·0 | 0 | 1820 |
| 12 | 7·845 | 29·0 | 0 | 1815 |
| 16 | 4·900 | 27·5 | 0 | 1810 |
Principal geotechnical properties of oil-contaminated silty sand (SM) (Hafshejani and Hajiannia, 2016)
| Contamination: % | C: kPa | φ: ° | Ψ: ° | ρ s: kg/m3 |
|---|---|---|---|---|
| 0 | 27·2 | 33·0 | 3·517 | 2156 |
| 4 | 19·5 | 32·9 | 3·398 | 2046 |
| 8 | 22·7 | 32·0 | 2·332 | 1998 |
| 12 | 21·0 | 26·2 | 0 | 1942 |
| 16 | 33·6 | 26·0 | 0 | 1860 |
Principal geotechnical properties of oil-contaminated kaolinite clay (Khosravi et al., 2013)
| Contamination: % | C: kPa | φ: ° | Ψ: ° | ρ s: kg/m3 |
|---|---|---|---|---|
| 0 | 146 | 8·1 | 0 | 1770 |
| 2 | 123 | 7·6 | 0 | 1820 |
| 5 | 121 | 6·3 | 0 | 1820 |
| 8 | 112 | 5·9 | 0 | 1830 |
| 10 | 111 | 4·4 | 0 | 1840 |
| 15 | 110 | 3·7 | 0 | 1690 |
| 20 | 96 | 3·9 | 0 | 1690 |
Results and discussion
POORLY GRADED SAND (SP)
The results of the numerical analysis for different oil-contamination ratios (4, 8, 12 and 16%) in poorly graded soil (SP) are presented in Table 10 and Figures 7–9. These results show, firstly, that the maximum internal forces (bending moment and normal force) induced in the corner piles occur for an oil-contamination ratio of 12% and, secondly, the maximum shear force is identified for uncontaminated soil. The maximum internal forces are obtained always in the upper portion of the piles. Figure 9 shows that the piles emplaced in contaminated soil with an 8% ratio exhibit the lowest displacement accompanied with a considerable load, while the highest load–displacement is for the soil with a 16% contamination ratio. These results are compatible with the geotechnical properties of SP soil presented in Table 7, where the cohesion significantly increases from zero for the uncontaminated soil to C = 7·845 kPa in the contaminated soil at 12% contamination ratio accompanied with a drop of about 19% in the angle of friction (from φ = 34·5 to 29·0). Similarly, the reduction in the load–displacement behaviour of the contaminated soil by 16% could be attributed to the sharp drop of the soil cohesion of 60% from C = 7·845 kPa for a contamination ratio of 12% to C = 4·9 kPa for a contamination ratio of 16%.
Internal forces induced in the group of (2 × 3) piles embedded in poorly graded sand (SP)
| Contamination: % | Internal forces | |||||
|---|---|---|---|---|---|---|
| Corner piles | Central piles | |||||
| N max: kN | T max: kN | M max: kN m | N max: kN | T max: kN | M max: kN m | |
| 0 | 749·2 | 21·41 | 52·71 | 1024·0 | 0·0034 500 | 0·0168 00 |
| 4 | 751·8 | 19·59 | 51·52 | 984·2 | 0·0021 900 | 0·0089 00 |
| 8 | 793·5 | 19·08 | 58·28 | 861·9 | 0·0010 290 | 0·0030 80 |
| 12 | 807·4 | 19·97 | 61·73 | 838·7 | 0·0001 813 | 0·0016 18 |
| 16 | 713·0 | 18·61 | 43·68 | 1057·0 | 0·0025 920 | 0·0055 21 |
Internal forces at central pile 2 embedded in SP soil: (a) maximum normal force; (b) maximum bending moment; (c) maximum shear force
Internal forces at central pile 2 embedded in SP soil: (a) maximum normal force; (b) maximum bending moment; (c) maximum shear force
Internal forces at corner pile 6 embedded in SP soil: (a) maximum normal force; (b) maximum bending moment; (c) maximum shear force
Internal forces at corner pile 6 embedded in SP soil: (a) maximum normal force; (b) maximum bending moment; (c) maximum shear force
Maximum displacements at corner pile 6 for SP soil: (a) maximum normal force plotted against displacement; (b) maximum soil displacement; (c) maximum pile displacement
Maximum displacements at corner pile 6 for SP soil: (a) maximum normal force plotted against displacement; (b) maximum soil displacement; (c) maximum pile displacement
SILTY SAND (SM)
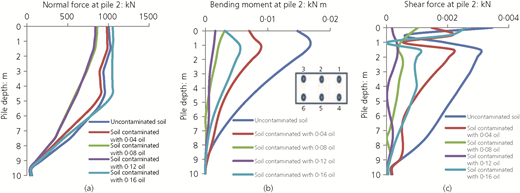
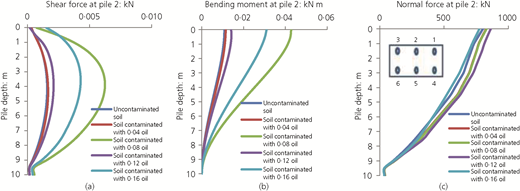
The results for silty sand are presented in Table 11 and Figures 10–12, these show the maximum shear and normal forces of T max = 43·85 kN and N max = 840·6 kN, respectively, and the load–displacement that has been attained in the corner pile for a contamination ratio of 16%. Likewise, the maximum soil and pile displacement also occur for a contamination ratio of 16%. These results are in agreement with the geotechnical properties of SM soil presented in Table 8, where the soil with a contamination ratio of 16% has the highest cohesion (C = 33·6 kPa) accompanied by decreasing angle of friction and density (by 22 and 16%, respectively). The maximum bending moment is obtained for a contamination ratio of 8%. The central piles hold the maximum normal forces (N max = 863·4) for a contamination ratio of 12%. Thus, comparing with the previous case of poorly graded sand (SP), the bending moment in the corner piles decreases by about 28·8%, while the shear forces increase significantly by 219%. However, the normal forces remain semi-constant with a slight increase of 1%. In contrast, the normal forces of the central piles reduce considerably by about 19%.
Internal forces induced in the group of 2 × 3 piles embedded in silty sand (SM)
| Contamination: % | Internal forces | |||||
|---|---|---|---|---|---|---|
| Corner piles | Central piles | |||||
| N max: kN | T max: kN | M max: kN m | N max: kN | T max: kN | M max: kN m | |
| 0 | 827·1 | 32·73 | 47·30 | 802·6 | 0·0015 80 | 0·01089 |
| 4 | 814·1 | 34·99 | 46·24 | 828·0 | 0·0016 64 | 0·01149 |
| 8 | 812·3 | 33·89 | 47·92 | 830·7 | 0·0062 35 | 0·04281 |
| 12 | 795·4 | 36·21 | 39·21 | 863·4 | 0·0020 98 | 0·01418 |
| 16 | 840·6 | 43·85 | 41·42 | 774·6 | 0·0042 83 | 0·03108 |
Internal forces at central pile 2 embedded in SM soil: (a) maximum normal force; (b) maximum bending moment; (c) maximum shear force
Internal forces at central pile 2 embedded in SM soil: (a) maximum normal force; (b) maximum bending moment; (c) maximum shear force
Internal forces at corner pile 6 embedded in SM soil: (a) maximum normal force; (b) maximum bending moment; (c) maximum shear force
Internal forces at corner pile 6 embedded in SM soil: (a) maximum normal force; (b) maximum bending moment; (c) maximum shear force
Maximum displacements at corner pile 6 for SM soil: (a) maximum normal force plotted against displacement; (b) maximum soil displacement; (c) maximum pile displacement
Maximum displacements at corner pile 6 for SM soil: (a) maximum normal force plotted against displacement; (b) maximum soil displacement; (c) maximum pile displacement
KAOLINITE CLAY
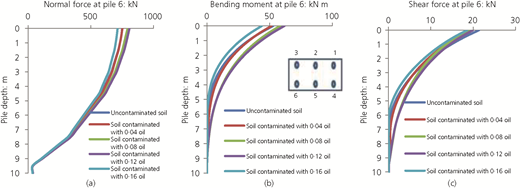
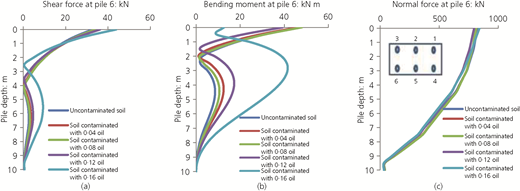
The results for kaolinite clay presented in Table 12 and Figures 13–15 show that the maximum internal force induced in the corner piles occurs for the highest contamination ratio of 20%. This result agrees with the robust geotechnical properties for that soil presented in Table 9 (C = 96 kPa, φ = 3·9, ρ s = 1690 kg/m3), where the cohesion, friction angle and density drop by 52, 207 and 4·7%, respectively. In addition, the maximum normal force in the central piles is obtained for the maximum contamination ratio of 20%, while the maximum bending moment and shear force are obtained at a 5% contamination ratio. Also, the profiles of the bending moment and shear forces obtained in all the piles are different, as uncontaminated soil, which has the maximum geotechnical properties, is present around the lower part of the piles. Considering the results of the three types of soil, the maximum shear and normal forces in the corner piles occur for the case of silty sand SM (T max = 43·85 kN and N max = 840·6 kN), and the maximum bending moment (M max = 61·73 kN m) occurs for poorly graded sand (SP). For the central piles, the maximum bending moment and shear force are obtained for kaolinite clay. The maximum normal forces are those of the central pile embedded in SP soil, with N max = 1057 kN. The maximum soil displacement is for SP soil, but the maximum pile displacement is for SM soil. The results of the effect of contamination on the internal forces induced in the piles in three types of soils, SP, SM and kaolinite clay, reveal – partly – a strong correlation with the major geotechnical properties of the soils (cohesion, angle of friction, angle of dilation and density). Nevertheless, this relationship does not reflect a clear trend, which could be explained by a number of factors, including the differential lubrication of particles, the mechanism of filling the soil voids and the limitations in multiphase flow causing uneven pressure distributions during the loading process.
Internal forces induced in the group of 2 × 3 piles embedded in kaolinite clay
| Contamination: % | Internal forces | |||||
|---|---|---|---|---|---|---|
| Corner piles | Central piles | |||||
| N max: kN | T max: kN | M max: kN m | N max: kN | T max: kN | M max: kN m | |
| 0 | 839·3 | 18·15 | 53·09 | 758·1 | 0·0001 000 | 0·0005 60 |
| 2 | 822·5 | 17·79 | 51·09 | 797·1 | 0·0009 830 | 0·0014 30 |
| 5 | 815·9 | 17·73 | 50·57 | 810·2 | 0·0069 450 | 0·0473 50 |
| 8 | 809·8 | 17·78 | 50·37 | 821·5 | 0·0041 730 | 0·0277 00 |
| 10 | 809·8 | 17·66 | 49·85 | 820·8 | 0·0014 250 | 0·0049 37 |
| 15 | 810·0 | 17·54 | 49·30 | 823·6 | 0·0009 981 | 0·0034 59 |
| 20 | 804·9 | 17·52 | 48·31 | 834·1 | 0·0009 660 | 0·0046 93 |
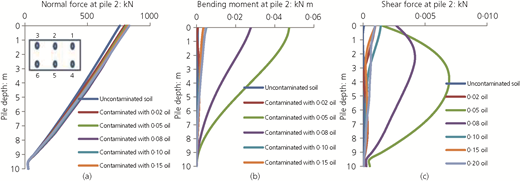
Internal forces at central pile 2 embedded in kaolinite clay: (a) maximum normal force; (b) maximum bending moment; (c) maximum shear force
Internal forces at central pile 2 embedded in kaolinite clay: (a) maximum normal force; (b) maximum bending moment; (c) maximum shear force
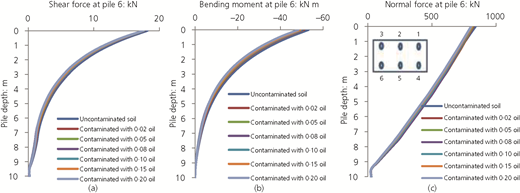
Internal forces at corner pile 6 embedded in kaolinite clay: (a) maximum normal force; (b) maximum bending moment; (c) maximum shear force
Internal forces at corner pile 6 embedded in kaolinite clay: (a) maximum normal force; (b) maximum bending moment; (c) maximum shear force
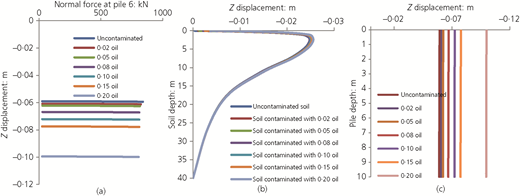
Maximum soil and pile displacements at corner pile 6 for kaolinite clay: (a) maximum normal force plotted against displacement; (b) maximum soil displacement; (c) maximum pile displacement
Maximum soil and pile displacements at corner pile 6 for kaolinite clay: (a) maximum normal force plotted against displacement; (b) maximum soil displacement; (c) maximum pile displacement
Effect of contamination depth
In order to analyse the effect of oil-contamination depth in the soil, analyses were carried out on oil-contaminated kaolinite clay soil with 10% contamination and for various contamination depths (S = 3, 6, 9, 10, 20, 30 and 40 m).
Results and discussion
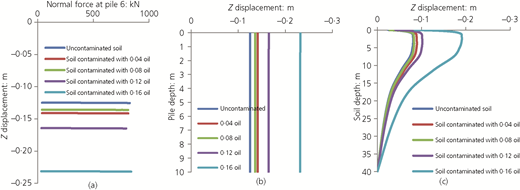
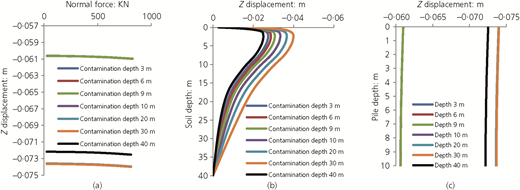
The results are presented in Table 13 and Figures 16 and 17. These show that there is a limited effect of the contamination depth on the internal forces in the piles, particularly the internal forces in the corner piles (bending moment and normal forces) for a contamination depth smaller than the pile height (S = 3, 6 and 9 m). These are greater for contamination depths of S = 10, 20, 30 and 40 m by about 2% for the normal force and about 4% for the bending moment, which could be attributed to the frictional behaviour of the piles and partly to the dominant effect of the upper portion of the piles, where the maximum internal forces occur. Figure 18 shows that the highest bearing capacity is identified for a contamination depth smaller than the pile height (S = 3, 6 and 9 m) with a maximum displacement of the pile of Umax = 0·06 m and a maximum normal force of Nmax = 825·5 kN. In contrast, the highest load–displacement was for the higher contamination depths (S = 30 and 40 m), which could be explained by the effect of the contamination depth on the end-bearing capacity under the pile and the regression of load distribution in the lower layers with the degradation of contaminated soil properties. It is worth mentioning that the maximum internal forces are obtained for the upper part of the piles. Moreover, the behaviour of piles embedded in oil-contaminated soils involves a complex interaction between the piles and the surrounding contaminated soil. Nevertheless, these numerical results provide a useful basis for further research, leading to an increased understanding of the behaviour of piles embedded in oil-contaminated soils.
Internal forces induced in the group of 2 × 3 piles embedded in kaolinite clay
| Contamination depth: m | Internal forces | |||||
|---|---|---|---|---|---|---|
| Corner piles | Central piles | |||||
| Nmax: kN | Tmax: kN | Mmax: kN m | Nmax: kN | Tmax: kN | Mmax: kN m | |
| 3 | 825·5 | 17·85 | 51·49 | 791·1 | 0·0015 14 | 0·0025 64 |
| 6 | 825·4 | 17·85 | 51·48 | 791·4 | 0·0010 72 | 0·0082 75 |
| 9 | 825·5 | 17·85 | 51·51 | 791·0 | 0·0019 08 | 0·0155 40 |
| 10 | 810·8 | 17·60 | 49·74 | 822·6 | 0·0030 20 | 0·0194 40 |
| 20 | 810·8 | 17·53 | 49·58 | 822·5 | 0·0067 02 | 0·0452 40 |
| 30 | 810·8 | 17·47 | 49·57 | 822·3 | 0·0087 83 | 0·0611 00 |
| 40 | 809·8 | 17·66 | 49·85 | 820·8 | 0·0014 25 | 0·0049 37 |
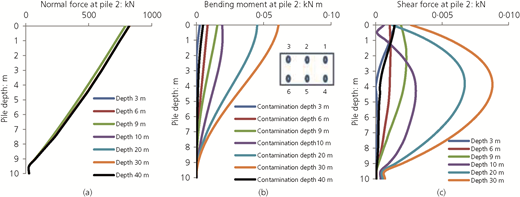
Internal forces at central pile 2: (a) maximum normal force; (b) maximum bending moment; (c) maximum shear force
Internal forces at central pile 2: (a) maximum normal force; (b) maximum bending moment; (c) maximum shear force
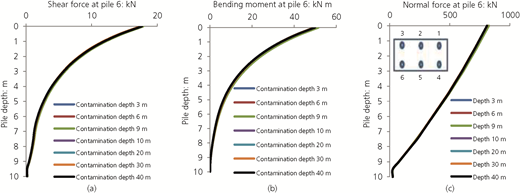
Internal forces at corner pile 6: (a) maximum normal force; (b) maximum bending moment; (c) maximum shear force
Internal forces at corner pile 6: (a) maximum normal force; (b) maximum bending moment; (c) maximum shear force
Maximum displacements at corner pile 6: (a) maximum normal force plotted against displacement; (b) maximum soil displacement; (c) maximum pile displacement
Maximum displacements at corner pile 6: (a) maximum normal force plotted against displacement; (b) maximum soil displacement; (c) maximum pile displacement
Conclusions
In general, hydrocarbon contamination is a global issue; remediation is increasingly required, as growth in global population and environmental concerns require the development of brownfield sites. However, construction on contaminated soils is also a geotechnical problem. This and other studies indicate that the properties of soils can be greatly altered by the presence of subsurface contamination. This will influence the design and maintenance of structures built on such soils. The following conclusions are reported based on these numerical analyses.
Oil contamination has a degradative effect on the geotechnical behaviour of a bridge piles foundation, which is reflected by the considerable change in the internal forces in the piles and the displacement of the soil and the piles.
The variation of oil-contamination intensity in the soil changes the induced internal forces in the piles by ratios up to 40, 34 and 20% of the bending moment, the shear forces and the normal forces, respectively. Moreover, the alterations in the displacements of the soil and the piles are more important, with ratios up to 150%; so consequently, this impacts on the settlement serviceability limit state and therefore the cost of the foundation. There is no clear constant relation between the increase in oil-contamination percentage and both foundation behaviour indicators (internal forces of the piles and displacements), which could be explained by a number of factors, such as the mechanism of filling the soil voids, the differential lubrication of particles and the limitations in multiphase flow causing uneven pressure distributions during the loading process.
Finally, the oil-contamination depth has a limited effect on the internal force of the piles, which could be attributed to the frictional behaviour of the piles and partly to the dominant role of the upper portion of the piles. In contrast, oil-contamination depth has a more dominant effect on the displacement of the soil below the piles.
Undoubtedly, there are a considerable number of soil, oil and structural parameters involved in the study of such a geo-environmental problem. This 3D numerical modelling work tried to capture and analyse some of the important elements of the problem. The results of the current study could serve as a first-order estimate of the geotechnical effect of oil contamination.
