


Cement-treated sand (CTS) is widely used to construct earth structures (dam, road sub-base, retaining wall etc.) due to economy and comparatively easier application. Nevertheless, the mechanical properties of CTS can be affected by the repetitive wetting–drying conditions during the design life. The situation may be exacerbated in a saline or coastal zone, as salinity has the potential to affect the strength of CTS. In this study, the effects of different exposure cycles – namely, air-drying and water submergence – on the mechanical behaviour of lightly CTS were studied at two different concentrations of salinity (0.1 M and 1.0 M sodium chloride (NaCl) solution). The unconfined compressive strength (UCS) was evaluated at the end of each cycle, and the results were compared with those under unweathered conditions. The UCS of CTS increased up to three cycles and reduced in the proceeding cycles irrespective of salinity concentrations. The maximum strength increase and decrease for specimens subjected to 0.1 M salinity were 19 and 25%, respectively, with respect to those for specimens under unweathered conditions. However, at the higher concentration (1 M), the strength increased about 12% and a 19% strength reduction was observed. In general, the CTS showed higher strength at 0.1 M salinity concentration compared with that at 1 M salinity concentration at a fixed cycle.
Notation
- Cc
coefficient of curvature
- Cu
coefficient of uniformity
- D60
particle diameter corresponding to 60% finer
- D30
particle diameter corresponding to 30% finer
- D10
particle diameter corresponding to 10% finer
- E50
secant modulus
- qu
peak unconfined compressive strength
- qu,28
peak unconfined compressive strength at 28 days curing
maximum dry density
- ωopt
optimum moisture content
Introduction
Cement is extensively used to improve the engineering properties of granular soils, as cement is highly capable of binding soil particles through pozzolanic chemical reactions. Nowadays, cement-mixed sand and gravel (CGS) is widely used for the construction of earth structures, such as embankments, dams, road sub-base and railroads. The CGS ground-improvement technology reduces the construction time and earth structure sections; it also makes the construction economic (Hirose et al., 2003; Kim et al., 2005). In general, the water/cement ratio, the cement/soil ratio and curing conditions (e.g. curing temperature, curing time, curing methods, curing water quality and moisture condition) affect the mechanical behaviour of cemented granular soils (Park, 2010).
Many researchers have investigated the strength and deformation characteristics of cement-treated soils considering all these factors. For instance, the compressive strength of artificially stabilised cemented sand increases with the increase in cement amount, whereas failure strain decreases (Consoli et al., 2007; Das et al., 1995; Horpibulsuk, 2012). Cemented sand shows a substantial increase in volumetric strain and associated strength gain even at higher strain due to the redistribution of the force chain to a thick columnar shape compared with that under uncemented conditions (Ismail et al., 2002a, 2002b; Wang and Leung, 2008). In addition, many researchers have reported that the porosity of artificially stabilised cemented soil significantly affects its strength and stiffness. With the addition of cement content, the porosity decreases due to the formation of amorphous products, resulting in increased strength of artificially stabilised cemented soil (Clough et al., 1981; Consoli et al., 2006, 2007, 2009; Felt, 1955; Ingles and Metcalf, 1972; Ismail et al., 2002a, 2002b). On the other hand, the strength of cement-stabilised soil decreases with the increase in water/cement ratio (Horpibulsuk et al., 2003; Trabelsi et al., 2018). Moreover, the peak strength, pre-peak stiffness, Young’s modulus and shear modulus of cement-mixed sandy soils increased with the increase in curing time as well as curing stress (Kang et al., 2017; Kongsukprasert et al., 2007; Rabbi et al., 2011).
Furthermore, the quality of water used for the preparation of cement-mixed specimens as well as for curing affects the strength of the stabilised soil. Generally, in the laboratory, most often, distilled water is used for the preparation and curing of cement-mixed soils, but the presence of salinity has the potential to alter the intrinsic properties. The study conducted by Deng et al. (2018) on artificial soft clays (a mixture of kaolin and bentonite) showed that the presence of salinity in the pore water affects the intrinsic compression behaviour (i.e. compression index, void ratio etc.), which was significantly different from the characteristics proposed by Burland (1990) for normally consolidated natural soft clays. Park and Lee (2012) reported that cemented sand with a cement-to-sand ratio from 4 to 20% showed relatively higher compressive strength when samples were cured in distilled water compared with the case when the samples were cured with seawater. The effect of sodium chloride (NaCl) on the strength and stiffness of marine clay was investigated by Zhang et al. (2013). It was reported that although cement significantly enhanced the strength properties of marine clay, an increase in salt concentration significantly reduced the strength and stiffness properties, particularly at low cement contents. The reduction in unconfined compression strength with the increase in salt concentration was also reported by Zhang et al. (2014) for cement-stabilised clay. Intensified brittle fractures were observed with increasing salt content for gravelly pavement materials (Carteret et al., 2014). Xing et al. (2009) worked with a different type of salinities (magnesium (Mg2+), chloride (Cl−) and sulfate (SO42−)) in soft clay and confirmed that the unconfined compressive strength of salt-rich soil-cement decreases with the curing time, and the concentration of chloride ions was found to have the most detrimental effect on the short- and long-term performance.
Cui et al. (2016) reported the deterioration of soil cement piles in saltwater regions. It was emphasised that the formation of the ettringite compound in the pore space enhances the strength at the primary stage but a large amount of ettringite eventually leads to volume expansion and cracking, causing long-term strength reduction. Furthermore, the compressive strength of soil-cement piles exposed to a saline environment dropped about 18.5 and 21.6% after 90 and 180 days, respectively, when compared with that of normal soil cement cases (Cui et al., 2013). Kitazume et al. (2003) also reported the reduction in the long-term strength of cement-treated soil exposed to seawater.
Acknowledging the potentially detrimental effect of salinity, the application of saline-free tap water is a general practice in soil-improvement projects (Croce et al., 2014). However, the associated cost of tap water and availability at the project site are some of the key concerns. Furthermore, in actual construction sites, the curing conditions could differ from controlled laboratory conditions. Also, the water table may rise or subside due to seasonal effects (rain, flood etc.) or other reasons. For instance, the treated soil-soil may be subjected to alternating wetting and drying conditions and the water may also have salinity, which can affect the mechanical and chemical behaviour of such soils. When the groundwater table escalates and comes in contact with the treated soil/soil, the soil becomes soaked. On the other hand, when the groundwater table drops, the treated soil/soil experiences dry conditions. The process of repetitive drying and wetting conditions may eventually affect the properties of cemented sand. For instance, Park (2010) reported that the strength of cement-treated sand (CTS) increases up to three cycles of repetitive wetting and drying, and afterwards the strength either becomes stable or marginally decreases. Furthermore, the effects of repetitive drying and wetting cycles on the mechanical behaviour of cemented soils may be exacerbated if salinity is present in the groundwater (Park, 2010).
The salinity problem is tremendous in the coastal zone of Bangladesh, which encompasses about 32% of the country (MoWR, 2005). In these regions, the salinity of groundwater, as well as salinity-affected areas, is increasing day by day due to rapid urbanisation, seasonal flooding during the rainy season, lateral movement of salinity in groundwater during the dry season, excessive groundwater extraction relating to agricultural activities, inundation with saline water by shrimp industries, global warming effects and so on (Ahmed et al., 2007; Habiba et al., 2013; Selvam et al., 2013). The intrusion of seawater is one of the major reasons for the salinity increase in groundwater and soil (Bahar and Reza, 2010; Didar-Ul Islam et al., 2015). According to the Soil Resources Development Institute (SRDI, 2010), in the year 1973, the salinity-affected land was only about 8330 km2, which escalated to 10 560 km2 in 2009. In recent times, about 53% of the coastal areas of Bangladesh are affected by different degrees of salinity (Hoque et al., 2003; Woobaidullah et al., 2006). Therefore, the ground improved using cement in these regions is likely to be affected by salinity shortly. Hence, the main focus of this study is to investigate the effects of salinity on the strength and deformation characteristics of cement-mixed local sand under repetitive wetting and drying cycles at two different salinity concentrations.
Materials and experimental methodology
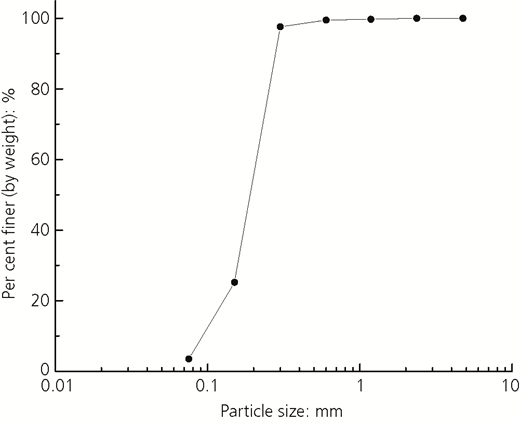
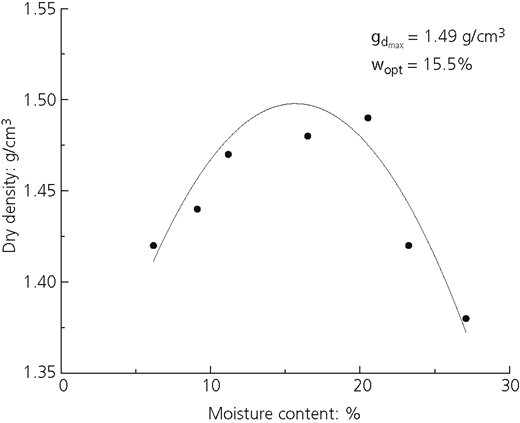
In the present study, laboratory-produced CTS specimens were considered for the investigation. Local sand with a fineness modulus of 0.78 (according to ASTM C 136 (ASTM, 2019)) was used to represent the local soil condition in the south-west coastal zone of Bangladesh. The gradation curve of the sand is shown in Figure 1, and the particle size range falls between 1.180 and 0.075 mm. The index properties of the sand used in this study are shown in Table 1. The coefficient of uniformity (Cu) value was obtained as 2.33, which is less than 6, and the coefficient of curvature (Cc) value as 1.35, which is greater than 3 (Table 1). Therefore, according to the Unified Soil Classification System (USCS), the soil can be classified as SP (poorly graded sand). Furthermore, the optimum moisture content of the sand was obtained as 15.5% (which was used to maintain the mixing water content) with a maximum dry density of 1.49 g/cm3 using the standard Proctor test (as per ASTM D 698 (ASTM, 2012)). Figure 2 presents the compaction curve of the sand.
Index properties of local sand used in the study
| Density: g/cm3 | Fineness modulus | D60: mm | D30: mm | D10: mm | Cu | Cc | USCS classification |
|---|---|---|---|---|---|---|---|
| 1.49 | 0.78 | 0.21 | 0.16 | 0.09 | 2.33 | 1.35 | SP |
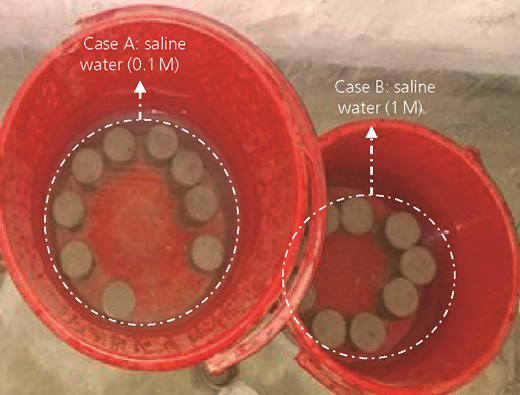
Ordinary Portland cement (type I) was used in the present study as a cementing material. To maintain the integrity of the mechanical and chemical properties, the cement bag was kept under airtight conditions after opening. In the coastal region of Bangladesh, researchers reported that the maximum saline concentration of groundwater is about 0.1 M (Islam et al., 2017). Therefore, 0.1 M salinity concentration was rationally selected based on the existing groundwater salinity concentration. Considering the time frame of the study and to accelerate the deteriorating criteria of the CTS, the existing salinity concentration was increased ten times to investigate the extreme case. Commercially available inorganic sodium chloride salt was used with tap water to produce saline water of two different concentrations – namely, 0.1 and 1.0 M (herein designated as case A and case B, respectively).
The slenderness ratio is an important parameter that influences the stress–strain characteristics of CTS samples. In general, a decrease in the slenderness ratio linearly increases the strength of samples, but the reduction of the slenderness ratio below 0.75 results in a non-linear increase in strength (Abdulla and Kiousis, 1997). In this study, the slenderness ratio of the CTS specimen was taken as 2.0 and a locally available poly(vinyl chloride) pipe with a diameter of 50 mm and a height of 100 mm was used as the mould to prepare the specimen. The selection of the appropriate cement content for soil-stabilisation projects is of utmost priority for cost optimisation. Different researchers have worked with a variety of cement contents on different types of soil to unveil their dependency. For instance, Åhnberg et al. (2003) investigated the effect of different cementing agents (lime, cement, fly ash, blast-furnace slag etc.) on Swedish clay. Based on extensive laboratory research, it was concluded that the optimum binder content depends primarily on the type of soil under consideration. Terashi et al. (1980) observed that a minimum 5% cement is necessary to obtain an improvement effect on Kawasaki clay regardless of the curing period. Estabragh et al. (2019) utilised different cement contents (5, 8 and 10% by weight) to observe the behaviour of clayey soil deposited in saline water. Treating the soil with cement significantly improved the strength properties even at a lower percentage of 5%. Horpibulsuk et al. (2006) observed a rapid increase in the unconfined compressive strength of cement-stabilised soil for cement content up to 7%. A further increase in cement content (in the range 7–18%) resulted in insignificant improvement or no improvement at all. After that, with the increase in cement content (up to 30%), unconfined compressive strength increased almost linearly. The incorporation of cement also improves the compaction properties of soil. In the case of high-plasticity silty clay, the addition of 3–10% cement yielded similar improvement properties for the dry unit weight, as reported by Horpibulsuk et al. (2010). According to the Portland Cement Association (PCA, 1995), for silty or clayey gravel and sand, 5–9% cement (by weight) is recommended for soil-improvement projects. In view of these findings, in the present study, the cement content was carefully chosen as 5% sand (in weight proportions) to simulate soil cementation. CTS specimens were prepared in accordance with the Japanese Geotechnical Society Standard (JGS 0811-2009: Practice for making and curing compacted stabilised soil specimens using a rammer (JGS, 2009)). Initially, the sand was kept in an oven for 24 h at 105°C to remove natural moisture. The sand and cement were thoroughly mixed manually in a dry state according to the mix proportion (as mentioned in Table 2) with proper care to avoid non-uniformity of the mixture. Then, tap water was added uniformly to prepare a homogeneous mixture of sand–cement–water for one specimen. In this study, the optimum moisture content was used to prepare the specimen in order to maintain consistency in specimen preparation. Hand-mixing tools were used for mixing.
Afterwards, the mixture was divided into three equal portions and compacted statically in the mould in three layers so that each layer reached the specified dry density. After one layer had been compacted, the top surface was scratched before adding another layer to confirm better adhesion. Grease was used as a lubricant at the inner surface of the mould for reducing friction between the sample and mould. After preparation, the specimen-filled mould was kept in the air for initial curing for 3 days while keeping the top surface covered in controlled room temperature. Later, the sample was removed from the mould with the help of a sample ejector machine and further cured underwater.
Curing condition
It is well recognised that the strength of concrete depends on the curing temperature, curing time and curing method. Insufficient water supply affects the hydration process and bond strength of cemented sand (Park et al., 2009). Furthermore, temperature affects the strength during the curing process of the sample. A high temperature increases the initial strength but decreases the final strength (Price, 1951). Simultaneous changes in mixing and curing temperature have been reported to affect the concrete strength along with low-humidity conditions (Cebeci, 1987). The strength of cemented sand has shown dependency on the wetting–drying condition of the curing period (Park, 2010). In this study, the sample was initially air-cured for 3 days for gaining sufficient strength to resist slaking or debonding when cured under distilled water for the next 25 days. In the present study, distilled water curing was only conducted to establish a standard database with which the saline cases can be compared.
Wetting and drying conditions
After 28 days of curing, the specimens were removed from the container and dried at room temperature for 7 days. In order to evaluate the effect of the saline concentration, the samples were divided into two batches and soaked in two different saline water concentrations (0.1 and 1.0 M) for another 7 days. In this study, one cycle (denoted as C in the proceeding sections) is defined as the time period required to produce 1 week wetting and 1 week drying of the sample while considering 28 days of curing as the reference. This process was repeated simultaneously, and unconfined compression tests were conducted regularly as per the test schedule. Figure 3 shows the soaking condition of samples in two different saline environments.
After completion of the targeted wetting–drying cycles, the specimens were removed from the container and dried with an absorbent cloth. Afterwards, the dimension and weight were measured to identify the variation in physical properties owing to the wetting–drying cycles. A conventional unconfined compression apparatus was used for testing. Displacement dial gauges were used for the measurement of the load and axial displacement. Figure 4 presents the apparatus and testing condition utilised in the present study.
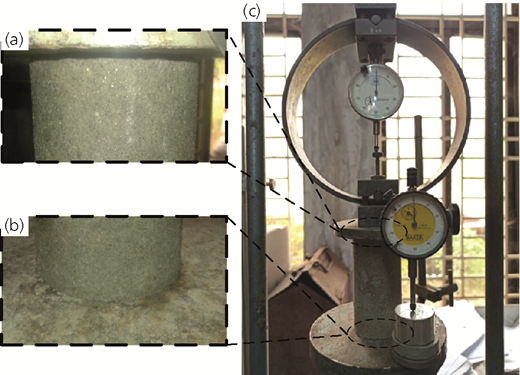
Testing condition of CTS: magnified views of CTS specimen at the (a) top and (b) bottom ends; (c) instrumental set-up
Testing condition of CTS: magnified views of CTS specimen at the (a) top and (b) bottom ends; (c) instrumental set-up
Sample curing with blue vitriol
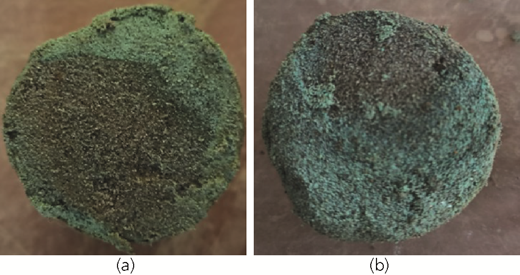
The permeability of the CTS is comparatively lower than that of uncemented sand due to the discontinuous intergranular channel and continuous bonding developed during the hydration process but not perfectly impervious at a low percentage of cement content (Quang and Chai, 2015; Yang et al., 2012). Moreover, the permeability characteristics of a specimen may vary due to the preparation technique. As the infiltration of the saline solution into the specimen is essential for the present study and for better understanding the permeable nature of the specimen, one specimen was kept in blue vitriol solution after 28 days of curing. Hypothetically, the intrusion of the saline solution should propagate inwards from the periphery characterised by the formation of two different colour zones – namely, bluish shade (penetrated zone) and ordinary sample colour (zone not yet penetrated). Figure 5 presents a specimen top (cut at the one-third height at each time period) submerged under blue vitriol solution for 30 and 60 days. From this figure, it is clear that at 60 days, the penetration range is higher compared with that at 30 days of curing, and it is expected that the saline solution will continue to permeate inwards over time provided that other parameters remain the same.
Effect of repetitive drying and wetting cycles on CTS
Unconfined compression tests have conventionally been conducted to determine the unconfined compression strength of cement-treated soil. It measures the maximum axial stress or peak strength that a sample can withstand at a specified strain rate of 0.5–2.0%/min as specified by ASTM D 2166 (ASTM, 2016). Similarly, in the present study, to evaluate the effects of salinity concentration on the strength and deformation characteristics of CTS specimens at different drying–wetting cycles, six sets of unconfined compression tests (after 28 days of curing) under monotonic loading conditions at a fixed strain rate were conducted on samples at the end of each cycle. For each cycle (C), two specimens were tested under similar testing conditions and the average value was taken as the unconfined compressive strength and other related parameters (moisture content, peak axial strain, stiffness etc.). It needs to be clarified that at zero cycles or after the completion of 28 days of curing, two additional samples were tested in a similar manner to set up the initial saline-free database for comparison. Furthermore, for better understanding, specimens tested at different cycles are herein labelled with a unique identification number, CnTm, where n denotes the number of cycles and m denotes the test number. Table 3 presents the different test conditions adopted in the present study, where the number inside the parentheses refers to the wetting period in days.
Summary of different test conditions for both cases A and B
| Specimen ID | Initial curing condition: days | Wetting and drying after initial curing: days | Number of cycles | |
|---|---|---|---|---|
| Mould curing | Water curing | Drying period + (wetting period) | ||
| C0T1, C0T2 | 3 | 25 | 0 + (0) | 0 |
| C1T1, C1T2 | 3 | 25 | 7 + (7) | 1 |
| C2T1, C2T2 | 3 | 25 | 7 + (7) + 7 + (7) | 2 |
| C3T1, C3T2 | 3 | 25 | 7 + (7) + 7 + (7) + 7 + (7) | 3 |
| C4T1, C4T2 | 3 | 25 | 7 + (7) + 7 + (7) + 7 + (7) + 7 + (7) | 4 |
| C5T1, C5T2 | 3 | 25 | 7 + (7) + 7 + (7) + 7 + (7) + 7 + (7) + 7 + (7) | 5 |
| C6T1, C6T2 | 3 | 25 | 7 + (7) + 7 + (7) + 7 + (7) + 7 + (7) + 7 + (7) + 7 + (7) | 6 |
Effect of repetitive drying and wetting on the peak strength and stiffness of CTS
Figures 6(a)–6(f) present the variation of the stress–strain response of CTS at different saline exposure cycles. From these figures it is evident that during the initial stages (cycles 1– 3), the samples subjected to case A showed greater strength and stiffness than those subjected to case B, while the peak strength continued to increase for both cases. In addition, clear and distinct shear band formation was witnessed; specimen failure characteristics were sudden or brittle, as evident in Figure 7. However, at prolonged exposure or higher cycles, the relationships became almost identical, with the peak strength and stiffness of the samples declining drastically for both cases.
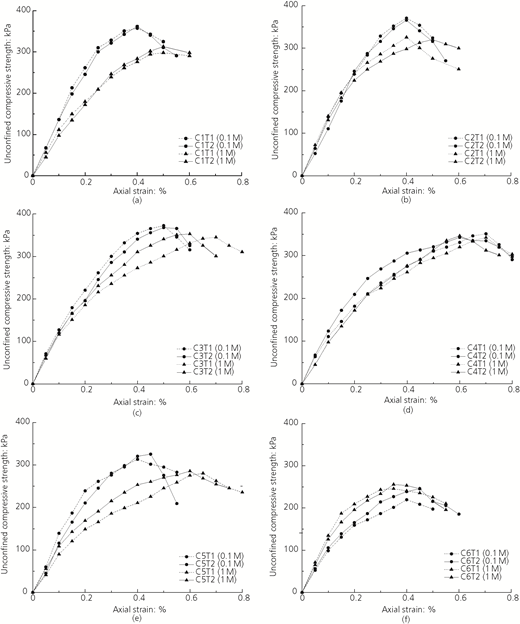
Effect of dry–wet cycles on the stress–strain relationship of CTS: (a) cycle 1; (b) cycle 2; (c) cycle 3; (d) cycle 4; (e) cycle 5; (f) cycle 6
Effect of dry–wet cycles on the stress–strain relationship of CTS: (a) cycle 1; (b) cycle 2; (c) cycle 3; (d) cycle 4; (e) cycle 5; (f) cycle 6
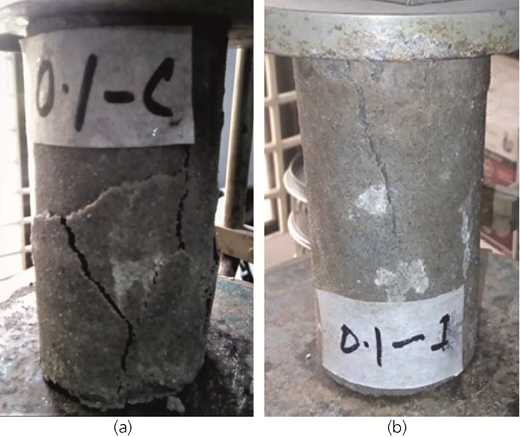
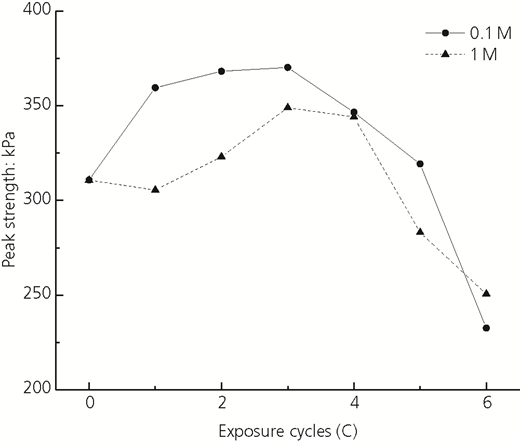
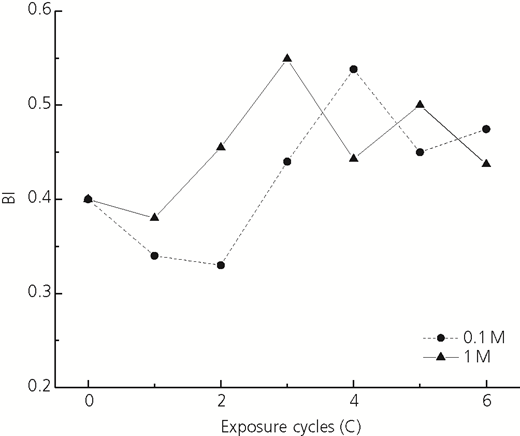
Figure 8 presents the variation of peak strength properties with the increase in exposure cycles. The maximum and minimum average peak strengths for case A were observed as 370.2 and 232.5 kPa at the third and sixth cycles, respectively, which denotes that the maximum strength increased and decreased by about 19 and 25% with respect to the initial condition of zero cycle. For case B, strength increased by about 12%, whereas 19% strength decrement was observed. The peak strength increased up to the third cycle irrespective of the curing environment, representing continued strength gain over time. However, at higher cycles, peak strength continued to decrease almost in a similar manner (for both case A and case B), showing the negative effect of drying–wetting cycles on the strength properties of CTS. The strength of CTS samples was higher for soaking in the lower saline concentration and vice versa. Such finding agrees well with the experimental outcomes of Zhang et al. (2013), Horpibulsuk et al. (2012), Kang et al. (2017), Zhang et al. (2014), Xing et al. (2009) and others for a variety of soil types. The post-peak stress–strain response became relatively ductile for both cases A and B after the intermediate cycles (cycles 2–4). In order to quantify such behaviour, the brittleness index (BI) was also determined at different exposure cycles based on strain analysis and is shown in Figure 9. The details of the analysis process can be found in the paper by Zhang et al. (2016). For case A (0.1 M), the BI index varied from 0.34 to 0.47, and for case B (1 M), it varied from 0.38 to 0.43. From Figure 9, it can be identified that the BI value of specimens fluctuated throughout the exposure cycles. However, after the initial cycles, the BI increased reasonably, and in the later cycles, a significant reduction was also observed. This phenomenon rationally follows the increasing and decreasing trend of the peak strength properties (Figure 8) as obtained from unconfined compression tests.
Tables 4 and 5 present the statistical analyses of the peak unconfined compressive strength data obtained from different testing conditions. From these tables, it can be clearly observed that undesirable variations in test results are marginal, which ensures the repeatability of the tested data of unconfined compressive strength.
Statistical analysis of unconfined compressive strength (case A)
| Number of cycles | Specimen ID | Maximum value: kPa | Minimum value: kPa | Average value: kPa | Standard deviation: kPa | Absolute variation: kPa |
|---|---|---|---|---|---|---|
| 0 | C0T1, C0T2 | 325.8 | 295.6 | 310.7 | 15.1 | 30.2 |
| 1 | C1T1, C1T2 | 361.6 | 357.4 | 359.5 | 2.1 | 4.2 |
| 2 | C2T1, C2T2 | 370.6 | 365.8 | 368.2 | 2.4 | 4.8 |
| 3 | C3T1, C3T2 | 372.6 | 367.8 | 370.2 | 2.4 | 4.8 |
| 4 | C4T1, C4T2 | 350.8 | 342.4 | 346.6 | 4.2 | 8.4 |
| 5 | C5T1, C5T2 | 325.4 | 313.2 | 319.3 | 6.1 | 12.2 |
| 6 | C6T1, C6T2 | 245.6 | 219.5 | 232.6 | 13.1 | 26.1 |
Statistical analysis of unconfined compressive strength (case B)
| Number of cycles | Specimen ID | Maximum value: kPa | Minimum value: kPa | Average value: kPa | Standard deviation: kPa | Absolute variation: kPa |
|---|---|---|---|---|---|---|
| 0 | C0T1, C0T2 | 295.6 | 325.8 | 310.7 | 15.1 | 30.2 |
| 1 | C1T1, C1T2 | 312.9 | 297.9 | 305.4 | 7.5 | 15.0 |
| 2 | C2T1, C2T2 | 325.7 | 320.4 | 323.1 | 2.6 | 5.3 |
| 3 | C3T1, C3T2 | 352.9 | 345.0 | 349.0 | 3.9 | 7.9 |
| 4 | C4T1, C4T2 | 346.0 | 342.1 | 344.1 | 2.1 | 4.1 |
| 5 | C5T1, C5T2 | 285.6 | 280.5 | 283.1 | 2.4 | 4.9 |
| 6 | C6T1, C6T2 | 255.6 | 245.6 | 250.6 | 5.0 | 10.0 |
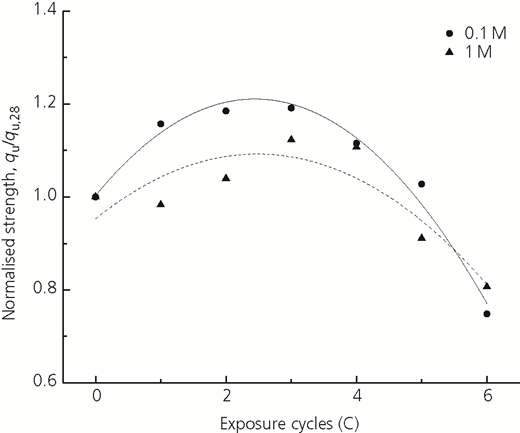
To illustrate the normalised variation of the strength and stiffness properties of CTS, peak unconfined compressive strength and stiffness of each specimen was normalised with respect to the values obtained at 28 days of curing (samples that are unaffected by salinity or unweathered conditions). From Figure 10, it can be observed that irrespective of different saline concentrations during the first three cycles, the peak strength increased about 20% when the samples were soaked in the lower saline concentration (0.1 M), whereas for the higher concentration (1 M), the increment was limited to 10%. However, at prolonged exposure to salinity, a peak strength reduction was eminent for all cases.
Figures 11 and 12 present the variation of stiffness (secant modulus, E 50) of CTS specimens at different saline exposure cycles. The stiffness or secant modulus (E 50) was determined from the slope of the stress–strain curve of the unconfined compression test corresponding to 50% of the unconfined compressive strength. In general, the secant modulus of elasticity (E 50) or stiffness increased at the early stages with the increase in strength, but as time progressed, it continued to decrease with one exception at cycle 6 for the sample subjected to case B. The modulus of elasticity (E 50) varied from 76.5 to 136.4 MPa and 86.6 to 132.1 MPa for case A (0.1 M) and case B (1 M), respectively. The normalised secant modulus was calculated based on the values obtained at 28 days of curing and is shown in Figure 12. The maximum increment and reduction in the modulus of elasticity (E 50) were observed to be 32 and 24%, respectively, for case A (0.1 M). Similarly, samples related to case B showed a maximum increment of 31% in the modulus of elasticity and a maximum reduction of 15%. The reduction in the stiffness of CTS samples was higher for soaking in the greater saline concentration and vice versa. Zhang et al. (2013) also observed a higher percentage of modulus of elasticity loss at a higher salt concentration. Tables 6 and 7 present the statistical analyses of the stiffness data obtained from different testing conditions.
Statistical analysis of secant modulus of elasticity (E 50) (case A)
| Number of cycles | Specimen ID | Maximum value: MPa | Minimum value: MPa | Average value: MPa | Standard deviation: MPa | Absolute variation: MPa |
|---|---|---|---|---|---|---|
| 0 | C0T1, C0T2 | 102.3 | 98.5 | 100.4 | 1.9 | 3.8 |
| 1 | C1T1, C1T2 | 140.5 | 132.3 | 136.4 | 4.1 | 8.2 |
| 2 | C2T1, C2T2 | 132.4 | 121.9 | 127.1 | 5.2 | 10.4 |
| 3 | C3T1, C3T2 | 116.4 | 102.2 | 109.3 | 7.1 | 14.3 |
| 4 | C4T1, C4T2 | 111.4 | 92.3 | 101.9 | 9.6 | 19.1 |
| 5 | C5T1, C5T2 | 130.5 | 108.5 | 119.5 | 11.0 | 22.1 |
| 6 | C6T1, C6T2 | 91.5 | 61.5 | 76.5 | 15.0 | 30.0 |
Statistical analysis of secant modulus of elasticity (E 50) (case B)
| Number of cycles | Specimen ID | Maximum value: MPa | Minimum value: MPa | Average value: MPa | Standard deviation: MPa | Absolute variation: MPa |
|---|---|---|---|---|---|---|
| 0 | C0T1, C0T2 | 102.3 | 98.5 | 100.4 | 1.9 | 3.8 |
| 1 | C1T1, C1T2 | 99.3 | 86.9 | 93.1 | 6.2 | 12.4 |
| 2 | C2T1, C2T2 | 135.7 | 123.2 | 129.5 | 6.2 | 12.5 |
| 3 | C3T1, C3T2 | 110.3 | 95.9 | 103.1 | 7.2 | 14.4 |
| 4 | C4T1, C4T2 | 86.6 | 85.5 | 86.0 | 0.5 | 1.0 |
| 5 | C5T1, C5T2 | 95.2 | 78.0 | 86.6 | 8.6 | 17.2 |
| 6 | C6T1, C6T2 | 136.4 | 127.8 | 132.1 | 4.3 | 8.6 |
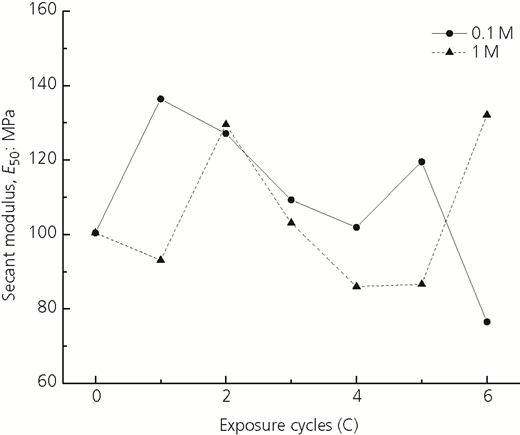
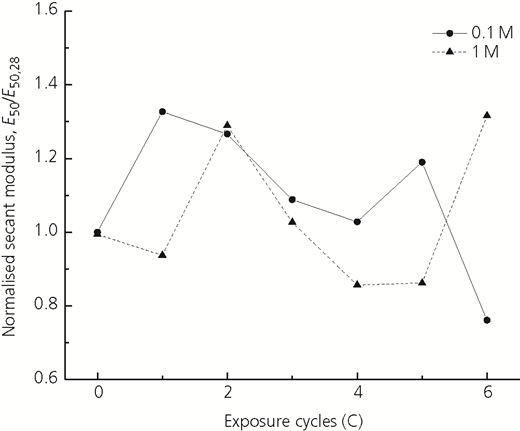
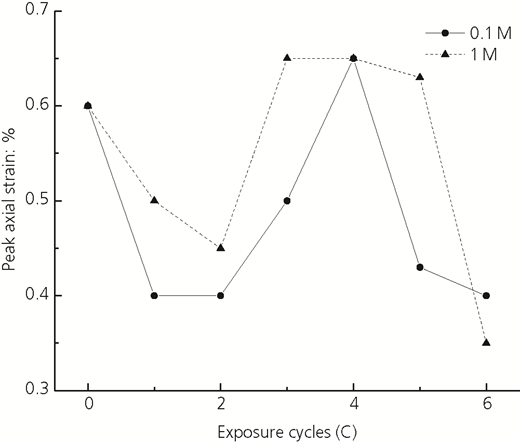
Figure 13 presents the variation of peak axial strain with time. From cycle 0 to 2, the peak axial strain decreased gradually followed by a rapid increment. Although the failure strain continued to increase, a sharp drop was observed in the later stages, illustrating lower strain accumulation at higher cycles. The peak axial strain varied from 0.40 to 0.65% and 0.35 to 0.65% for case A (0.1 M) and case B (1 M), respectively. Researchers have reported that the bedding error can lead to slight underestimation of the secant modulus and overestimation of failure strain (Goto et al., 1991; Hayano et al., 2001). Utilisation of advanced devices, such as local deformation transducers and gap sensors, could have unveiled a more representative deformation behaviour of CTS. Owing to the non-availability of such local strain-measurement devices, it was not possible to comprehend fully the effects of the bedding error on the peak strength, secant modulus and peak axial strain of CTS in the present study. However, a very thin layer of grease was used at the opposite ends of the specimens to minimise the end friction.
Conceptual mechanism of the strength reduction of CTS
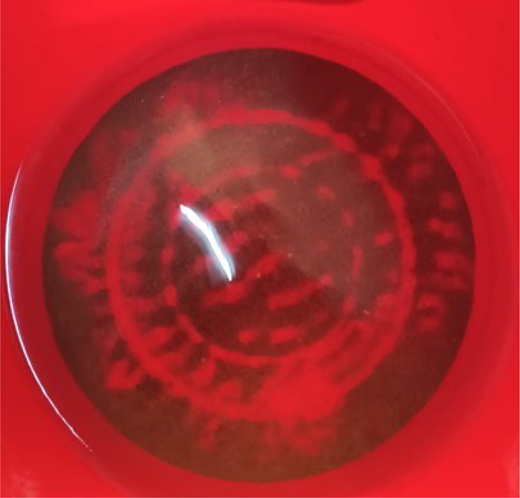
In cemented sand, cementitious compounds, such as calcium silicate hydrate (C-S-H; 3CaO·2SiO2·3H2O) and calcium aluminate hydrate (3CaO·Al2O3·Ca(OH)2·12H2O), form during the hydration process. Such amorphous compounds fill the pore spaces and bind the soil particles, which is responsible for the increase in the strength of the sample. Moreover, it is expected that the presence of grease on the outer surface of the specimens (applied during specimen preparation) spatially affected the permeability characteristics of the specimen and initially inhibited the penetration of the saline water into the sample during the earlier days, characterised by the increment in strength in the first three cycles for both case A and case B. However, when saline solution penetrates the CTS specimen, the chloride ion interacts with the calcium (Ca2+) and aluminium (Al3+) ions of the cementitious materials and produces crystals of calcium chloroaluminate (Ca2Al(OH)6Cl(H2O)2). This compound accumulates on the surface of sand particles and acts as a barrier between the sand particles and calcium hydroxide (Ca(OH)2). This phenomenon restrains the formation of additional C-S-H compounds for which no further strength is gained over time. Moreover, the presence of salinity initiates the formation of ettringite crystals, which increases the solid volume in the pore spaces. As a result, the cement–sand bond disintegrates and microcrack formation initiates (Park, 2010; Xing et al., 2009; Yin et al., 2020; Zhang et al., 2013). This can also be identified from the loose sand accumulated at the bottom of the bucket on which the samples were cured (Figure 14). As time progressed, sand accumulation increased, representing continued break-up of the cement–sand bond, resulting in lower confinement conditions for the specimen. Yang et al. (2012) observed similar deterioration of cement-treated soil under seawater curing and identified it as the primary cause of strength reduction. Also, as the drying–wetting cycle continued, the grease continued to wash away, which allowed the saline water to enter the sample more freely, deteriorating the mechanical properties of CTS. For these reasons, it is expected that the strength of CTS decreases over time.
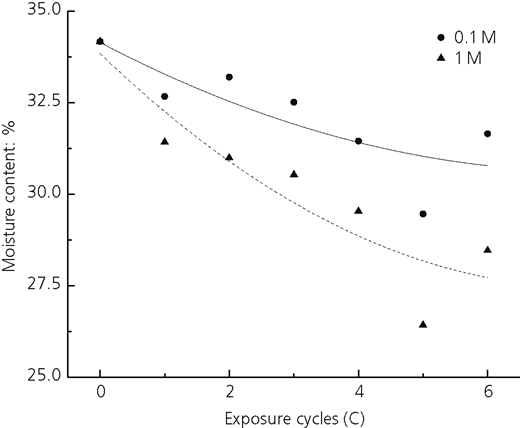
Hence, it can be concluded that in the beginning, positive strength achieved from cement hydration dominated the behaviour of cement-mixed sand, but in the later cycles, salinity intrusion initiated microcrack formation due to formation of crystals (volume expansion), which resulted in the reduction in strength. Reduction in moisture content followed by an increase in the later stages (as shown in Figure 15) also supports the aforementioned proposition. The moisture content varied from 29.5 to 33.2% for case A (0.1 M) and 31.2 to 26.4% for case B (1 M).
Conclusions
In this study, to understand the effect of salinity concentration on the mechanical behaviour of CTS at different drying–wetting cycles, two different salinity concentrations were considered. Drying–wetting cycles were continued up to about 3 months, and unconfined compression tests were conducted at regular intervals to demonstrate the possible detrimental effects of salinity. Based on the obtained data from different tests in this study, the following conclusions can be drawn.
The presence of saline solution in the ground is an important parameter affecting the strength of CTS. It can be concluded that the higher the salt concentration, the lower will be the unconfined compressive strength, and vice versa.
The existence of a saline environment in the ground has a potential negative effect on the modulus of elasticity (E50) of cement-treated soil. Also, extended exposure to increasing salt concentration decreases the stiffness of cement-treated sandy soil.
The strength of the lightly cemented sand varied with repetitive drying–wetting conditions, and the strength reduced even after the fifth cycle, which indicates that further reduction in strength is possible.
Although the present study primarily focused on understanding the effects of salinity concentration on the mechanical properties of CTS, long-term negative effects on strength can be clearly understood. Further research needs to be conducted emphasising chemical analysis to investigate the transformation of internal effects causing such strength discrepancies, and determine how long the effects will take place. Finally, when cemented sand is used for construction in coastal areas (such as the south-west zone of Bangladesh) where salt intrusion is expected in the design life, strength reduction characteristics of CTS should be of prime concern for the long-term performance.

