
At present, the conventional method of detecting the soluble salt ion content of soil takes approximately 2 days in China. Moreover, the method has complicated steps and can only be carried out indoors. The aforementioned drawbacks will delay on-site construction management and affect the construction progress in severe cases. In this study, portable equipment is proposed to detect the content of soluble salt ions of the soil. The proposed method is compared with conventional methods and analysed to develop a construction method for rapid on-site detection of soluble salts. The subgrade soil of the Bariku-to-Mulei section of the Beijing–Xinjiang expressway is tested and studied. Following the electrical conductivity principle of salt solution, the salt content of the soil is measured using a conductivity meter. On the basis of spectrophotometry, the chloride (Cl−)/sulfate (SO4 2−) value of the soil is determined using a portable water quality analyser. The experimental results show that electrical conductivity can characterise the degree of soil salinisation, and a water quality analyser can determine the type of saline soil. These measurement methods are simple and easy to master, and the detection accuracy is high. The equipment is light and portable, can be used outdoors and has the advantage of being low in price.
Introduction
The climate of Xinjiang in China is arid, with low levels of rainfall and strong evaporation, which results in various types of saline soil being widely distributed in this region. Saline soil is different from general soil. The existence of soluble salt in it changes the basic engineering properties of the soil and causes direct harm to the buildings constructed on it, such as leaching, frost heave and salt heave (Liu and Zhao, 2010). Under low-temperature conditions, the salt heave caused by sulfate (SO42−) salty soil can cause the most serious damage to highways. Such damage is irreversible, resulting in reduced service performance and service life of such constructions (Li et al., 2006). The technical code for design and construction of highway subgrade and pavement in the Xinjiang saline soil area (XJTJ 01-2001) stipulates that whether aggregates are used as subgrade fillers is determined using the chloride (Cl−)/sulfate ratio and the total salt content of the soil (Tables 1 and 2). As a transportation hub for the ‘One Belt, One Road’ strategy, Xinjiang will inevitably accelerate the development of the road network in the region. However, the saline soil in Xinjiang is not only widely distributed but also has many types, so it is bound to cause certain obstacles to construction. The conventional methods for detecting the ion content of saline soil can no longer meet the needs of rapid determination of large quantities of samples. The ion content of saline soil can be accurately determined using GB/T 50123-1999, ‘Standard for soil test method’ (SAC, 1999). However, following the standard, testing a batch of soil samples will take approximately 2 days, and the operation process of this method is cumbersome, with plenty of equipment used in the test (e.g. drying oven, thermostat water bath and oscillator). This method also uses many chemical reagents and has multiple high-risk factors (e.g. concentrated sulfuric acid and concentrated ammonia water). Although the accuracy of this method is high, the aforementioned disadvantages restrict it to being carried out indoors, the number of samples detected at one time is small and the construction unit needs to be equipped with special testing personnel. Thus, developing a construction method for the rapid detection of the ion content of saline soil on-site is significant. If the type and degree of salinisation of saline soil can be determined in time, the construction unit can reasonably use and improve the soil. It will not only save time and resources but also control the construction speed (He et al., 2010).
Saline soil classification according to the degree of salinisation
| Name of saline soil | Average salt content of the soil layer (calculated as percentage of dry soil mass): % | |
|---|---|---|
| Chloride and chlorite saline soil | Sulfite and sulfate saline soil | |
| Weakly saline soil | 0.3–1.0 | 0.3–0.5 |
| Medium saline soil | 1.0–5.0 | 0.5–2.0 |
| Strongly saline soil | 5.0–8.0 | 2.0–5.0 |
| Excessively saline soil | >8.0 | >5.0 |
Saline soil classification according to the nature of salt
| Name of saline soil | Ratio of ion content: mmol/kg | |
|---|---|---|
| Chloride/sulfate | CO32− + bicarbonate (HCO3−)/chloride + sulfate | |
| Chloride saline soil | >2 | — |
| Chlorite saline soil | 1–2 | — |
| Sulfite saline soil | 0.3<1.0 | — |
| Sulfate saline soil | <0.3 | — |
| Carbonate saline soil | — | >0.3 |
At present, the conductivity of the saturated solution of soil is usually used to characterise the degree of soil salinisation to determine the total salt content quickly. However, the formulation of the saturated solution requires the skilled operation of test personnel. Therefore, this method is not conducive to the general promotion of construction units (He and Shi, 2013; Wu et al., 2011). Most scholars in China use the electrical conductivity of the soil extraction solution to characterise the degree of soil salinisation. The aforementioned method is simple and easy to master, and its detection accuracy is high. The detection equipment has the advantages of light weight, portability and low price. The properties of the solution are also not affected by this method, and the ionic composition of the solution can be continuously measured. However, electrical conductivity is influenced by the type of saline soil, the temperature of the soil extraction solution and the soil moisture content. Therefore, the correlation between electrical conductivity and total salt content is investigated in the current study under the influence of the aforementioned factors (Li et al., 2011; Luo et al., 2012).
Methods for the rapid determination of chloride and sulfate include titration, spectrophotometry, ion chromatography and turbidimetry (Ran and Ma, 2009). Of these, ion chromatography is the fastest-developing technology. Ion chromatography has the advantages of simple operation, simultaneous determination of multiple groups, sensitivity and accuracy (Li et al., 2008). However, this method is expensive and needs special operators. Therefore, it has not been widely used in construction units (Ran and Ma, 2009). On the basis of spectrophotometry, a portable water quality analyser is used to determine the content of chloride and sulfate in the current study. The instrument has the advantages of high detection accuracy, light weight, portability and low price. Yet, due to the small measuring range of this instrument, water samples exceeding this range need to be diluted several times. The value measured by the instrument after diluting the solution is also tested in this study.
Rapid determination of soil salinisation degree
Survey of saline soil types
This study was based on the project of the Beijing–Xinjiang expressway, specifically the section from Barikun to Mulei. Barikun’s climate is classified as tropical, with a good deal of rainfall in summer but extremely little in winter. The average temperature is 27.3°C (81.2°F). The annual rainfall is 1971 mm (77.6 inches). A total of 53 soil samples were collected from different aggregate yards and subjected to a conventional soluble salt test to determine the type of saline soil and the degree of soil salinisation. The test results are shown in Figure 1.
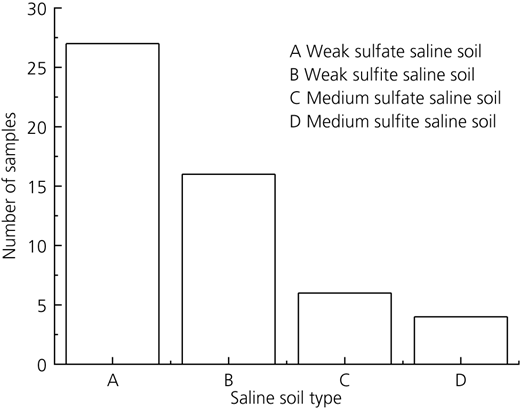
The test results showed that the soil samples from each aggregate yard were mostly weakly saline soil (Guo et al., 2019).
Test principle
Following the principle of salt solution conductivity, a conductivity meter could be used to determine the conductivity of the soil solution to characterise the salt content of the soil and the degree of salinisation rapidly. The basic principle of the instrument was the conductive effect of the electrolyte in the soil extraction solution. Within a specific concentration range, the salt content of the soil extraction solution was positively related to the conductivity. The more the dissolved salts, the greater the conductivity of the solution (Guo et al., 2019). In this experiment, a DDB-303A portable conductivity meter was used. This instrument indicates the conductivity of the solution in digital form. Before the test, the solution was mixed, and then the conductivity was measured when the rotation of the solution was stable. During the experiment, the conductivity instrument should not touch the bottom or the sides of the cup.
Influence of temperature on conductivity
The soil samples under 1 mm sieve were desalted and dried and then mixed with sodium chloride (NaCl) and sodium sulfate (Na2SO4). The chloride/sulfate value in the soil sample was artificially controlled to simulate different types of saline soil. Four groups of soil samples were prepared with chloride/sulfate values of 0.2 (sulfate saline soil), 0.5 (sulfite saline soil), 1.5 (chlorite saline soil) and 2.5 (chloride saline soil). Each group had two soil samples with 0.3 and 0.7% amounts of soluble salt. Eight samples were prepared. Next, 100 g of the treated soil sample, with a soil–water ratio of 1:5, was taken to prepare the aqueous solution of the soil. It was mixed on an oscillator for 3 min and set aside for several minutes until it became stable. Subsequently, it was filtered to obtain the soil extraction solution. The test temperature range of the DDB-303A portable conductivity meter was between 5 and 35°C. The temperature of the aqueous solution of eight soil samples was controlled, starting from 35°C. Their conductivity was measured every decrease of 5°C until a temperature of 5°C was reached. The curve of conductivity with temperature is shown in Figure 2.
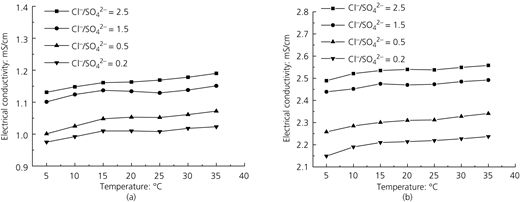
(a) Curve of conductivity with temperature (0.3%); (b) curve of conductivity with temperature (0.7%)
(a) Curve of conductivity with temperature (0.3%); (b) curve of conductivity with temperature (0.7%)
The conductivity was positively correlated with temperature, as shown in Figure 2. With the increase in temperature, the thermal motion increased. Likewise, the free electrons from the covalent bond and the concentration of carriers had increased. Finally, the conductivity of the solution was enhanced (Chen et al., 2010; Li and Li, 1994). When the temperature of the solution was between 15 and 25°C, conductivity became stable with the temperature change. This experiment should also be carried out outdoors in the future, where the outside air temperature is used as the temperature of the soil extraction solution. In the current study, the temperature of the solution for measuring conductivity was controlled between 15 and 25°C.
Influence of soil mass and soil–water ratio on conductivity
A total of ten groups of soil samples were taken from the aggregate yard wherein each group had soil particles under a 1 mm sieve. The soil particles were then placed in a drying oven. The soil masses of each group were 50, 100, 150, 200 and 250 g, and the soil–water ratio was uniformly 1:5 to prepare the aqueous solution of the soil. The solution was placed on an oscillator and mixed for 3 min and then filtered to obtain the soil extraction solution. Next, 50 ml of the soil extraction solution was taken, and the drying residue method was used to determine its total salt content. In the remaining solution, when its temperature was between 15 and 25°C, the conductivity of the solution can be measured. The maximum relative error of the total salt content and electrical conductivity caused by different soil masses of the same soil sample was then calculated. The results are shown in Table 3.
Maximum relative error caused by different soil qualities
| Soil sample number | 1 | 2 | 3 | 4 | 5 | 6 | 7 | 8 | 9 | 10 |
| Total salt content: % | 3.00 | 4.89 | 4.89 | 4.48 | 3.98 | 4.52 | 5.25 | 4.37 | 4.48 | 4.37 |
| Electrical conductivity: % | 4.31 | 2.98 | 4.76 | 4.55 | 1.35 | 2.98 | 7.21 | 4.56 | 3.67 | 6.81 |
The soil samples numbered 1–10 are natural soil particles without artificial processing
Notation
The calculation method of the relative error of the total salt content is A/B × 100%:
A: total salt content of the same soil sample with different soil masses
B: total salt content of a soil sample of 100 g.
The calculation method of the relative error of electrical conductivity is C/D × 100%:
C: electrical conductivity of the same soil sample with different soil masses
D: electrical conductivity of a soil sample of 100 g.
The data analysis results showed that the soil mass had little effect on the determination of the total salt content and electrical conductivity, and the maximum relative errors did not exceed 6 and 8%, respectively. Accordingly, 100 g of soil sample was taken to measure the electrical conductivity of the soil extraction solution to be consistent with the current geotechnical code (GB/T 50123-1999, ‘Standard for soil test method’ (SAC, 1999)).
The aforementioned ten groups of sieved and dried soil samples were taken as the research object. Five parts of soil, with a soil mass of 100 g each, were taken for each group. Solutions with soil–water ratios of 1:3, 1:4, 1:5, 1:6 and 1:7 were prepared. Their conductivity and total salt content were measured. The maximum relative errors of the total salt content and electrical conductivity of the same soil sample under different soil–water ratios were calculated. The results are shown in Table 4.
Maximum relative error caused by different soil–water ratios
| Soil sample number | 1 | 2 | 3 | 4 | 5 | 6 | 7 | 8 | 9 | 10 |
| Total salt content: % | 15.48 | 28.78 | 11.09 | 23.12 | 27.45 | 23.48 | 17.56 | 13.78 | 28.94 | 25.16 |
| Electrical conductivity: % | 33.23 | 48.38 | 46.71 | 36.04 | 29.26 | 31.57 | 39.18 | 43.88 | 50.98 | 25.49 |
The soil samples numbered 1–10 are natural soil particles without artificial processing
Notation
The calculation method of the relative error of electrical conductivity is E/F × 100%:
E: electrical conductivity of the same soil sample with different soil–water ratios
F: electrical conductivity of a soil sample with a soil–water ratio of 1:5.
The calculation method of the relative error of the total salt content is G/H × 100%:
G: total salt content of the same soil sample with different soil–water ratios
H: total salt content of a soil sample with a soil–water ratio of 1:5.
The maximum relative error of the total salt content of the same soil sample caused by different soil–water ratios was as high as 30%. With an excessive soil–water ratio, the soluble salt in soil could not be fully dissolved. In contrast, with a limited soil–water ratio, the solubility of insoluble salt would increase (Guo et al., 2015). Given the different soil–water ratios, the ion concentrations were naturally different. Therefore, the maximum relative error of conductivity of the same soil sample under different soil–water ratios was as high as 50%. A soil–water ratio of 1:5 was maintained to prepare the soil solution and ensure the stability and repeatability of the test results of soil extraction solution conductivity (Li et al., 2008).
Influence of suspended particles and moisture content on conductivity
In accordance with GB/T 50123-1999, ‘Standard for soil test method’ (SAC, 1999), the soil sample should be placed in a drying oven and dried for 4–8 h. In addition, qualitative filter paper is needed to filter the aqueous solution of the soil to obtain the soil extraction solution. In the current study, the aforementioned factors were investigated to explore the influence of moisture content and suspended particles on the electrical conductivity test results. On the basis of the results of the previous experiments, the soil samples participating in this experiment had a soil mass of 100 g and a soil–water ratio of 1:5 for preparing the aqueous solution of the soil. When the temperature of the solution was between 15 and 25°C, the conductivity of the solution was measured.
A total of 30 groups of soil samples were taken from the aggregate yard, and a small number of soil particles under the 1 mm sieve were taken from each group. The soil samples were divided into two parts: one was dried by using a drying oven and the other was dried by sunshine. (The purpose of sunshine drying was to replace the role of the drying oven for testing the conductivity of the soil in the field.) The method of sunshine drying was conducted as follows: a few soil samples (more than 100 g) were laid on a tray thinly and placed outdoors to evaporate water with the help of sufficient sunshine, dry weather and strong wind in Xinjiang. If the soil sample had been relatively dry, then it would sit outside for another hour. If the soil sample was extremely wet, then an alcohol lamp was placed under the tray to accelerate the evaporation of water. Following the test requirements, the aqueous solution of the treated soil samples was prepared.
The soil solution was mixed, and its conductivity was measured when it was stable before it was filtered to explore the effect of suspended particles on the conductivity test results. The measurement results were also classified to facilitate analysis. They were recorded as the sunshine-drying unfiltered conductivity (abbreviated as SDUC) and oven-drying unfiltered conductivity (abbreviated as ODUC). After the measurement, the solution was filtered, and its conductivity was measured. The measurement results were recorded as the sunshine-drying filtered conductivity (abbreviated as SDFC) and oven-drying filtered conductivity (abbreviated as ODFC). The aforementioned measurement results are shown in Table 5.
Influence of water content and suspended particles on conductivity
| Soil sample number | Electrical conductivity: mS/cm | |||||||
|---|---|---|---|---|---|---|---|---|
| SDUC | SDFC | SDFC-SDUC | ODUC | ODFC | ODFC-ODUC | ODFC-SDUC | ||
| 11 | 0.078 | 0.084 | 0.006 | 0.107 | 0.100 | −0.007 | 0.022 | 22.00 |
| 12 | 0.165 | 0.169 | 0.004 | 0.174 | 0.183 | 0.009 | 0.018 | 9.84 |
| 13 | 0.267 | 0.261 | −0.006 | 0.276 | 0.283 | 0.007 | 0.016 | 5.65 |
| 14 | 0.321 | 0.331 | 0.010 | 0.352 | 0.342 | −0.010 | 0.021 | 6.14 |
| 15 | 0.385 | 0.401 | 0.016 | 0.425 | 0.418 | −0.007 | 0.033 | 7.89 |
| 16 | 0.501 | 0.487 | −0.014 | 0.511 | 0.529 | 0.018 | 0.028 | 5.29 |
| 17 | 0.527 | 0.541 | 0.014 | 0.584 | 0.565 | −0.019 | 0.038 | 6.73 |
| 18 | 0.617 | 0.624 | 0.007 | 0.638 | 0.656 | 0.018 | 0.039 | 5.95 |
| 19 | 0.634 | 0.628 | −0.006 | 0.657 | 0.678 | 0.021 | 0.044 | 6.49 |
| 20 | 0.781 | 0.767 | −0.014 | 0.796 | 0.811 | 0.015 | 0.030 | 3.70 |
| 21 | 0.925 | 0.914 | −0.011 | 0.958 | 0.945 | −0.013 | 0.020 | 2.12 |
| 22 | 1.190 | 1.180 | −0.010 | 1.220 | 1.210 | −0.010 | 0.020 | 1.65 |
| 23 | 1.320 | 1.320 | 0 | 1.380 | 1.360 | −0.020 | 0.040 | 2.94 |
| 24 | 1.490 | 1.520 | 0.030 | 1.520 | 1.550 | 0.030 | 0.060 | 3.87 |
| 25 | 1.680 | 1.490 | −0.190 | 1.700 | 1.720 | 0.020 | 0.040 | 2.33 |
| 26 | 1.920 | 1.900 | −0.020 | 1.940 | 1.970 | 0.030 | 0.050 | 2.54 |
| 27 | 1.960 | 1.940 | −0.020 | 2.010 | 1.980 | −0.030 | 0.020 | 1.01 |
| 28 | 2.000 | 2.010 | 0.001 | 2.060 | 2.040 | −0.020 | 0.040 | 1.96 |
| 29 | 2.120 | 2.110 | −0.010 | 2.140 | 2.150 | 0.010 | 0.030 | 1.40 |
| 30 | 2.210 | 2.250 | 0.040 | 2.260 | 2.280 | 0.020 | 0.070 | 3.07 |
| 31 | 2.420 | 2.470 | 0.050 | 2.450 | 2.520 | 0.070 | 0.100 | 3.97 |
| 32 | 2.650 | 2.690 | 0.040 | 2.700 | 2.690 | −0.010 | 0.040 | 1.49 |
| 33 | 2.690 | 2.710 | 0.020 | 2.750 | 2.740 | −0.010 | 0.050 | 1.82 |
| 34 | 2.770 | 2.750 | −0.020 | 2.800 | 2.820 | 0.020 | 0.050 | 1.77 |
| 35 | 2.890 | 2.950 | 0.060 | 3.020 | 3.010 | −0.010 | 0.120 | 3.99 |
| 36 | 3.130 | 3.110 | −0.020 | 3.160 | 3.170 | 0.010 | 0.040 | 1.26 |
| 37 | 3.180 | 3.260 | 0.080 | 3.310 | 3.280 | −0.003 | 0.100 | 3.05 |
| 38 | 4.060 | 4.030 | −0.030 | 4.080 | 4.110 | 0.030 | 0.050 | 1.22 |
| 39 | 4.070 | 4.050 | −0.020 | 4.080 | 4.090 | 0.010 | 0.020 | 0.49 |
| 40 | 4.040 | 4.080 | 0.040 | 4.110 | 4.170 | 0.060 | 0.130 | 3.12 |
The test results showed that whether the solution was filtered had little effect on the conductivity. Except for the individual data, it did not exceed 0.03 mS/cm. Thus, the suspended particles had little effect on the conductivity of the solution. The basic principle of conductivity measurement was the conductive effect of the electrolyte in the solution. The suspended particles were mostly inorganic substances, silt and microorganisms. They were insoluble in water and non-conductive.
For the same soil sample, the SDUC was slightly lower than the ODFC. Except for the individual data, the relative error between the two could be controlled within 5%. After the soil sample had been exposed to sunshine, its moisture content decreased (Sun, 2000; Xu et al., 2019). The remaining moisture in the soil had little effect on the conductivity of the solution. The data in the table show that the smaller the conductivity, the greater the relative error between the two. The reason was that the smaller the base number is, the larger the relative error that will be caused by the fluctuation of the divisor in a small range. When the divisor is smaller, the fluctuation in the small range of the dividend can cause a large relative error. However, the total salt content corresponding to low conductivity was extremely low, and the soil was already non-saline soil at this time. Thus, it did not affect the judgement of the degree of soil salinisation.
Correlation between conductivity and total salt content
Types of known saline soil
The following experiment was carried out to explore the correlation between the total salt content and conductivity when the type of saline soil was known. Following the previous experimental results, the soil samples participating in this experiment had a soil mass of 100 g and a soil–water ratio of 1:5 for preparing the aqueous solution of the soil. When the temperature of the soil solution was between 15 and 25°C, the conductivity of the solution was measured.
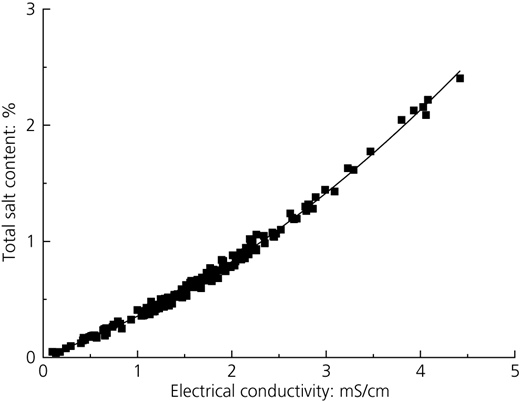
The soil samples under 1 mm sieve were desalted and dried and then mixed with sodium chloride and sodium sulfate. The chloride/sulfate value of the soil sample was artificially controlled to simulate different types of saline soil. Four groups of soil samples were prepared with chloride/sulfate values of 0.2 (sulfate saline soil), 0.5 (sulfite saline soil), 1.5 (sub-saline soil) and 2.5 (chloride saline soil). Each group had 77 soil samples. The first 20 soil samples had started at a 0.01% total salt content, followed by a gradient of 0.01% until a value of 0.2% was reached. Another 40 soil samples had started at 0.22%, followed by a gradient of 0.02% until a value of 1% was reached. The remaining 17 soil samples started at 1.2%, followed by a gradient of 0.2% until a value of 4.4% was reached. The electrical conductivity of the filtered aqueous solution of the soil was also tested to ensure the accuracy of the correlation between the electrical conductivity and the total salt content and reduce the interference of unimportant factors. In accordance with the test results, the relationship between the conductivity of different types of saline soil and the total salt content is drawn, as shown in Figure 3.
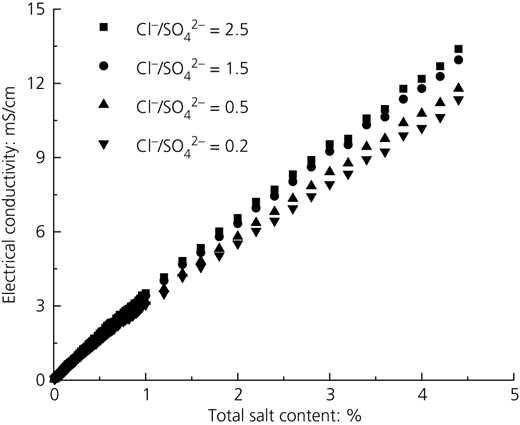
Curves of electrical conductivity of different types of saline soils as a function of total salt content
Curves of electrical conductivity of different types of saline soils as a function of total salt content
The total salt content of each type of saline soil had a significant correlation with electrical conductivity. The reason was that the conductivity of the solution was related to the concentration of its charge. The higher the charge concentration, the stronger the conductivity of the solution. Moreover, 1 g of sodium sulfate was completely dissolved to obtain 0.007 mol of sulfate – that is, 0.014 mol of negative charge. After dissolving the same mass of sodium chloride, 0.017 mol of chloride could be obtained – that is, 0.017 negative charge. Therefore, under specific conditions, with the same total salt content, the higher the chloride/sulfate ratio, the greater the conductivity, and the greater the total salt content, the greater the increase in conductivity.
The SPSS software was used to analyse the total salt content and electrical conductivity of each type of saline soil to find the corresponding functional relationship between them. After many times of function fitting, the quadratic function of the electrical conductivity and total salt content of each type of saline soil was found as the best, with R2 as high as 1. The fitting curves are shown in Figure 4, and the functional relationships are shown in Table 6.
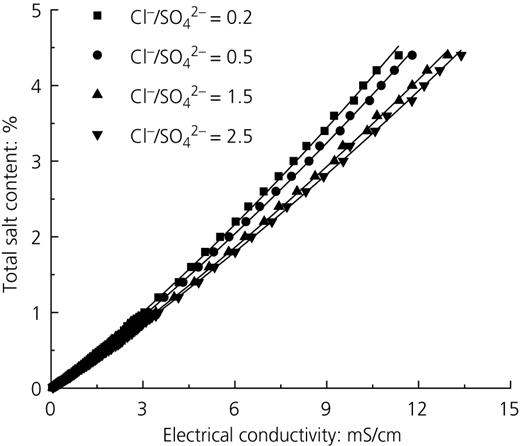
Fitting curves of the total salt content and electrical conductivity for various types of saline soils
Fitting curves of the total salt content and electrical conductivity for various types of saline soils
Regression relationship between the total salt content and electrical conductivity of various types of saline soils
| Chloride/sulfate | 2.5 | 1.5 | 0.5 | 0.2 |
| Regression equation | Y = 0.277X + 0.004X2 − 0.023 | Y = 0.288X + 0.004X2 − 0.027 | Y = 0.308X + 0.006X2 − 0.028 | Y = 0.326X + 0.007X2 − 0.035 |
| R2 | 1.000 | 1.000 | 1.000 | 1.000 |
| Adjusted R2 | 1.000 | 1.000 | 1.000 | 1.000 |
| Whether F is significant | T | T | T | T |
| Whether T is significant | T | T | T | T |
F is the variance test, the global test of the whole model to see whether the fitting equation is meaningful; the T value tests each independent variable one by one (logistic regression) to see whether its beta value – that is, the regression coefficient – is meaningful; T stands for significant; X represents the electrical conductivity of the soil solution; Y represents the total salt content of the soil sample
Following the regression equation in Table 6, the corresponding total salt content was converted using conductivity, and the value was compared with the conventional value. The error between the two was not large. The relative error situation is shown in Table 7.
Relative error analysis
| Chloride/sulfate | Range of the relative error between the total salt content converted by the conductivity and the conventional value | |||||
|---|---|---|---|---|---|---|
| 0–5%: pieces | 5–25%: pieces | 25–50%: pieces | 50–100%: pieces | 100–200%: pieces | 200–300%: pieces | |
| 2.5 | 63 | 7 | 3 | 1 | 1 | |
| 1.5 | 63 | 6 | 3 | 1 | 1 | 1 |
| 0.5 | 64 | 5 | 2 | 2 | 1 | 1 |
| 0.2 | 63 | 4 | 3 | 3 | 1 | 1 |
The relative error between the total salt content converted by the conductivity of each type of saline soil and the conventional value could be controlled within 5%. The error of the data in the table was as high as 300% because of the low total salt content of the soil samples studied. Thus, it did not affect the use of electrical conductivity in the rapid determination of the degree of soil salinisation.
Types of unknown saline soil
The following experiment was carried out to explore the correlation between the total salt content and electrical conductivity when the type of saline soil was unknown. Following the previous experimental results, the soil samples participating in this experiment had a soil mass of 100 g and a soil–water ratio of 1:5 for preparing the aqueous solution of the soil. When the temperature of the soil solution was between 15 and 25°C, the conductivity of the solution was measured.
The SPSS software was used to analyse the correlation between the two. The best functional relationship between the total salt content of the unknown type of saline soil and its solution conductivity was still a quadratic function. The adjusted R2 was as high as 0.992. The fitting curve is shown in Figure 5, and the functional relationship is shown in Table 8.
Regression curve of the total salt content and electrical conductivity of unknown types of saline soils
Regression curve of the total salt content and electrical conductivity of unknown types of saline soils
Regression relationship between the total salt content and electrical conductivity of unknown types of saline soils
| Chloride/sulfate | Y = 0.257X + 0.069X2 + 0.025 |
| Regression equation | Y = 0.257X + 0.069X2 + 0.025 |
| R2 | 0.994 |
| Adjusted R2 | 0.992 |
| Whether F is significant | T |
F is the variance test, the global test of the whole model to see whether the fitting equation is meaningful; T stands for significant; X represents the electrical conductivity of the soil solution; Y represents the total salt content of the soil sample
The corresponding total salt content was converted using conductivity following the regression equation in Table 8, and the value was compared with the conventional value. The error between the two was not large. The relative error situation is shown in Table 9.
Relative error analysis
| Total salt content: % | Range of the relative error between the total salt content converted by the conductivity and the conventional value | |||||
|---|---|---|---|---|---|---|
| 0–5%: pieces | 5–10%: pieces | 10–15%: pieces | 15–20%: pieces | 20–25%: pieces | 25–30%: pieces | |
| 0–0.1 | 2 | 1 | 1 | 1 | — | 2 |
| 0.1–0.3 | 19 | 5 | 2 | — | — | — |
| 0.3–0.5 | 27 | 3 | 1 | — | — | — |
| 0.5–0.8 | 58 | 2 | 1 | — | — | — |
| 0.8–1.3 | 32 | 1 | — | — | 1 | — |
| 1.3–2.0 | 14 | — | — | — | — | — |
The relative error between the total salt content converted using the conductivity of the unknown saline soil and the conventional value could also be controlled within 5%. When the total salt content was lower than 0.1, the relative error was as high as 30%. However, these soil samples were already non-saline soil, so it did not affect the use of electrical conductivity in the rapid determination of the degree of soil salinisation.
Rapid determination of saline soil type
A portable water quality analyser was used to determine the type of saline soil on-site quickly and conveniently. The principle of the instrument was that chloride and sulfate react with a chromogenic reagent to form white and light-green complexes, respectively, in a specific environmental medium. The absorbance was determined by spectrophotometry. Then, the contents of chloride and sulfate were directly displayed after being processed and calculated by a microcomputer system. The darker the colour of the solution, the higher the content.
However, the water quality analyser requires that the solution to be tested is clear and transparent. Thus, when the instrument is used to determine the contents of chloride and sulfate in the aqueous solution of the unfiltered soil, it will misjudge the type of saline soil. At this time, the experimenter should know that when mixing the aqueous solution of the soil, if the solution was rapidly stratified and the upper water solution was clear and transparent, the soil sample was a saline soil; otherwise, the soil sample was a non-saline soil. In construction, the type and degree of salinisation of saline soil were the only ones that should be determined. When the degree of soil salinisation was known by the conductivity meter, the clear and transparent water solution on the upper layer could be directly taken. Then, the content of chloride and sulfate could be determined by the water quality analyser to identify the type of saline soil and guide the construction.
The ranges of chloride and sulfate contents determined by the water quality analyser were 0–100 and 0–80 mg/l, respectively, and most of the lower limit contents of chloride and sulfate in the soil were higher than the maximum range of this instrument. Hence, the soil extraction solution should be diluted several times. The research and development personnel operating the equipment showed that the error of the solution could be controlled within 5% after 100 times dilution. The analysis results of the relationship between the content of various ions in the soil showed that the sulfate content was higher than the chloride content. In this study, the soil extraction solution could be diluted following Table 10. The water quality analyser could determine two types of curves regarding chloride: the first curve had a range of 0–10 mg/l, whereas the second curve had a range of 10–100 mg/l. In this experiment, the second curve was used to determine the unknown concentration range. If the instrument display was below 10 mg/l, for accurate results, the measurement could be repeated using the first curve.
Dilution times and methods
| Total salt content: % | Dilution factor | Volume of water sample to take: ml | Add distilled water to final volume of: ml | Volume of diluted water sample to take: ml | Add distilled water to final volume of: ml |
|---|---|---|---|---|---|
| 0–0.8 | 10 | 10 | 100 | — | — |
| 0.8–1.3 | 20 | 10 | 200 | — | — |
| 1.3–2.0 | 100 | 10 | 100 | 10 | 100 |
The aqueous solution was diluted following Table 10, and the measured result exhibited little error with the conventional value, as shown in Table 11.
Influence of the dilution ratio on chloride/sulfate
| Soil sample number | Total salt content: % | Dilution factor | Chloride relative error: % | Sulfate relative error: % | Conventional chloride/sulfate value (CS1) | Instrument chloride/sulfate value (CS2) | CS1 − CS2 |
|---|---|---|---|---|---|---|---|
| 41 | 0.191 | 10 | 1.60 | 1.60 | 0.43 | 0.43 | 0 |
| 42 | 0.264 | 10 | 3.87 | 1.89 | 0.39 | 0.38 | 0.01 |
| 43 | 0.281 | 10 | 4.26 | 2.28 | 0.27 | 0.26 | 0.01 |
| 44 | 0.301 | 10 | 1.79 | 2.79 | 0.28 | 0.28 | 0 |
| 45 | 0.375 | 10 | 3.49 | 1.50 | 0.24 | 0.24 | 0 |
| 46 | 0.468 | 10 | 3.39 | 2.39 | 0.17 | 0.16 | 0.01 |
| 47 | 0.580 | 10 | 3.68 | 2.69 | 0.72 | 0.71 | 0.01 |
| 48 | 0.598 | 10 | 4.16 | 2.19 | 0.67 | 0.65 | 0.02 |
| 49 | 0.781 | 10 | 4.07 | 2.09 | 0.28 | 0.28 | 0 |
| 50 | 0.789 | 10 | 4.35 | 2.38 | 0.72 | 0.71 | 0.01 |
| 51 | 0.828 | 20 | 3.83 | 2.83 | 0.21 | 0.21 | 0 |
| 52 | 0.897 | 20 | 3.73 | 2.74 | 0.08 | 0.08 | 0 |
| 53 | 0.918 | 20 | 4.07 | 2.09 | 0.26 | 0.25 | 0.01 |
| 54 | 0.971 | 20 | 1.89 | 2.88 | 0.69 | 0.70 | −0.01 |
| 55 | 1.108 | 20 | 4.11 | 2.14 | 0.29 | 0.29 | 0 |
| 56 | 1.115 | 20 | 4.16 | 2.19 | 1.13 | 1.10 | 0.03 |
| 57 | 1.129 | 20 | 4.21 | 2.23 | 0.64 | 0.63 | 0.01 |
| 58 | 1.148 | 20 | 3.92 | 2.93 | 0.30 | 0.30 | 0 |
| 59 | 1.159 | 20 | 4.02 | 2.04 | 0.23 | 0.22 | 0.01 |
| 60 | 1.272 | 20 | 3.78 | 2.79 | 0.21 | 0.21 | 0 |
| 61 | 1.358 | 100 | 3.26 | 3.26 | 0.47 | 0.47 | 0 |
| 62 | 1.404 | 100 | 1.99 | 2.98 | 0.41 | 0.41 | 0 |
| 63 | 1.459 | 100 | 2.19 | 2.19 | 0.51 | 0.51 | 0 |
| 64 | 1.612 | 100 | 3.26 | 3.26 | 0.27 | 0.27 | 0 |
| 65 | 1.678 | 100 | 4.17 | 2.19 | 0.62 | 0.61 | 0.01 |
| 66 | 1.689 | 100 | 1.99 | 2.98 | 0.79 | 0.80 | −0.01 |
| 67 | 1.758 | 100 | 3.07 | 3.07 | 0.40 | 0.40 | 0 |
| 68 | 1.798 | 100 | 3.26 | 3.26 | 0.30 | 0.30 | 0 |
| 69 | 1.898 | 100 | 3.26 | 3.26 | 0.22 | 0.22 | 0.01 |
| 70 | 2.105 | 100 | 5.02 | 3.07 | 0.24 | 0.23 | 0.01 |
The error of chloride and sulfate contents could be controlled within 5 and 4%, respectively. However, given the above finding, the chloride/sulfate value of the rapid analyser was similar to the conventional value. Except in individual cases, the value did not exceed 0.01. The calculation formula of the instrument chloride/sulfate is expressed as follows:
Conclusion
The experimental results showed that electrical conductivity could be used to characterise the degree of soil salinisation, and the error was within the scope of construction. The soil particles under a 1 mm sieve should be taken and exposed to sunshine for an hour to determine the degree of soil salinisation on-site conveniently and quickly. Then, the aqueous solution of the soil should be prepared with a soil mass of 100 g and a soil–water ratio of 1:5. After mixing the solution by hand for 3 min, the conductivity of the solution was directly measured. Before the test, the solution was mixed, and the conductivity was measured when it was stable. Finally, the value was brought into the corresponding regression equation to know the degree of soil salinisation.
The range of water sample measured by the water quality analyser was small, so the aqueous solution of the soil should be diluted. The error caused by the dilution of the solution had little effect on judging the type of saline soil. However, the water quality analyser could not determine the chloride and sulfate contents in the turbid aqueous solution.
The chloride and sulfate contents of this type of solution could be determined by filtering it with a qualitative filter paper to obtain the target solution.
Acknowledgement
Wenjing Liu’s deepest gratitude goes first and foremost to Professor Liqun Feng for his constant encouragement and guidance. He has walked the author through all the stages of the writing of the thesis on which this paper was based. Without his consistent and illuminating instruction, this paper could not have reached its present form.
