
This paper presents a modified Biot’s model for describing the hydromechanical behaviour of the Callovo-Oxfordian Argillite (COx) Claystone. The COx Claystone exhibits significant deformation during water desaturation/resaturation, and the standard Biot’s model is unable to predict the large shrinkage/swelling of the material. The authors then introduced an additional swelling/shrinkage law to simulate large deformations upon changes in water content. This added deformation law is calibrated against the difference between measurements from laboratory tests and predictions from the standard Biot’s model. The plastic-damage model, developed by Fichant et al. for concrete, is used to describe the mechanical behaviour of the solid skeleton of the COx Claystone. In particular, the stress–strain relation is described in a damage-based model, while the plastic behaviour relies on the Nadai criterion. The validation of the proposed model is performed by numerical simulation of (a) uniaxial compression tests under different relative humidities of 32, 44 and 76%; (b) triaxial compression tests at confining stresses of 0, 2, 6 and 12 MPa under relative humidity of 90%; (c) free deformation desaturation–resaturation paths; (d) resaturation swelling tests under a constant axial load; and (e) axial swelling pressure tests. Comparison of the results from the aforementioned numerical simulations with experimental data demonstrates the capability of the proposed model to describe accurately the hydromechanical behaviour of the COx Claystone.
Notation
- ai, bi
parameters
- B
Biot’s coefficient
- d
damage
- E
Young’s modulus of Callovo-Oxfordian Argillite (COx)
- Esaturated
Young’s modulus of saturated COx
- F(σ)
plastic flow
- f
external load
- Gf
fracture energy
- h
size of the numerical mesh element
- I
unit matrix
- Pc
capillary pressure
- R
universal gas constant
- Sr
saturation degree
- T
temperature
- Ww
molar mass of water
- β
hardening/softening variable
equivalent strain
- ϵadded(i)
added strain
- ϵadded(resaturation)
added strain from resaturation
- ϵBiot
Biot’s strain
- ϵCOx(desaturation)
COx strain from desaturation
- ϵCOx(resaturation)
COx strain from resaturation
- ϵd0
tensile strain threshold
principal elastic strains
- ϵp
plastic strain
normal strain slope
shear strain slope
- ρw
water density
- σ
Biot’s stress
- σe
skeleton stress
effective stress in the damage model
effective stress after plastic deformation
compressive part of
tensile part of
- σt
tensile stress
- σv
von Mises equivalent stress
- υ
Poisson’s ratio
Introduction
The French National Radioactive Waste Management Agency (Andra) is responsible for the design of sustainable solutions to the management of nuclear waste in France. Since the 1990s, Andra has considered the Callovo-Oxfordian Argillite (COx) Formation in the Meuse/Haute-Marne region as a potential geological host of a nuclear waste disposal. The COx Formation is divided into three layers: a clay unit (UA) located at around −490 m, a transition unit (UT) located at around −465 m and a silty carbonate-rich unit (USC) located at around −430 m. The UA layer occupies more than half of the entire thickness of the COx deposit, which is about 85 m, and is therefore the principal candidate to host the nuclear waste repository. The choice of the COx Claystone is justified by its low permeability (5 × 10⁻²¹ m2 ∼ 5 × 10⁻²⁰ m2), low molecular diffusion and good radioactive retention. In 2000, Andra started the construction of the Meuse/Haute-Marne underground laboratory, which is located inside the COx Formation and is schematically presented in Figure 1.

Location and geology of the Meuse/Haute-Marne underground research laboratory (URL) (De La Vaissière et al., 2015)
Location and geology of the Meuse/Haute-Marne underground research laboratory (URL) (De La Vaissière et al., 2015)
The laboratory is accessible by means of two shafts dug to a depth between 420 and 550 m below the surface. The ventilation of the shafts and tunnels produces a progressive drying of the COx Claystone close to the excavation (Baechler et al., 2011), where water saturation can vary from 100 to 70% within a distance of 0–1 m from the exposed surface. The desaturation of the COx Claystone, and the associated increase in pore water tension, determines the shrinkage of the material and the consequent reduction of in situ compressive stresses. This decompression causes the development of fractures of different sizes close to the excavation, which results in an increase in the intrinsic permeability of the material. Baechler et al. (2011) studied the permeability of both the fracture-connected zone and the fracture-diffuse zone, which are collectively referred to as the fracture-connected zone (Excavation Damage Zone (EDZ)). In the fracture-connected zone, cracks develop from the surrounding rock surface and tend to be larger, resulting in values of intrinsic permeability as large as 10−17 m2. Instead, the fracture-diffuse zone, which is located behind the fracture-connected zone, exhibits lower values of intrinsic permeability – that is, between 10−19 and 10−17 m2. The increase in intrinsic permeability in both these zones augments the risk of nuclear waste leakage, which is, however, mitigated by the swelling of the COx Claystone upon resaturation. Swelling contributes to sealing of the fractures inside the fractured zone, which restores the original impermeability of the material as shown experimentally by Zhang (2013).
The engineering description of this mechanism of fracturing upon excavation/desaturation and self-sealing upon resaturation requires a formulation of a material model that is capable of precisely reproducing the complex unsaturated hydromechanical behaviour of the COx Claystone. This model will then be used to analyse the evolution of permeability inside the fractured zone from excavation to service life and therefore to predict the efficiency of nuclear waste containment. Through works of literature reviews, the short-term behaviour of COx has been deeply investigated by a series of experimental programmes (Andra, 2005; Armand et al., 2017; Zhang et al., 2010), and these research studies include uniaxial/triaxial compressive failure tests, swelling tests during desaturation/resaturation processes and variations in basic mechanical properties with change in water content. However, there were few numerical models able to simulate precisely the hydromechanical behaviours of COx because they did not take into account the evolutions of tensile/compressive strength, Young’s modulus and fracture energy of COx with change in water content. Simultaneously, there were many experiments and numerical analyses (Armand et al., 2014; Charlier et al., 2013; De La Vaissière et al., 2015; Menaceur et al., 2016) carried out to validate the self-sealing of the fractured zone by means of measuring and calculating of permeability. However, due to these existed numerical models are not able to reproduce the deformation of COx upon saturation changing, therefore they are not able to precisely describe the permeability evolution of fractured zone from the excavation of underground drifts to service life. This paper focuses on the accurate prediction of COx deformation upon changes in water content and on the validation of these predictions against experimental data from uniaxial/triaxial compression tests (Armand et al., 2017), desaturation/resaturation tests (Pham et al., 2007; Zhang et al., 2010) and swelling pressure tests (Zhang et al., 2010). A number of researchers have studied the hydromechanical behaviour of expansive soils, such as Gens and Alonso (1992), who proposed a framework for predicting the evolution of porosity inside unsaturated soils subjected to water content changes. This paper builds on this and other contributions to develop a model that is applicable to the prediction of the swelling/shrinkage of the COx Claystone. Compared with ordinary expansive soils, which tend to experience large irreversible deformation, the behaviour of the COx Claystone is closer to that of a rock, where deformations during saturation changes tend to be small and generally reversible. Therefore, Biot’s model is selected as a basis to develop a model that can take the properties of soils and rocks into account at the same time, and for the first time, it is used to analyse the hydromechanical behaviour of a kind of claystone material.
The main hydromechanical properties of the COx Claystone are summarised in Table 1. The UA layer includes 20–30% quartz and 20–30% calcite grains scattered in a fine clay matrix whose content is about 40–45%. This clay matrix determines the deformation behaviour of the material and its ability to self seal the fractures produced by the excavation.
Main hydromechanical properties of claystone
| Zone | Thickness: m | Water content: % | Young’s modulus: MPa | Porosity: % | Compressive strength: MPa |
|---|---|---|---|---|---|
| UT | 25 | 6.1 ± 1.5 | 5837 ± 2455 | 14.0 | 30 |
| UA | 85 | 7.1 ± 1.0 | 6000 ± 2455 | 17.9 | 21 |
| USC | 25 | 5.9 ± 0.7 | 6118 ± 1550 | 18.0 | 35 |
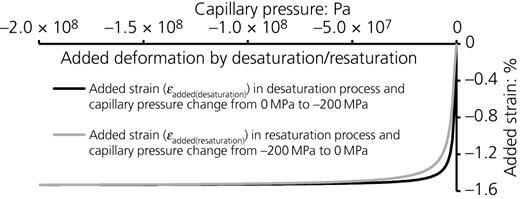
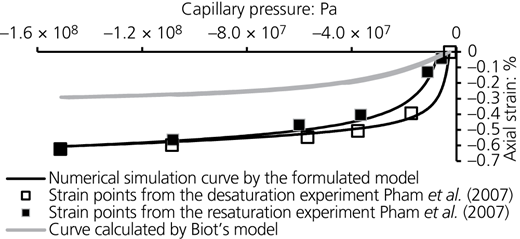
Figure 2 compares the measured free swelling/shrinkage of the COx Claystone during a cyclic variation in capillary pressure (Zhang et al., 2010) against the values predicted in this work by the standard Biot’s model. The measured COx deformation is about three times larger than that computed by the standard Biot’s model, which is therefore incapable of simulating the large deformations of the COx Claystone. To overcome this limitation, this paper enhances the standard Biot’s formulation with an additional law for predicting the extra wetting/drying deformations that are required to match experimental data.

Comparison of free swelling/shrinkage deformations measured during experiments and calculated by the standard Biot’s model
Comparison of free swelling/shrinkage deformations measured during experiments and calculated by the standard Biot’s model
Added deformation model
An added deformation model is formulated on the basis of the difference between the measured swelling/shrinkage of the COx Claystone upon resaturation/desaturation and the predictions from the standard Biot’s model. Figure 2 shows the deformation experienced by the COx Claystone during a change in the degree of saturation from saturation of 100% (Pc = 0 MPa) to 25% (Pc = −200 MPa) and the reversal path from saturation of 25% (Pc = −200 MPa) to 100% (Pc = 0 MPa). In the same figure, the desaturation and resaturation curves calculated by the standard Biot’s model are identical – that is, no hysteresis is predicted.
The added deformation model aims to reproduce the difference between the measured COx desaturation and resaturation curves (ϵCOx(desaturation) and ϵCOx(resaturation) shown in Figure 2) and the calculated standard Biot’s curve (ϵBiot, also shown in Figure 2):
Note that the differences above are defined over a large range of capillary pressure Pc(range) = 200 MPa, which is assumed to cover the entire interval of variation in capillary pressure experienced by the COx Claystone. Equations 1 and 2 are interpolated by the following added deformation equations – namely, the added swelling equation ϵadded(resaturation) and the added shrinkage equation ϵadded(desaturation):
where aw, bw, ak, bk and Δp are model parameters. The graphs of the added swelling equation ϵadded(resaturation) and added shrinkage equation ϵadded(desaturation) are shown in Figure 3.
Equations 3 and 4 are then combined into a single equation, Equation 5, which is used to calculate the added strain within the region delimited by the two limiting ϵadded(desaturation) and ϵadded(desaturation) curves in Figure 3:
where ai, bi and ΔPi are model parameters. Figure 4 shows the calculation method of ai, bi and Δpi when the numerical calculation goes from step (i − 1) to step (i).

If ΔPc(i − 1) > 0 and ΔPc(i) < 0 or if ΔPc(i − 1) < 0 and ΔPc(i) > 0, the model predicts a reversal of the saturation path, which requires recalculation of parameters ai, bi and ΔPi as shown in Figure 5.
Variation in COx Young’s modulus with relative humidity (RH) (Zhang et al., 2013)
If ΔPc(i − 1) > 0 and ΔPc(i) > 0 or if ΔPc(i − 1) < 0 and ΔPc(i) < 0, there is no reversal of the saturation path and the parameters ai, bi and ΔPi keep their original values.
Derivation of Equation 5 provides the added deformation slope dϵadded(i)/dPc(i) from which the strain differential is obtained as
When the capillary pressure increases from Pc0 to Pc1, dϵadded(i) can be integrated within the range between Pc0 and Pc1, and then the strain increment is concluded as follows:
This added deformation model performs very well in the numerical computation of the COx hydromechanical behaviour, and numerical results will be displayed in the next part of this paper.
Constitutive model
Equilibrium equation and elastic parameters
According to Biot’s theory, the equilibrium equation in Equation 8 is written in terms of Biot’s stress, σ = σ e + BS r P c I, which is the sum of the skeleton stress σ e and the capillary stress BS r P c I, where S r is the saturation degree, P c is the capillary pressure and B is Biot’s coefficient (Biot’s coefficient B here is assumed equal to 0.85 according to Armand et al. (2017)). The term f in Equation 8 represents the external load.
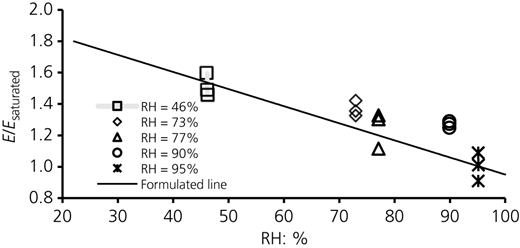
Consistent with previous investigations, the strain of the COx Claystone is linked to Biot’s stress by means of a linear elastic law with values of Young’s modulus that depend on the relative humidity (RH) at equilibrium. In particular, following the experimental work of Zhang et al. (2013), the ratio of the unsaturated Young’s modulus to the saturated one, E/E saturated, is assumed to be a function of RH as shown in Figure 5.
Interpolation of the experimental data in Figure 5 suggests the following form of variation for the stiffness ratio E/E saturated:
Furthermore, the Kelvin equation provides a link that connects capillary pressure and RH at a given temperature, so that the ratio of the unsaturated Young’s modulus to the saturated one, E/E saturated, can be expressed as a function of capillary pressure as shown in Figure 6.

Tensile strength, fracture energy and hydraulic behaviour
The tensile strength, σ t, is an important parameter for predicting the development of damage and plastic strains inside the COx Claystone. Figure 7 shows the variation in tensile strength with capillary pressure as inferred from Andra experiments (Fouché et al., 2004; Volckaert et al., 2004) that recorded the variation in the tensile strength of the material with changing water content.
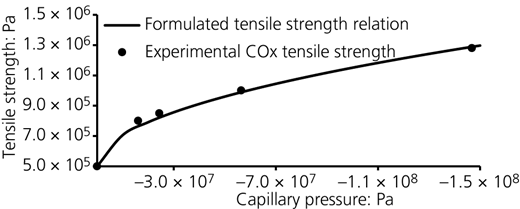
Variation in COx tensile strength with capillary pressure (Fouché et al., 2004; Volckaert et al., 2004)
Variation in COx tensile strength with capillary pressure (Fouché et al., 2004; Volckaert et al., 2004)
The interpolating line in Figure 7 corresponds to the following equation where σ t0 is a reference tensile strength equal to 9 × 10⁵ Pa and P t is a reference capillary pressure equal to −5.9 × 10⁶ Pa:
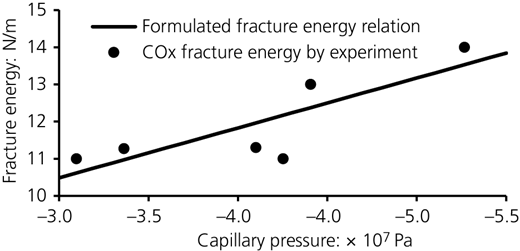
The fracture energy, G f, is a parameter that governs the softening of the material. According to the experiment from Andra, the data have been used here to formulate the straight line in Figure 8, and the relationship between fracture energy G f and capillary pressure P c of the line is described by the following equation:
where G f0 = 6.4 N/m and parameter P gf = −4.8 × 10⁷ Pa.
After examination of experimental data from Zhang et al. (2010), Armand et al. (2017) and Andra (2005), the Van Genuchten (1980) model was used to model the retention behaviour of the COx Claystone:
where S r and P c are the saturation degree and capillary pressure, respectively, while parameters α = 2.6 × 10⁻⁸ and m = 0.45 (Figure 9).
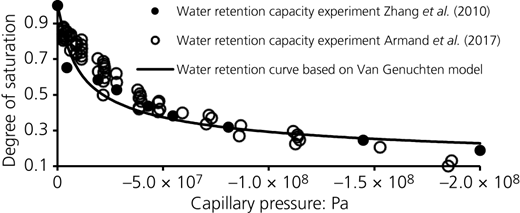
Van Genuchten (1980) water retention curve for the COx Claystone based on experiments by Zhang et al. (2010) and Armand et al. (2017)
Van Genuchten (1980) water retention curve for the COx Claystone based on experiments by Zhang et al. (2010) and Armand et al. (2017)
Plasticity and yielding criterion
The following flow function F(σ) is introduced to define the plastic surface, where B 1, C 1, R 0 and R are four material parameters, with B 1 and C 1 being determined according to the Nadai plastic criterion; R 0 being the maximum tensile stress σ t; and R = MP·ϵ p being the plastic strain, where the plastic strain slope MP is equal to 0.5 times Young’s modulus E and ϵ p is the plastic strain that is derived from the plastic flow equation with respect to the Nadai criterion:
Note that σ v is the von Mises equivalent stress, while B 1 and C 1 depend on the values of Tr σ. In particular, when Tr σ > −4 × (R 0 + R), then B 1 = 1 and C 1 = 2; else, B 1 = 0.25 and C 1 = 3.
The equations of the strain slopes were formulated in Equations 16 and 17, and then deformations were obtained by means of Equation 18:
The expressions of dF/dσ x, dF/dσ xy and Tr[dF(σ)/dσ] are provided in the following (the expressions of dF/dσ y, dF/dσ z, dF/dσ yz and dF/dσ zx would be similar):
Equations 22 and 23 display the plastic parts of strains in the normal and shear directions.
According to Hooke’s law and using ϵ p calculated from the plastic flow equation, the effective stress after plastic deformation can be expressed as follows:
where λ = υE/(1 + υ)(1 + 2υ) and G = E/2(1 + υ); ϵ kk and ϵ ij are total strains; and and are plastic strains. When i = j, δ ij = 1; else, δ ij = 0. υ is Poisson’s ratio.
Damage model
The damage model is based on the continuum mechanics framework developed by Fichant et al. (1999) where the effective stress in the damaged material is related to the macroscopic stress. Here the damage model is coupled with a plastic model and Equation 25 is formulated in terms of elastic strains and directly as follows:
while the effective stress of the damage model is expressed as follows:
where is the tensile part of and is its compressive part. The symbol d indicates the damage variable (note that in the isotropic version of the model, d is taken as a scalar), while α 1 = 15. The evolution of the scalar damage variable follows the normality rule according to the following expression:
where ϵ d0 is the damage threshold, and its value is equal to σ t/E, while β is a hardening/softening variable.
The parameter β commands the slope of the softening curve, and its relation with the fracture energy G f is given in the following, where h is the size of the mesh element:
Finally, the equivalent strain is defined as
where , and are the principal elastic strains.
Results and validation
Identification of material parameters
The material parameters used in the present work are listed in Table 2.
This section provides an example of how these parameter values have been identified on the basis of the results from the uniaxial compression tests performed by Pham et al. (2006) under three different RHs of RH = 32%, RH = 44% and RH = 76%. Assuming a homogeneous water content distribution across the sample, the aforementioned values of RH are converted into corresponding values of capillary pressure by means of Kelvin equation as
This part will display the details of numerical simulation, including the calculation of tensile strength σ t, Young’s modulus E and fracture energy G f. For example, in the experiment, the sample of COx was kept in a humidity chamber under RH of 76% until the stabilisation of the sample mass. At that moment, the sample is considered having homogeneous saturation, and the corresponding capillary pressure in the numerical mesh of the software program is shown in Figure 10.

According to the capillary pressure value, the corresponding values of Young’s modulus E, had calculated the tensile strength σ t and fracture energy G f are 4.5 GPa, 1.1 MPa and 8.9 N/m, respectively. A value of Poisson’s ratio of 0.295 is chosen, while the parameter β in Equation 27 is calculated from Equation 28 by using the corresponding fracture energy value.
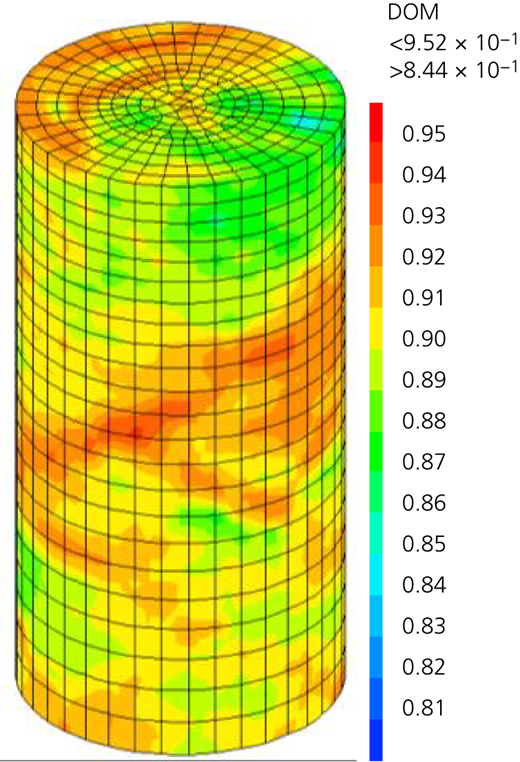
Figure 11 shows the damaged zone of the mesh and the damage values (DOM) at that moment that the material failed, illustrating that the main damaged zone distributes at the cylinder top surface and its middle part. With the vertical compressive load increment, the mesh strain evolves from the initial elastic phase to the elastoplastic phase gradually. In the elastic phase, no damage develops inside the mesh; and the damage value is zero. Damage occurs when the lateral strain is beyond the material plastic limit, during which the vertical strain is 0.49%. After the occurrence of damage, material goes into a hardening process; the vertical stress goes up continuously. When the vertical stress reaches −38 MPa and the vertical strain is 0.9%, the material fails.
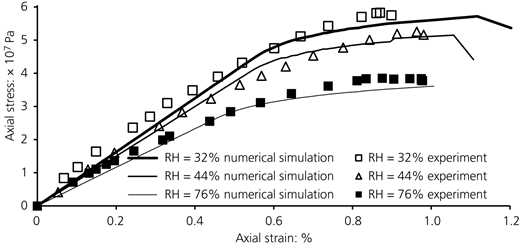
In Figure 12, the experimental results of uniaxial compression tests are compared with the numerical predictions, confirming the ability of the proposed model to reproduce the effect of RH on the non-linear behaviour of the material. The good agreement between numerical simulations and experimental results means that the proposed model is able to describe correctly the basic features of material behaviour at different humidity levels, including the evolution of stiffness, plastic straining, volumetric deformation and softening. The effect of RH is also captured by the proposed model, which correctly predicts an increase in material stiffness as the RH decreases. The experimental value of the peak stress is also adequately predicted at all humidity levels. These numerical results prove that the model performs well in describing the plastic-damage behaviour of the COx Claystone.
Triaxial compression tests
A series of triaxial tests were carried out on the COx Claystone by Andra (2005) and Armand et al. (2017) under different confining stresses of 0, 2, 6 and 12 MPa. All tested samples were taken from horizontal boreholes in the Meuse/Haute-Marne underground laboratory by ensuring that the coring direction was perpendicular to the bedding plane of the claystone. The samples were carefully protected to avoid exchanges of moisture with the outside environment, and before triaxial testing, they were equalised to an RH of 90%. This RH corresponds to a capillary pressure of −14 MPa, a degree of saturation of 94%, a fracture energy of 10.4 N/m and a tensile strength of 1.05 MPa.
Figures 13 and 14 compare the experimental and numerical results in terms of deviator stress, axial strain and lateral strain. The numerical simulation of the test at a confining stress of 0 MPa (Figure 13) shows that in the early stages of deviatoric loading, the strain curve exhibits a linear behaviour, which is consistent with experimental data. This linear behaviour continues until the deviator stress reaches a value of about 20 MPa, at which the material response becomes non-linear and plastic deformations occur. Moreover, the predicted peak deviator stress of 21.4 MPa matches reasonably well the measured value, and the damage values within the numerical mesh at the peak deviator moment are shown in Figure 15.


As for the other triaxial tests at confining pressures of 2, 6 and 12 MPa, the predicted values of the peak deviator stress are 24.1, 29.0 and 35.3 MPa, respectively, which match again reasonably well the corresponding measured values. In general, at all four levels of confining pressure, a reasonably good fit is obtained between experimental data and model simulations, although model simulations tend to predict the attainment of the peak deviator stress in correspondence of slightly lower values of axial strain compared with experimental data.
Free desaturation/resaturation tests
The proposed model has next been employed to simulate the free deformation of the COx Claystone during desaturation and resaturation paths according to the laboratory experiments carried out by Pham et al. (2007) and Zhang et al. (2010).
The desaturation/resaturation experiments by Pham et al. (2007) are shown in Figure 16 together with the results of the numerical simulations. Inspection of Figure 16 indicates that when capillary pressure changes between −60 and −150 MPa, the rate of deformation is relatively low. However, when capillary pressure changes between −2.7 and −60 MPa, the rate of deformation increases considerably. This effect of the capillary pressure range on the deformation of the COx Claystone is well captured by the proposed model.
Unconstrained deformations during desaturation/resaturation tests (Pham et al., 2007)
In general, when the COx Claystone dries from its initial saturation state of around 85% (corresponding to a capillary pressure of −21.5 MPa) to a final saturation state of 23% (corresponding to a capillary pressure of −200 MPa), the amount of shrinkage is relatively small. However, if the following wetting process brings the material back to full saturation, the swelling rate increases gradually, resulting in very high deformations at low levels of capillary pressure as shown in the experiments by Zhang et al. (2010) in Figure 17. Again, this trend of behaviour is faithfully captured by the proposed model.
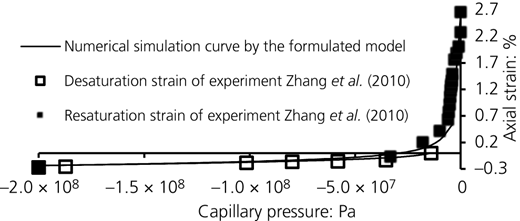
Unconstrained deformations during desaturation/resaturation tests (Zhang et al., 2010)
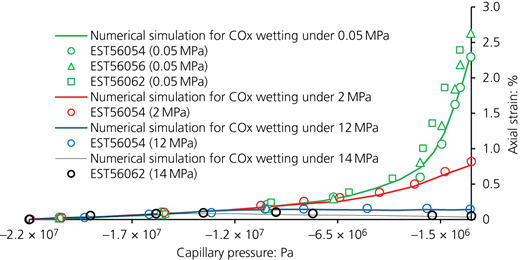
Swelling tests under constant vertical stress
Swelling experiments were performed by Andra (2005) by wetting COx Claystone samples at controlled RHs from 85 to 100% under a constant vertical stress. Samples were wetted under four different vertical loads of 0.05, 2, 12 and 14 MPa. The same experiments were simulated by using the proposed model, and the comparison between numerical and experimental results is shown in Figure 18. Three different wetting tests (samples EST56054, EST56056 and EST56062) were performed with a constant vertical stress of 0.05 MPa, resulting in the measurement of a final vertical swelling strain of 2.29, 2.62 and 2.82%, respectively, and no signs of failure. The corresponding numerical simulation predicted a vertical swelling strain of 2.36%, which falls well within the range of laboratory measurements. A single wetting test (sample EST56054) was performed under a vertical stress of 2 MPa, resulting in the measurement of a peak swelling strain of 0.74% and the observation of softening after the peak. Similarly, the corresponding numerical simulation predicted a peak swelling strain of 0.78% in correspondence of a capillary pressure of −2.15 MPa followed by failure. Two further wetting tests (samples EST56054 and EST56062) were performed under constant vertical stresses of 12 and 14 MPa, which are similar to the stress levels encountered in the geological repository. In these cases, the recorded peak swelling strains were significantly smaller and equal to 0.16 and 0.01%, respectively, while the predicted values were 0.14 and 0.07%, respectively.
Swelling tests under axially fixed conditions
Figure 19 shows the experimental set-up of Zhang et al. (2010) for performing swelling tests on unconfined COx Claystone samples subjected to wetting under axially fixed conditions.
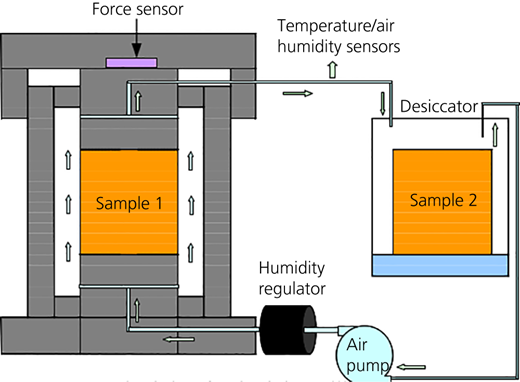
This experimental set-up was devised to minimise the closure of pores during wetting and to achieve a homogeneous distribution of water inside the sample. During these tests, moist air at a fixed value of RH was circulated along the lateral surface of the sample to facilitate the ingress of water vapour inside the material pores and therefore facilitate the hydration of the sample. The resulting changes in saturation and capillary pressure induce swelling of the sample, which is counteracted by the vertical restraint, thus generating a corresponding pressure recorded by the force sensor in Figure 19. The change in capillary pressure was computed from the RH of the air circulated along lateral surface of the sample during the experiment (Figure 20). The numerical simulation of the test was performed according to the following steps.
An initial vertical compression stress of 2 MPa was applied to the sample together with a uniform capillary pressure of −21.5 MPa. At the beginning of the experiment, the RH of the surrounding air was reduced from 81 to 77%, which caused desaturation of the sample, leading to shrinkage deformation. This shrinkage caused a reduction in the computed vertical stress from the initial value of 2 to 0.77 MPa, which is consistent with the measurements from both tests EST20390-1 and EST20390-2 (Figure 20).
Next, the RH of the surrounding air was increased from 77 to 95% gradually, which produced a change in the computed capillary pressure from −28.5 to −6.7 MPa. This led to a resaturation of the sample and a consequent development of swelling strains, which, due to the axially constrained conditions, produced a marked increase in the vertical swelling pressure. Sample failure occurred when the swelling pressure reached a peak value of around 10 MPa. Comparison of numerical and experimental results indicates a good performance of the proposed model from the initial stages of the test up until the failure of the sample.
Finally, the RH of the surrounding air was left to fluctuate at 95 ± 3%, which caused further damage and plastic deformation of the sample and generated a gradual decrease in the swelling pressure. Figure 20 indicates that the proposed model captures well the general decreasing trend of the swelling pressure during the final stages of the test.
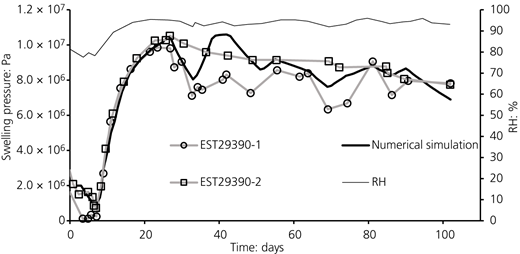
Uniaxial swelling pressure test: numerical predictions plotted against experimental measurements by Zhang et al. (2010)
Uniaxial swelling pressure test: numerical predictions plotted against experimental measurements by Zhang et al. (2010)
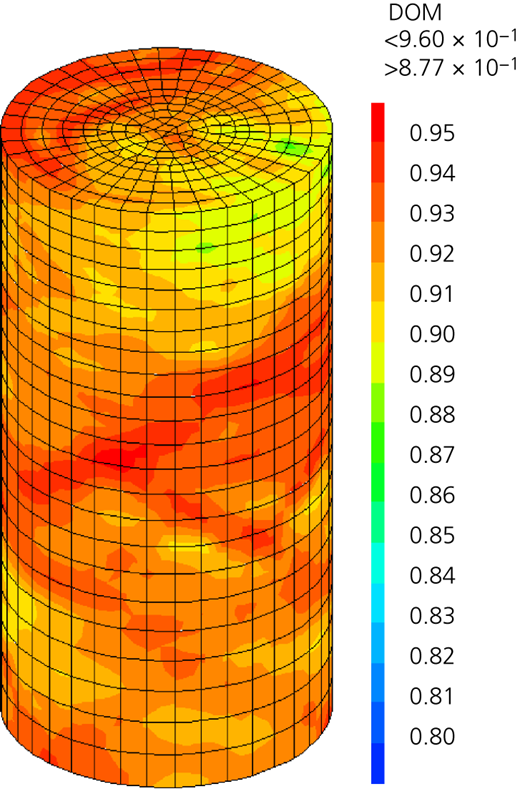
In comparison with the damage values in Figure 11, which are produced by mechanical loads, the damage resulting from resaturation is isotropically distributed in the mesh and the corresponding damage distribution from mechanical load is anisotropic. The isotropic distribution of damage is validated in various experiments of COx resaturation where no evident damage was observed.
Discussion and conclusions
In the present paper, an elastoplastic coupled with damage Biot’s model is proposed for modelling the hydromechanical behaviour of the COx Claystone. In comparisons between uniaxial and triaxial compression tests, suction plays a role analogous to that of confining pressure. The increase in suction during the desaturation of the clay rock increases Young’s modulus, and the phenomenon is reversed for resaturation. The suction pressure improves the interface between the clay grains by greater adhesion. It therefore strengthens the resistance of argillite in the case of low RH and weakens it in the case of high RH. The model accounts for the variation in Young’s modulus, tensile strength and fracture energy with capillary pressure change and is able to represent the mechanical behaviour of the claystone under different saturation and stress conditions.
The standard Biot’s model is not able to exhibit the significant shrinkage/swelling deformation of COx due to the variation in water content. A hysteretic model that accounts for this ‘extra deformation’ is proposed. Numerical simulations show that the model is able to reproduce the swelling effects at the scale of the laboratory. Under free conditions, the main volumetric deformations of COx with changes in water content are produced within a range of capillary pressure from 0 to 60 MPa, and its values can be beyond 6%. However, in the underground laboratory of Meuse/Haute-Marne, the deformation of materials is under geological stresses (12.5–16 MPa), and this model represented it successfully, which means that it can be used to describe the COx deformation under different stress conditions.
Due to its precise performance in describing the deformation of COx, the proposed model will be a basis for simulating the evolution of the crack width and then that of the permeability of a claystone during saturation change. It will be applied to simulate the evolutions of the permeability of the EDZ around tunnels of the planed underground nuclear waste disposal in France. Based on the prediction of material deformation, the description of moisture movement in fractured unsaturated material can be accomplished by means of combining the cubic law and Darcy’s law, and then a time-dependent self-sealing of fractured unsaturated claystone during a resaturation process perhaps can be carried out.
Acknowledgement
The authors gratefully acknowledge the funding by the French agency in charge of radioactive waste disposal (Andra) and the China Scholarship Committee.
