


Enzyme-induced carbonate precipitation (EICP) is a bio-cementation technique and a sustainable method of ground improvement. This study examines the influence of the concentrations of substrates [S 0] and enzymes [E 0] as well as enzyme activity (A E) on the calcium carbonate (CaCO3) precipitation ratio (PR) using 130 test-tube experiments. It was found that the effect of enzyme concentration and activity on PR can be explained using a normalisation of [E s] = [E 0] × A E, where [E s] is the adjusted enzyme concentration. PR increased non-linearly with increasing [E s]/[S 0] and reached 100% at a threshold [E s]/[S 0] value of approximately 20 kU/mol. An exponential function was developed that could capture the relationship between PR and [E s]/[S 0] with reasonable accuracy. This observation was further evaluated with data from the literature consisting of a further 100 test-tube experiments. EICP solutions consisting of [E s]/[S 0] = 20 kU/mol were found to be optimum for soil treatment. The established function was later extended to predict strength gain as measured by the unconfined compressive strength (UCS) and the splitting tensile strength (STS) for EICP-treated soils and could predict the strength gain (UCS/STS) with reasonable accuracy. Results from scanning electron microscopy images, energy-dispersive X-ray spectroscopy and X-ray powder diffraction showed that the precipitated calcium carbonate in test tubes and treated soil was mostly calcite crystals with different morphologies, possibly due to the level of purity of the urease enzyme used.
Notation
- [E0]
concentration of urease enzyme
- [Es]
normalised concentration of urease enzyme
- e0
initial void ratio of untreated Adelaide Industrial sand specimen
- eAT
void ratio after enzyme-induced carbonate precipitation soil treatment
- Dr
initial relative density
- d10
soil particle size at 10% finer
- d50
soil particle size at 50% finer
- emax
maximum void ratio of soil
- emin
minimum void ratio of soil
mass of precipitated calcium carbonate (CaCO3)
- NTC
number of treatment cycles
- qt
splitting tensile strength
- qu
unconfined compressive strength
- [S0]
equimolar concentration of substrate (urea and calcium chloride (CaCl2))
Introduction
Bio-cementation, notably microbially induced carbonate precipitation (MICP) and enzyme-induced carbonate precipitation (EICP), has been used to bind soil particles together through calcium carbonate (CaCO3) precipitation in order to improve their strength and other mechanical properties (DeJong et al., 2006; Hamdan and Kavazanjian, 2016; Ismail et al., 2002; Mitchell and Santamarina, 2005). The precipitation of calcium carbonate in EICP occurs by way of a biogeochemical process – namely, urea hydrolysis catalysed by urease enzyme. Some MICP processes also use the same chemical pathway. Hydrolysis of urea (CO(NH2)2) into ammonium (NH4+) and carbonate ions (CO32−) is the basis of calcium carbonate precipitation in the presence of divalent cations such as calcium (Ca2+) ions, as presented in Equations I–V (Zimmer, 2000).
MICP processes that involve urea hydrolysis require the growth of urease enzyme-producing aerobic bacteria that produce enzymes around their cells (DeJong et al., 2006; Rahman et al., 2020). However, the growth and culturing of bacteria can be a complex process since certain species of bacteria require particular growing conditions such as oxygen (O2) availability, optimum pH and temperature (Almajed, 2017; Hamdan, 2015). The characteristics of these urease enzymes produced by bacterial cells are also not readily known and therefore the understanding of the influence of chemical constituents on calcium carbonate precipitation using catalytic reactions can be difficult (Nassar et al., 2018; Wen et al., 2020). On the other hand, EICP directly applies an enzyme that can be easily characterised before application (Ahenkorah et al., 2021). Potential applications of EICP include bio-cementation and bioremediation in many environmental, construction and engineering settings, such as improving soil strength, reducing soil liquefaction potential, surface erosion control, reducing permeability and heavy-metal contaminant remediation (Ahenkorah et al., 2020a; Hamdan, 2015; Krajewska, 2018; Neupane et al., 2015; Putra et al., 2017a).
Soil improvement through EICP treatment has been studied by several researchers. Yasuhara et al. (2012) achieved a maximum unconfined compressive strength (UCS) of 1.6 MPa for 300 g of Toyoura sand mixed with 0.50 M of urea–calcium chloride (CaCl2) and 1.0 g of urease enzyme (with an activity of 2.95 kU/g). Almajed et al. (2018) also achieved a maximum UCS of 1.27 MPa for Ottawa 20-30 sand after four cycles of treatment using 1.0 M urea, 0.67 M calcium chloride and 3 g/l enzyme (with an activity of 3.50 kU/g). However, the cost of EICP treatment can be high. Commercially available pure urease enzyme is the most expensive component (∼70–80% of the total cost) of the chemical constituents used. Some studies have utilised crude urease extract from different plant sources – for example, jack bean seeds/meal (Khodadadi et al., 2020; Nam et al., 2015), soybeans (Chen et al., 2021; Cuccurullo et al., 2019; Gao et al., 2019; Khodadadi et al., 2020; Lee and Kim, 2020; Pratama et al., 2021; Yuan et al., 2020) and watermelon seeds (Dilrukshi et al., 2018; Javadi et al., 2018; Khodadadi et al., 2020). Such plants can be a cost-effective source of enzyme and can be a viable pathway for large-scale application in the future. However, some extraction techniques may require additional processes or chemicals and may sometimes yield only a small quantity of urease enzymes (Khodadadi et al., 2020; Nam et al., 2015; Song et al., 2020).
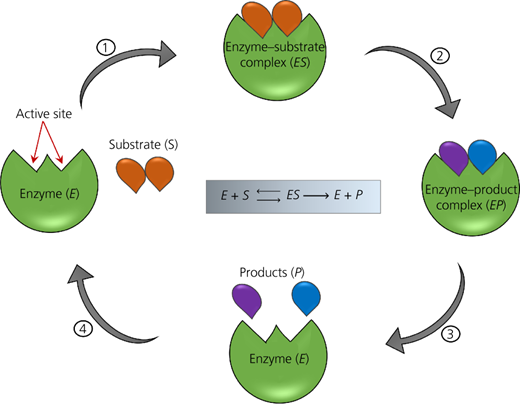
The mechanism involved in urease enzymes catalysing the reaction and precipitation rate in EICP is not yet fully understood (Krajewska, 2009). It often shows a simple Michaelis–Menten behaviour (Michaelis and Menten, 1913). In a typical enzymatic reaction such as this, a substrate (e.g. urea) interacts with the enzyme and forms an enzyme–substrate complex, which is then converted to an enzyme–product complex. After formation of the product, the enzyme is freed up to form another enzyme–substrate complex. The rate of this reaction can be significantly dependent on the concentration and activity of the enzyme, as well as the availability of substrate to form the enzyme–substrate complex (Ahenkorah et al., 2021; Mazzei et al., 2014). The rate of reaction/precipitation can be further influenced by inhibitors such as a high urea concentration (Krajewska, 2009), a limited lifespan of free urease enzyme (Krajewska, 2018), pH and temperature (Ahenkorah et al., 2021).
Most studies on optimising the constituents in EICP treatment solutions have been conducted in test tubes at a standard initial pH and temperature of 8.0 and 25–30°C, respectively (Almajed et al., 2018; Hamdan, 2015; Neupane et al., 2013; Putra et al., 2015). These studies, summarised in Table 1, have generally used parametric approaches to evaluate the influence of the concentration of urea, calcium chloride, urease enzyme and enzyme activity (AE) on the calcium carbonate precipitation ratio (PR – defined as the ratio of the mass of precipitated calcium carbonate to the theoretically possible maximum precipitation mass). Various concentrations have been proposed as being optimal in different studies along with some contradicting observations reported. For example, optimum ingredients for EICP treatment were an equimolar urea–calcium chloride concentration of 0.5 M with 2 g/l urease enzyme in the study by Neupane et al. (2013) and an equimolar concentration of 0.5 M urea–calcium chloride for 1 g/l urease enzyme in the study by Putra et al. (2015). Carmona et al. (2016) considered urease enzyme activity and treated an equimolar concentration of 0.25 M of urea–calcium chloride for 4 kU/l urease enzyme as optimum. Furthermore, Neupane et al. (2013) reported that for an equimolar concentration of urea–calcium chloride, PR increased rapidly with an increase in urease enzyme concentration up to 3 g/l and the trend reversed afterwards. Putra et al. (2015) reported that PR increased with urease enzyme concentration and asymptoted at a maximum value of ∼90%, with no reversal of the trend. Some studies using non-equimolar concentrations of urea–calcium chloride have also reported different concentrations of urea–calcium chloride as optimal. Hamdan (2015) reported an optimum urea–calcium chloride concentration ratio of 1.75:1 (M) for 0.47 g/l of urease enzyme. Almajed et al. (2018) found that a urea–calcium chloride concentration ratio of 1:0.67 (M) for 3 g/l urease enzyme was optimum.
Summary of previous studies on optimising the EICP process
| Reference | [E0]: g/l | AE: kU/g | Urea: M | Calcium chloride: M | Curing time: days | Optimum chemical constituents | ||
|---|---|---|---|---|---|---|---|---|
| [E0]: g/l | Calcium chloride: M | Urea: M | ||||||
| Neupane et al. (2013) | 0.5–4.0 | 2.95 | 0.50–1.00 | 0.50–1.00 | 1 | 2.00 | 0.50 | 0.50 |
| Hamdan (2015) | 0.47 | 32.40 | 0.10–6.00 | 0.20–2.00 | 9 | 0.47 | 1.75/2 | 1.00 |
| Putra et al. (2015) | 1–5 | 2.95 | 0.50–1.50 | 0.50–1.50 | 1–7 | 1.00 | 0.50 | 0.50 |
| Carmona et al. (2016) | 4.0a | 34.31 | 0.25–1.25 | 0.25–1.25 | 14 | 4.00a | 0.25 | 0.25 |
| Putra et al. (2017b) | 1–2 | 2.95 | 0.50–1.00 | 0.50–1.00 | 3 | 2.00 | 0.50 | 0.50 |
| Almajed et al. (2018) | 1–6 | 3.50 | 0.25–1.50 | 0.14–1.50 | 3 | 3.00 | 0.67 | 1.00 |
The concentration of enzyme used in this study was quantified in kilounits per litre
In most previous studies, the influence of the urease enzyme activity has been overlooked or not captured appropriately. Furthermore, none of the previous studies has presented a simple framework that could be used to estimate the required quantities of enzyme and various chemicals for achieving a particular PR. Based on more than 100 test-tube experiments conducted, this study examines the interrelationships among concentrations of enzyme and different chemicals as well as enzyme activity and how they correlate with PR. A large data set from the literature was also compiled to validate the trend observed in this study.
The optimum concentration of chemical constituents established in this study was used for soil treatment. The treated samples were tested for UCS, splitting tensile strength (STS) and the mass of precipitated calcium carbonate (). A model was developed that could predict the amount of precipitated calcium carbonate and strength (UCS/STS) of a particular soil with known concentrations of chemicals used in the treatment process. Scanning electron microscopy (SEM) imaging, energy-dispersive X-ray spectroscopy (EDS) analysis and X-ray powder diffraction (XRD) analysis were used to evaluate the microstructure of the precipitated calcium carbonate in test tubes and in treated soil.
Laboratory investigation
Test-tube experiments
As part of this study, a total of 130 precipitation tests were carried out using 50 ml test tubes containing 20 ml of EICP solution consisting of a mixture of urea, calcium chloride and enzyme (Figure 1(a)). To evaluate the influence of urease enzyme activity – that is, A E – two different types of urease enzyme – namely, high-activity enzyme (HAE) with A E = 40.15 kU/g and low-activity enzyme (LAE) with A E = 3.50 kU/g extracted from jack beans, supplied by Sigma-Aldrich and Fisher Scientific, respectively – were used. The enzyme concentration, [E 0], was varied between 0 and 20 kU/l (corresponding to 0–0.42 g/l for HAE and 0–5.10 g/l for LAE). These ranges of [E 0] were selected based on the ranges of concentrations used in previous studies (Almajed et al., 2018; Neupane et al., 2013; Putra et al., 2015). An equimolar concentration [S 0] of 0–1.3 M for urea–calcium chloride was used in this study after the thesis by Hamdan (2015), who reported that an equimolar ratio of urea–calcium chloride may produce an equal proportion of carbonate and calcium ions required for the production of calcium carbonate, and these ions may become limited if non-equimolar ratios are used. Details of all the tests are presented in Tables 2 and 3.
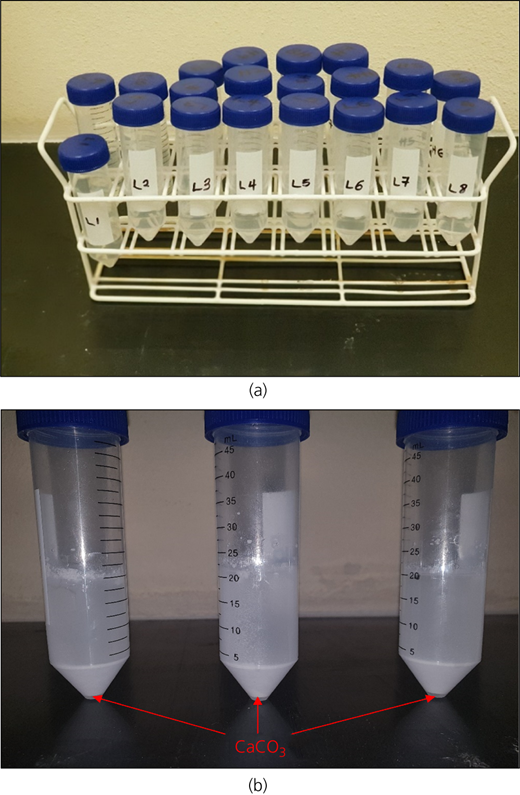
(a) Test tubes with EICP solution during the curing stage; (b) precipitated calcium carbonate in test tubes after curing (for 10 days)
(a) Test tubes with EICP solution during the curing stage; (b) precipitated calcium carbonate in test tubes after curing (for 10 days)
Summary of calcium carbonate precipitation in test tubes for HAE (A E = 40.15 kU/g)
| Test | Urea–calcium chloride, [S 0]: M | Enzyme, [E 0]: g/l | Enzyme, [E s] = [E 0] × A E: kU/l | Theoretical mass: g | Precipitated mass: g | PR: % |
|---|---|---|---|---|---|---|
| H1 | 0.05 | 0.123 | 4.95 | 0.100 | 0.099 | 99 |
| H2 | 0.10 | 0.111 | 4.45 | 0.200 | 0.199 | 99 |
| H3 | 0.10 | 0.323 | 12.95 | 0.200 | 0.200 | 100 |
| H4 | 0.10 | 0.401 | 16.10 | 0.200 | 0.200 | 100 |
| H5 | 0.10 | 0.418 | 16.80 | 0.200 | 0.200 | 100 |
| H6 | 0.15 | 0.105 | 4.20 | 0.300 | 0.288 | 96 |
| H7 | 0.20 | 0.086 | 3.45 | 0.400 | 0.383 | 96 |
| H8 | 0.20 | 0.288 | 11.55 | 0.400 | 0.399 | 100 |
| H9 | 0.20 | 0.366 | 14.70 | 0.400 | 0.400 | 100 |
| H10 | 0.20 | 0.384 | 15.40 | 0.400 | 0.400 | 100 |
| H11 | 0.25 | 0.073 | 2.95 | 0.500 | 0.427 | 85 |
| H12 | 0.30 | 0.061 | 2.45 | 0.601 | 0.448 | 75 |
| H13 | 0.30 | 0.253 | 10.15 | 0.601 | 0.592 | 99 |
| H14 | 0.30 | 0.331 | 13.30 | 0.601 | 0.595 | 99 |
| H15 | 0.30 | 0.349 | 14.00 | 0.601 | 0.592 | 99 |
| H16 | 0.35 | 0.049 | 1.95 | 0.701 | 0.468 | 67 |
| H17 | 0.35 | 0.055 | 2.20 | 0.701 | 0.492 | 70 |
| H18 | 0.40 | 0.036 | 1.45 | 0.801 | 0.412 | 51 |
| H19 | 0.40 | 0.218 | 8.75 | 0.801 | 0.782 | 98 |
| H20 | 0.40 | 0.296 | 11.90 | 0.801 | 0.784 | 98 |
| H21 | 0.40 | 0.314 | 12.60 | 0.801 | 0.793 | 99 |
| H22 | 0.45 | 0.024 | 0.95 | 0.901 | 0.332 | 37 |
| H23 | 0.50 | 0.017 | 0.70 | 1.001 | 0.285 | 28 |
| H24 | 0.50 | 0.183 | 7.35 | 1.001 | 0.946 | 95 |
| H25 | 0.50 | 0.200 | 8.05 | 1.001 | 0.959 | 96 |
| H26 | 0.50 | 0.262 | 10.50 | 1.001 | 0.977 | 98 |
| H27 | 0.50 | 0.279 | 11.20 | 1.001 | 0.979 | 98 |
| H28 | 0.55 | 0.000 | 0.00 | 1.101 | 0.000 | 0 |
| H29 | 0.55 | 0.005 | 0.20 | 1.101 | 0.115 | 10 |
| H30 | 0.60 | 0.148 | 5.95 | 1.201 | 0.925 | 77 |
| H31 | 0.60 | 0.227 | 9.10 | 1.201 | 1.136 | 95 |
| H32 | 0.60 | 0.244 | 9.80 | 1.201 | 1.152 | 96 |
| H33 | 0.70 | 0.113 | 4.55 | 1.401 | 0.927 | 66 |
| H34 | 0.70 | 0.131 | 5.25 | 1.401 | 1.014 | 72 |
| H35 | 0.70 | 0.192 | 7.70 | 1.401 | 1.260 | 90 |
| H36 | 0.70 | 0.209 | 8.40 | 1.401 | 1.262 | 90 |
| H37 | 0.80 | 0.078 | 3.15 | 1.601 | 0.735 | 46 |
| H38 | 0.80 | 0.096 | 3.85 | 1.601 | 0.851 | 53 |
| H39 | 0.80 | 0.157 | 6.30 | 1.601 | 1.171 | 73 |
| H40 | 0.80 | 0.174 | 7.00 | 1.601 | 1.405 | 88 |
| H41 | 0.90 | 0.044 | 1.75 | 1.802 | 0.638 | 35 |
| H42 | 0.90 | 0.061 | 2.45 | 1.802 | 0.614 | 34 |
| H43 | 0.90 | 0.122 | 4.90 | 1.802 | 1.141 | 63 |
| H44 | 0.90 | 0.139 | 5.60 | 1.802 | 1.294 | 72 |
| H45 | 1.00 | 0.009 | 0.35 | 2.002 | 0.132 | 7 |
| H46 | 1.00 | 0.026 | 1.05 | 2.002 | 0.479 | 24 |
| H47 | 1.00 | 0.087 | 3.50 | 2.002 | 0.956 | 48 |
| H48 | 1.00 | 0.105 | 4.20 | 2.002 | 1.005 | 50 |
| H49 | 1.10 | 0.000 | 0.00 | 2.202 | 0.000 | 0 |
| H50 | 1.10 | 0.052 | 2.10 | 2.202 | 0.779 | 35 |
| H51 | 1.10 | 0.070 | 2.80 | 2.202 | 0.888 | 40 |
| H52 | 1.20 | 0.017 | 0.70 | 2.402 | 0.307 | 13 |
| H53 | 1.20 | 0.035 | 1.40 | 2.402 | 0.520 | 22 |
| H54 | 1.30 | 0.000 | 0.00 | 2.602 | 0.000 | 0 |
Summary of calcium carbonate precipitation in test tubes for LAE (A E = 3.50 kU/g)
| Test | Urea–calcium chloride, [S 0]: M | Enzyme, [E 0]: g/l | Enzyme, [E s] = [E 0] × A E: kU/l | Theoretical mass: g | Precipitated mass: g | PR: % |
|---|---|---|---|---|---|---|
| L1 | 0.10 | 1.200 | 4.20 | 0.200 | 0.197 | 98 |
| L2 | 0.10 | 4.600 | 16.10 | 0.200 | 0.199 | 99 |
| L3 | 0.10 | 4.800 | 16.80 | 0.200 | 0.200 | 100 |
| L4 | 0.20 | 1.100 | 3.85 | 0.400 | 0.391 | 98 |
| L5 | 0.20 | 4.200 | 14.70 | 0.400 | 0.398 | 99 |
| L6 | 0.20 | 4.400 | 15.40 | 0.400 | 0.399 | 100 |
| L7 | 0.30 | 0.900 | 3.15 | 0.601 | 0.575 | 96 |
| L8 | 0.30 | 1.000 | 3.50 | 0.601 | 0.585 | 97 |
| L9 | 0.30 | 3.800 | 13.30 | 0.601 | 0.591 | 98 |
| L10 | 0.30 | 4.000 | 14.00 | 0.601 | 0.593 | 99 |
| L11 | 0.40 | 0.800 | 2.80 | 0.801 | 0.776 | 97 |
| L12 | 0.40 | 3.400 | 11.90 | 0.801 | 0.789 | 99 |
| L13 | 0.40 | 3.600 | 12.60 | 0.801 | 0.790 | 99 |
| L14 | 0.50 | 0.600 | 2.10 | 1.001 | 0.819 | 82 |
| L15 | 0.50 | 0.700 | 2.45 | 1.001 | 0.893 | 89 |
| L16 | 0.50 | 3.000 | 10.50 | 1.001 | 0.985 | 98 |
| L17 | 0.50 | 3.200 | 11.20 | 1.001 | 0.988 | 99 |
| L18 | 0.50 | 4.800 | 16.80 | 1.001 | 0.993 | 99 |
| L19 | 0.50 | 5.100 | 17.85 | 1.001 | 0.991 | 99 |
| L20 | 0.60 | 0.400 | 1.40 | 1.201 | 0.742 | 62 |
| L21 | 0.60 | 0.500 | 1.75 | 1.201 | 0.810 | 67 |
| L22 | 0.60 | 2.600 | 9.10 | 1.201 | 1.130 | 94 |
| L23 | 0.60 | 2.800 | 9.80 | 1.201 | 1.158 | 96 |
| L24 | 0.60 | 4.200 | 14.70 | 1.201 | 1.199 | 100 |
| L25 | 0.60 | 4.500 | 15.75 | 1.201 | 1.195 | 99 |
| L26 | 0.70 | 0.200 | 0.70 | 1.401 | 0.433 | 31 |
| L27 | 0.70 | 0.300 | 1.05 | 1.401 | 0.614 | 44 |
| L28 | 0.70 | 2.200 | 7.70 | 1.401 | 1.270 | 91 |
| L29 | 0.70 | 2.400 | 8.40 | 1.401 | 1.290 | 92 |
| L30 | 0.70 | 3.600 | 12.60 | 1.401 | 1.351 | 96 |
| L31 | 0.70 | 3.900 | 13.65 | 1.401 | 1.368 | 98 |
| L32 | 0.80 | 0.000 | 0.00 | 1.601 | 0.000 | 0 |
| L33 | 0.80 | 0.100 | 0.35 | 1.601 | 0.270 | 17 |
| L34 | 0.80 | 1.800 | 6.30 | 1.601 | 1.300 | 81 |
| L35 | 0.80 | 2.000 | 7.00 | 1.601 | 1.360 | 85 |
| L36 | 0.90 | 3.000 | 10.50 | 1.802 | 1.626 | 90 |
| L37 | 0.90 | 3.300 | 11.55 | 1.802 | 1.705 | 95 |
| L38 | 0.90 | 1.400 | 4.90 | 1.802 | 1.200 | 67 |
| L39 | 0.90 | 1.600 | 5.60 | 1.802 | 1.340 | 74 |
| L40 | 1.00 | 1.000 | 3.50 | 2.002 | 1.080 | 54 |
| L41 | 1.00 | 1.200 | 4.20 | 2.002 | 1.180 | 59 |
| L42 | 1.10 | 0.600 | 2.10 | 2.202 | 0.740 | 34 |
| L43 | 1.10 | 0.800 | 2.80 | 2.202 | 0.910 | 41 |
| L44 | 1.10 | 2.400 | 8.40 | 2.202 | 1.829 | 83 |
| L45 | 1.10 | 2.700 | 9.45 | 2.202 | 1.914 | 87 |
| L46 | 1.20 | 0.200 | 0.70 | 2.402 | 0.280 | 12 |
| L47 | 1.20 | 0.400 | 1.40 | 2.402 | 0.530 | 22 |
| L48 | 1.20 | 1.800 | 6.30 | 2.402 | 1.596 | 66 |
| L49 | 1.20 | 2.100 | 7.35 | 2.402 | 1.737 | 72 |
| L50 | 1.30 | 0.000 | 0.00 | 2.602 | 0.000 | 0 |
| L51 | 1.30 | 1.200 | 4.20 | 2.602 | 1.319 | 51 |
| L52 | 1.30 | 1.500 | 5.25 | 2.602 | 1.483 | 57 |
An initial curing period of 10 days was used for all tests based on existing knowledge from the literature (Almajed et al., 2018; Hamdan, 2015; Neupane et al., 2013; Putra et al., 2015). Besides, the rate of calcium carbonate precipitation was assessed over a curing period of 10 days (i.e. at 12, 24, 36, 48 and 72 h and continued for 10 days) using the optimum concentration of chemical constituents established in this study. After curing, the solution in each test tube (Figure 1(b)) was filtered using ashless filter papers (11 μm) and then oven-dried at 60°C. Afterwards, the masses of the dried precipitates remaining on the filter paper and in the test tube were measured and the total precipitated mass was obtained. PR (%) was calculated as the ratio of precipitated total calcium carbonate to theoretical maximum precipitation mass. The theoretical precipitation mass of calcium carbonate (g) was evaluated as C × V × M, where C and V represent the substrate concentration in moles per litre and the volume of the EICP solution in litres, respectively, and M is the molar mass of calcium carbonate (i.e. 100.087 g/mol).
Treatment of soil using EICP and strength tests
Soil sample preparation
A commercially available sand – namely, Adelaide Industrial (AI) sand (emin = 0.68 and emax = 1.05) – was used in the current study. Figures 2(a) and 2(b) show the particle size distribution and one batch of treated specimen, respectively. AI sand particles are poorly graded according to the Unified Soil Classification System (ASTM, 2017a), being angular to subangular in shape. The samples were prepared in a cylindrical poly(vinyl chloride) (PVC) split mould (50 mm diameter × 100 mm height). An initial moisture content of 10% (Figure 3(a)) and void ratio, e0, of 0.93 (Dr = 33%) were maintained during the placement of sand in the mould. Scouring pad filters were placed on both the top and bottom of the mould to minimise possible losses of soil particles during treatment.
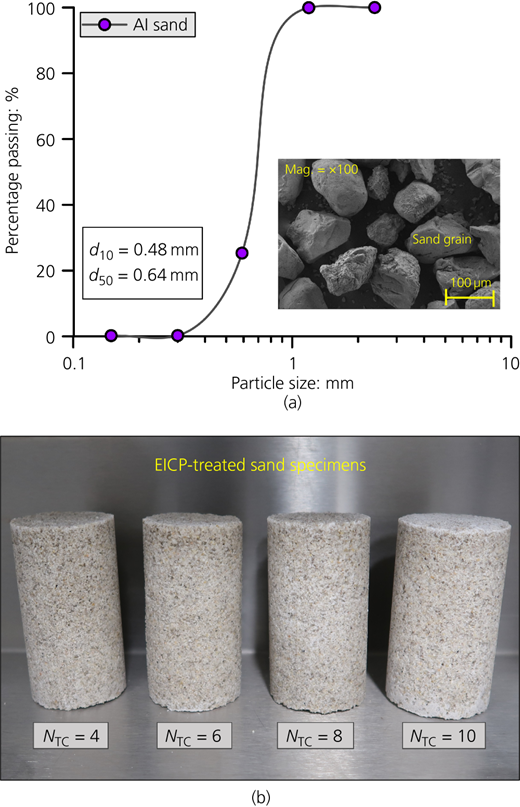
(a) Particle size distribution curve of AI sand; (b) image of EICP-treated sand specimens
(a) Particle size distribution curve of AI sand; (b) image of EICP-treated sand specimens
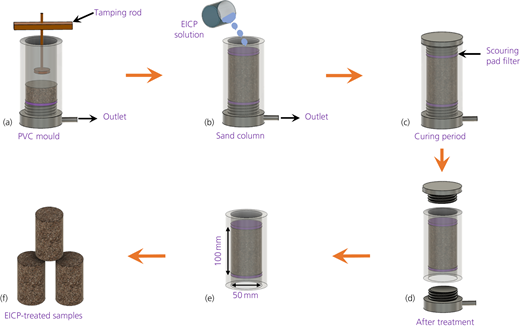
EICP treatment method: (a) preparation of untreated sand columns; (b) injecting EICP solution into the sand column; (c) treatment (curing) of sand columns; (d) drainage of sand columns after treatment period; (e) separation of specimen and PVC mould; (f) EICP-treated samples
EICP treatment method: (a) preparation of untreated sand columns; (b) injecting EICP solution into the sand column; (c) treatment (curing) of sand columns; (d) drainage of sand columns after treatment period; (e) separation of specimen and PVC mould; (f) EICP-treated samples
EICP soil treatment
For EICP soil treatment, a similar approach as described previously by Ahenkorah et al. (2020a) was adopted. The EICP treatment solution consisted of a mixture of enzyme solution (ES) and cementation solution (CS). The ES was prepared by mixing the enzyme powder (LAE or HAE) and a stabiliser (4.0 g/l of non-fat dry milk powder) with deionised water and then filtered using 11 μm filter paper to remove undissolved impurities (Ahenkorah et al., 2020a). Based on the observations from the test-tube experiments, an optimum [Es]/[S0] of 20 kU/mol was used for the soil treatment. This corresponds to an enzyme concentration [Es] of ∼10 kU/l (i.e. 0.25 g/l and 3 g/l for HAE and LAE, respectively) and CS – that is, [S0] – of 0.50 M (equimolar) for urea–calcium chloride. Note, [Es] = [E0] × AE, where [Es] is the adjusted enzyme concentration.
To produce various levels of cementation for different samples, four, six, eight and ten treatment cycles (NTC) were used. Each EICP treatment cycle consisted of one injection of 80 ml (∼1 pore volume) of EICP treatment solution (i.e. a mixture of ES and CS) into the sand column by way of gravity percolation from the top (Figure 3((b)). The injection period for each sample lasted for approximately 5 min. The top and bottom valves of the mould were then closed to prevent solution losses, and the sample was cured at 30°C for ∼2–3 days after each treatment cycle (Figure 3(c)). Therefore, a specimen with ten treatment cycles had a total treatment duration of 3–4 weeks. The curing time was selected based on observations from the test-tube experiments. The flow direction was reversed by flipping the samples upside down in every alternate cycle to promote more homogeneous precipitation (Ahenkorah et al., 2020a; Martinez et al., 2013; Nafisi et al., 2019). After curing in each cycle, the sample was drained under gravity by way of the base outlet (Figures 3(d) and 3(e)) before the next treatment cycle was applied. After the final treatment cycle, the treated specimens were oven-dried at 60°C for 48 h (Ahenkorah et al., 2020a; Whiffin, 2004) until a constant mass was achieved, and the sample was then stored for UCS/STS testing (Figure 3(f)).
Mechanical behaviour testing
A total of 16 EICP-treated specimens (using LAE or HAE) were prepared for UCS (ASTM, 2016) and STS (ASTM, 2017b) testing under a constant rate of deformation of 1.0 mm/min. The strain in the UCS test was calculated by dividing the deformation by the initial length of the sample, and the strain in the STS tests was calculated as the ratio of the diametrical displacement to specimen diameter (ASTM, 2017b). The stress in the STS tests was calculated as σT = 2P/πLD, where σT is the splitting tensile stress; P is the splitting tensile load; and L and D are the length and diameter of the specimen, respectively.
Measurements of calcium carbonate content
After completion of the UCS and STS tests, each sample was divided into six segments. The mass of precipitated calcium carbonate () in each segment was determined using a gravimetric acid washing technique (Choi et al., 2017; Mortensen and DeJong, 2011). This involved the soaking of each specimen segment in 1 M hydrochloric acid (HCl) until it stopped seething. All samples were flushed with tap water before and after the acid washing to remove any residual chemical reagents. The difference in mass of the specimen before and after acid digestion was recorded as the net within the soil (Mahawish et al., 2019; Mortensen and DeJong, 2011; Xiao et al., 2019).
Microstructural analysis of the precipitated calcium carbonate
The influence of urease enzyme activity (HAE and LAE) on the microstructure of the precipitated calcium carbonate in both test tubes and in EICP-treated soil was evaluated using SEM, EDS and XRD analysis. For the SEM and EDS analyses, oven-dried calcium carbonate precipitates from the test-tube experiments and 25 mm cylindrical polished blocks prepared from the untreated and EICP-treated AI sand specimens were used. Each sample was sputter-coated using a high-resolution carbon (C) sputter coater before SEM and EDS were carried out by using a high-resolution Carl Zeiss Merlin field emission gun scanning electron microscope.
For XRD analysis, samples were ground using a sterile mortar and pestle before performing XRD (Panalytical Empyrean). The angle of diffraction (2θ) of the X-rays was set from 10 to 80°, with a step size of 0.02°, and the scanning speed was set at 4°/min using copper (Cu) Kα.
Results
Effect of constituent concentrations on test-tube calcium carbonate precipitation
In Figure 4(a), PR is plotted against the equimolar concentration [S 0] of urea–calcium chloride for a selected range of different enzyme concentrations [E 0]. For all enzyme concentrations (both HAE and LAE), PR decreased with an increase in [S 0]. This was probably due to the enzyme concentration and activity not being high enough to convert all substrates into products within the designated curing period, particularly for high [S 0]. Figure 4(b) plots PR against [E 0] (g/l) for four different substrate concentrations (0.1–1.0 M). For all [S 0], PR increased with an increase in [E 0]. However, HAE and LAE exhibited different rates of gain for PR against [E 0]. The data from Figure 4(b) are replotted in Figure 4(c), but this time, the enzyme concentration is adjusted for its activity (i.e. [E s] in kU/l = [E 0] in g/l × A E in kU/g). The differences in the rate of gain of PR for HAE and LAE reduce significantly. It appears that a simple assumption of a normalised enzyme concentration by accounting for its activity works reasonably well in explaining the changes in PR for different enzyme activities. In Figures 4(b) and 4(c), a threshold is observed beyond which the effect of an increase in urease enzyme concentration is negligible.
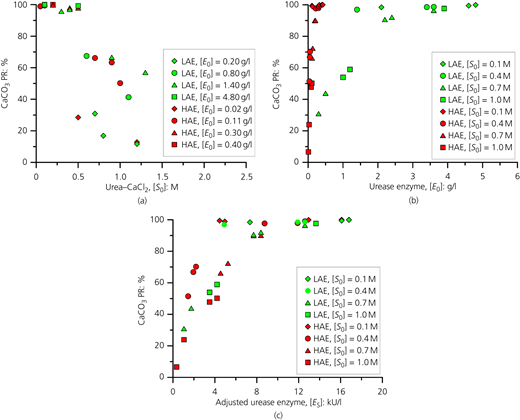
PR plotted against (a) urea–calcium chloride concentration, [S 0]; (b) enzyme concentration, [E 0] (g/l); and (c) [E s] adjusted for activity (kU/l)
PR plotted against (a) urea–calcium chloride concentration, [S 0]; (b) enzyme concentration, [E 0] (g/l); and (c) [E s] adjusted for activity (kU/l)
Figure 5(a) shows the PR from all the tests conducted in this study plotted against [E 0] and [S 0] in a three-dimensional plot. This shows that the PR values from tests using LAE and HAE fall on two distinct surfaces (indicated as surfaces 1 and 2), and when [E 0] was adjusted for its activity (see Figure 5(b)), the two surfaces merged (indicated as surface 3). To evaluate further the existence of the trend observed in Figure 5(b), more than 100 data points for similar test-tube studies were collected from the literature (Almajed et al., 2018; Carmona et al., 2016; Hamdan, 2015; Neupane et al., 2013; Putra et al., 2015). Standard initial pH and temperature values of 7.0–8.0 and 25–30°C, respectively, were maintained in selecting the data sets. The curing period of these data varied from 1 to 14 days. These data are presented in Figure 5(c), and despite having variations in curing period, they follow a similar trend as observed in Figure 5(b).
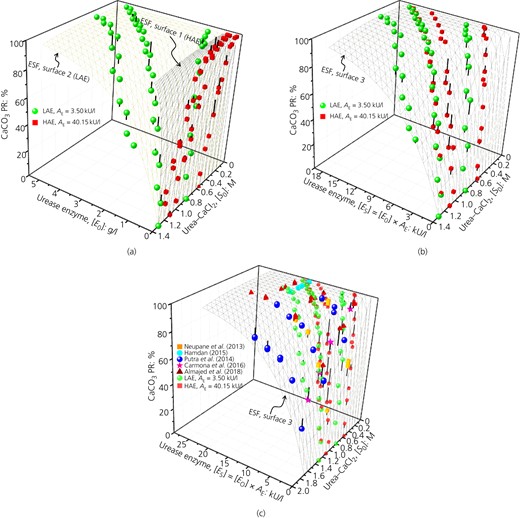
Three-dimensional plot of PR, [E s] and [S 0] with the exponential surface function as a mesh for (a) enzyme concentration, [E 0] (g/l); (b) [E s] adjusted for activity (kU/l); and (c) both data from this study and data from previous studies
Three-dimensional plot of PR, [E s] and [S 0] with the exponential surface function as a mesh for (a) enzyme concentration, [E 0] (g/l); (b) [E s] adjusted for activity (kU/l); and (c) both data from this study and data from previous studies
Three-dimensional non-linear regression analyses were performed using the Matlab R2020a software to determine the best-fit surface function for the observed trend in Figures 5(b) and 5(c). The best three surface functions were chosen, and their relative performances were compared using the root mean square deviation (RMSD), the sum of squares error (SSE) and the coefficient of determination (R 2) as presented in Table 4. It was observed that the exponential surface function (ESF) produced a good correlation with the maximum R 2 and minimum RMSD and SSE (Table 4). The surface function is presented in Figures 5(b) and 5(c), which gave an R 2 of 0.989 and 0.957 for data from this study and data from the literature, respectively.
Performance comparison of different surface functions
| Name | Equation | This study | Data from the literature | ||||
|---|---|---|---|---|---|---|---|
| RMSD | SSE | R 2 | RMSD | SSE | R 2 | ||
| ESF | PR(%) = 100 × [1 − exp(−0.2035 × [E s]/[S 0])] | 3.374 | 1195 | 0.989 | 4.046 | 10 730 | 0.957 |
| PSF | PR(%) = 73.7 + (15.4 × [E s]) − (124.0 × [S 0]) − (0.6 × [E s]2)(51.9 × [S 0]2) 0 ≤ PR ≤ 100, [E s] > 0 and [S 0] > 0 | 4.315 | 1955 | 0.982 | 10.730 | 11 600 | 0.711 |
| RSF | PR(%) = [100 × ([E s]/[S 0])]/[3.5 + ([E s]/[S 0])] | 8.783 | 8178 | 0.969 | 12.304 | 13 517 | 0.903 |
ESF, exponential surface function; PSF, polynomial surface function; RSF, rational surface function
To understand better the attributes of the ESF presented in Table 4, the data points in Figures 5(b) and 5(c) were plotted in PR against [E s]/[S 0] space, and these are shown in Figures 6(a) and 6(b), respectively. All the data fall on a line traced by the ESF in Table 4. It is interesting to note from Figures 6(a) and 6(b) that PR increases with an increase in [E s]/[S 0] up to a threshold value of approximately 20 kU/mol and asymptotes at PR = 100% after that.
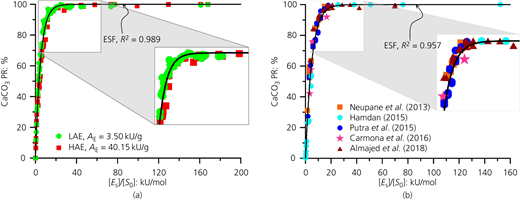
Plot of PR against [E s]/[S 0] for (a) test-tube experimental data using HAE and LAE and (b) data from previous studies
Plot of PR against [E s]/[S 0] for (a) test-tube experimental data using HAE and LAE and (b) data from previous studies
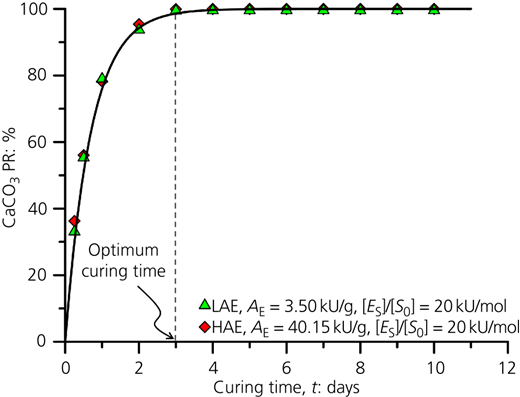
As shown in Figure 7, for the same [E s]/[S 0] of 20 kU/mol, the PR for both HAE and LAE increased steadily with time at the beginning of the test. The maximum PR was obtained after ∼3 days of curing (reaction) time and remained approximately constant until the end of the curing period (10 days). It is worth noting that for a particular [E s]/[S 0], the trend achieved in Figure 7 could be different due to the degradation of urease enzyme over time and/or product inhibition.
Evaluation of EICP-treated AI sands
Precipitated calcium carbonate within EICP-treated sand
An expression for estimating can be developed from the ESF equation presented in Table 4 as follows:
where Mt is the maximum theoretical mass of precipitated calcium carbonate for a given substrate concentration. Figure 8 shows the relationship between the laboratory-measured (using the acid washing technique) and the model-predicted (using Equation 1) for UCS and STS samples in this study and data from previous studies. An excellent agreement was achieved with an R2 of 0.984. Also to be noted is that when [Es]/[S0] is plotted against the PR for treated samples, they fall on a line traced by the ESF.
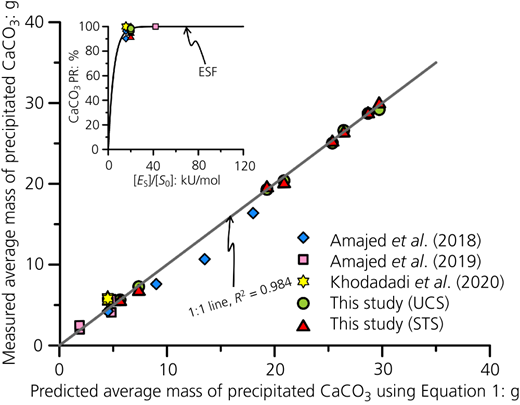
Relationship between model-predicted (using Equation 1) and measured average precipitated calcium carbonate for UCS and STS specimens, compared with data from previous studies
Relationship between model-predicted (using Equation 1) and measured average precipitated calcium carbonate for UCS and STS specimens, compared with data from previous studies
Stress–strain behaviour for UCS and STS
The UCS and STS test results are summarised in Table 5. Typical stress-against-strain curves for different NTC are shown in Figures 9(a) and 9(b) for the UCS tests and in Figures 9(c) and 9(d) for the STS tests. For EICP treatments using an optimum [Es]/[S0] of 20 kU/mol, both UCS and strain at failure increase with an increasing NTC and similar strengths for the treated samples were achieved with a similar number of treatments. For example, samples treated with HAE had UCS values of 0.48 and 2.82 MPa for NTC of 4 and 10, respectively (Figure 9(a)). Corresponding samples treated with LAE achieved UCS values of 0.43 and 2.71 MPa for NTC of 4 and 10, respectively (Figure 9(b)).
Results of UCS and STS tests for AI sand
| ID | Type of enzyme | Test | NTC | After treatment void ratio, eAT | Strength: MPa | [Es]/[S0]: kU/mol | Mt: g | : g | PR: % |
|---|---|---|---|---|---|---|---|---|---|
| H1 | HAE | UCS | 4 | 0.870 | 0.482 | 20 | 7.50 | 7.28 | 97 |
| L1 | LAE | UCS | 4 | 0.880 | 0.432 | 20 | 5.74 | 5.65 | 96 |
| H2 | HAE | UCS | 6 | 0.787 | 1.344 | 20 | 21.24 | 20.39 | 99 |
| L2 | LAE | UCS | 6 | 0.798 | 1.164 | 20 | 19.63 | 19.31 | 97 |
| H3 | HAE | UCS | 8 | 0.758 | 1.961 | 20 | 26.88 | 26.61 | 98 |
| L3 | LAE | UCS | 8 | 0.766 | 1.823 | 20 | 25.81 | 25.04 | 98 |
| H4 | HAE | UCS | 10 | 0.744 | 2.819 | 20 | 30.24 | 29.19 | 97 |
| L4 | LAE | UCS | 10 | 0.746 | 2.713 | 20 | 29.19 | 28.72 | 98 |
| H5 | HAE | STS | 4 | 0.872 | 0.167 | 20 | 7.50 | 6.88 | 92 |
| L5 | LAE | STS | 4 | 0.880 | 0.161 | 20 | 5.74 | 5.62 | 98 |
| H6 | HAE | STS | 6 | 0.793 | 0.272 | 20 | 21.24 | 20.20 | 95 |
| L6 | LAE | STS | 6 | 0.796 | 0.268 | 20 | 19.63 | 19.70 | 100 |
| H7 | HAE | STS | 8 | 0.758 | 0.447 | 20 | 26.88 | 26.48 | 99 |
| L7 | LAE | STS | 8 | 0.765 | 0.421 | 20 | 25.81 | 25.35 | 98 |
| H8 | HAE | STS | 10 | 0.739 | 0.628 | 20 | 30.24 | 30.08 | 99 |
| L8 | LAE | STS | 10 | 0.746 | 0.573 | 20 | 29.19 | 28.85 | 99 |
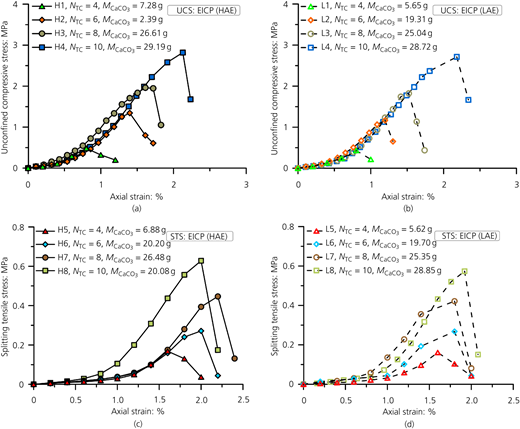
Unconfined compressive stress–strain behaviour of EICP-treated sand for different NTC values using (a) HAE and (b) LAE; splitting tensile stress–strain behaviour of EICP-treated sand for different NTC values using (c) HAE and (d) LAE
Unconfined compressive stress–strain behaviour of EICP-treated sand for different NTC values using (a) HAE and (b) LAE; splitting tensile stress–strain behaviour of EICP-treated sand for different NTC values using (c) HAE and (d) LAE
Figures 9(c) and 9(d) show the splitting tensile stress–strain behaviour of EICP-treated AI sand using HAE and LAE. Similar to the observed UCS test behaviour, STS increases with increasing NTC and the strength gains were similar. For specimens treated with HAE, STS values of 0.17 and 0.63 MPa were achieved for NTC = 4 and 10, respectively (Figure 9(c)). Similarly, specimens treated with LAE produced STS values of 0.16 and 0.57 for NTC = 4 and 10, respectively (Figure 9(d)). The increase in strength with increasing NTC is due to an increased amount of precipitated calcium carbonate within the EICP-treated AI sand specimens, which induces bonding of soil particles (Ahenkorah et al., 2020a; Mahawish et al., 2019).
Improvement of strength with precipitated calcium carbonate
Figures 10(a) and 10(b) show a relationship between peak UCS (qu) and STS (qt) with for EICP-treated AI sand specimens. It is evident from this study that qu and qt increase exponentially with increasing irrespective of the type of enzyme used.
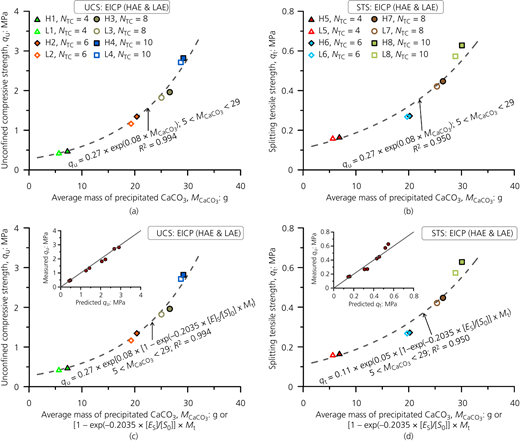
UCS plotted against (a) average and (c) average or Equation 1; STS plotted against (b) average and (d) average or Equation 1
UCS plotted against (a) average and (c) average or Equation 1; STS plotted against (b) average and (d) average or Equation 1
in the exponential trends in Figures 10(a) and 10(b) was replaced by values calculated from the terms on the right-hand side of Equation 1 and plotted in Figures 10(c) and 10(d). Almost identical trends were achieved in the two sets of figures, indicating a good prediction accuracy for Equation 1. This provides a unique relationship between qu and [Eg]/[S0] for the soil treated as part of this study.
Microstructural analysis of precipitated calcium carbonate
SEM and EDS analysis
Figures 11(a) and 11(b) show SEM images of precipitated calcium carbonate in the test tubes using LAE and HAE. The use of LAE led to precipitation of a significant quantity of anhedral calcite crystals, while the use of HAE resulted mainly in euhedral calcites. The difference in morphology was possibly due to the presence of impurities in the grade of urease enzyme used (Ahenkorah et al., 2020b).
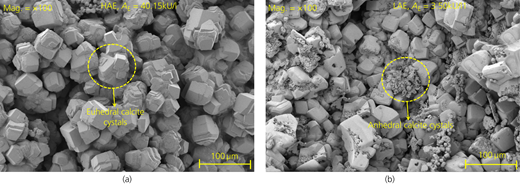
Microstructures of test-tube-precipitated calcium carbonate: (a) SEM images for HAE; (b) SEM images for LAE
Microstructures of test-tube-precipitated calcium carbonate: (a) SEM images for HAE; (b) SEM images for LAE
Figures 12(a) and 12(b) show the SEM images of untreated clean sand while Figures 13(a)–13(d) show the images for different NTC values for treated specimens using HAE. At NTC = 4, a thin layer of precipitated calcium carbonate can be observed around the sand particles (see Figure 13(a)). With increasing NTC, the thickness of the calcium carbonate layer increased and larger clusters of calcium carbonate deposits covering the sand grains were observed (see Figures 13(b)–13(d). A similar observation was made for SEM images of EICP-treated AI sand using LAE (Figures 14(a)–14(d)). By visual inspection, the majority of the calcium carbonate precipitation occurred at particle contacts with a very small proportion of calcium carbonate being deposited within the void spaces, as shown in Figures 13 and 14. The outcome of the SEM analysis was consistent with the earlier findings from the UCS and STS tests.
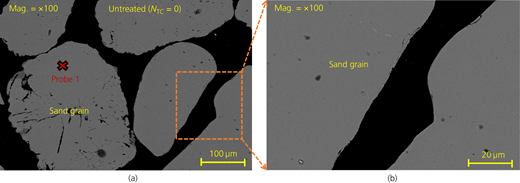
SEM images of untreated AI sand: (a) ×200 magnification; (b) ×500 magnification
SEM images of untreated AI sand: (a) ×200 magnification; (b) ×500 magnification
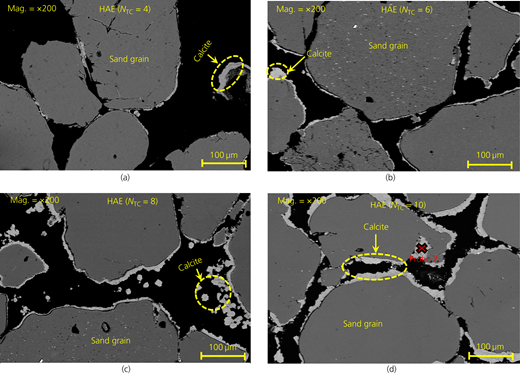
SEM images at ×200 magnification of EICP-treated sand specimens using HAE: (a) 4NTC; (b) 6NTC; (c) 8NTC; (d) 10NTC
SEM images at ×200 magnification of EICP-treated sand specimens using HAE: (a) 4NTC; (b) 6NTC; (c) 8NTC; (d) 10NTC
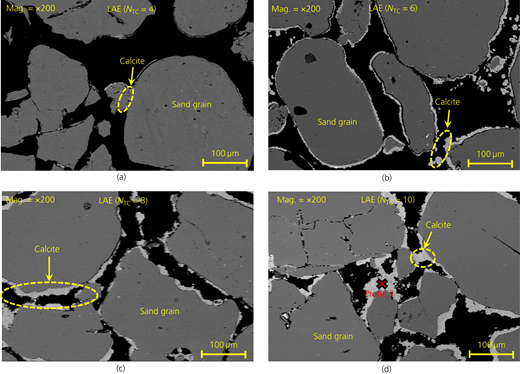
SEM images at ×200 magnification of EICP-treated sand specimens using LAE: (a) NTC = 4; (b) NTC = 6; (c) NTC = 8; (e) NTC = 10
SEM images at ×200 magnification of EICP-treated sand specimens using LAE: (a) NTC = 4; (b) NTC = 6; (c) NTC = 8; (e) NTC = 10
The EDS results for untreated AI sand at probe location 1 are shown in Figure 15(a), which indicates the presence of mainly silica (SiO2) and oxygen (O) with small fractions of carbon and aluminium (Al). Figures 15(b) and 15(c) present the EDS results for probe locations 2 and 3, respectively, and these indicate the presence of mainly calcium (Ca), oxygen and carbon, implying the presence of calcium carbonate. However, since the morphology of the precipitated calcium carbonate cannot be confirmed through EDS, XRD analysis was performed.
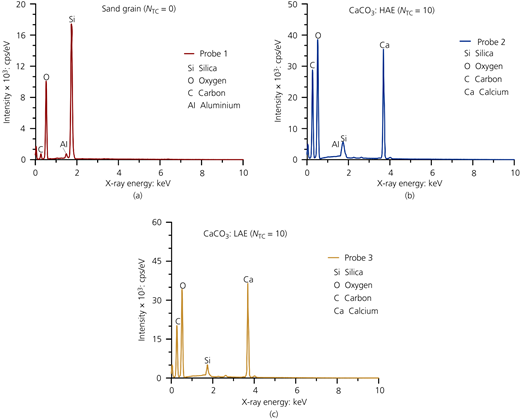
EDS results for selected regions (probes): (a) probe 1, sand grain; (b) probe 2, calcium carbonate precipitate for EICP-treated sand using HAE; (c) probe 3, calcium carbonate precipitate for treated sand using LAE
EDS results for selected regions (probes): (a) probe 1, sand grain; (b) probe 2, calcium carbonate precipitate for EICP-treated sand using HAE; (c) probe 3, calcium carbonate precipitate for treated sand using LAE
XRD analysis
XRD tests were conducted to confirm the morphology of the calcium carbonate crystals observed in the SEM images, and the results are shown in Figures 16(a)–16(e). The XRD results of the precipitated calcium carbonate crystals from the test-tube experiments show high peaks for calcite crystals with minor traces of aragonite (for both LAE and HAE), as shown in Figures 16(a) and 16(b), respectively. Figure 16(c) shows the XRD analysis for the untreated clean AI sand where only traces of quartz can be found. Figures 16(d) and 16(e) show high peaks of quartz and calcite crystals with minor traces of aragonite for EICP-treated samples using HAE and LAE.
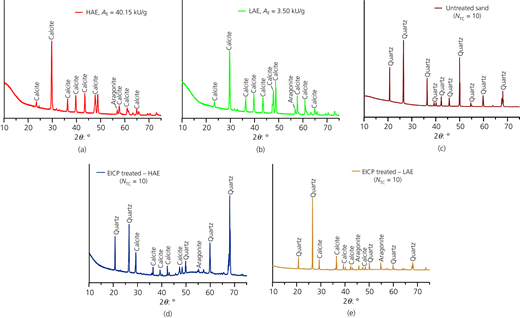
XRD spectra of (a) test-tube-precipitated calcium carbonate using HAE; (b) test-tube-precipitated calcium carbonate using LAE; (c) untreated AI sand; (d) EICP-treated sand using HAE; (e) EICP-treated sand using LAE
XRD spectra of (a) test-tube-precipitated calcium carbonate using HAE; (b) test-tube-precipitated calcium carbonate using LAE; (c) untreated AI sand; (d) EICP-treated sand using HAE; (e) EICP-treated sand using LAE
Discussion
The observations made from the test-tube experiments indicate that for each [S0], a particular amount of enzyme is needed to reach a particular value of PR and the quantity of enzyme needed is also dependent on its activity. This indicates that the substrate concentration, the enzyme concentration and the activity of the enzyme all influence PR. It should be noted that for the same substrate concentration, an increased quantity of enzyme or an increase in enzyme activity resulted in an increase in the value of [Es]/[S0] as shown in Figure 6. An increase in [Es]/[S0] beyond a threshold value of ∼20 kU/mol did not affect the PR. The threshold value of [Es]/[S0] to achieve PR = 100% was likely to be different if a different set of experimental parameters such as temperature or pH was chosen.
During urea hydrolysis, the substrate (urea) binds the active sites of the enzyme (Figure 17) and after formation of the product is released and becomes free to bind to a new substrate molecule (Robinson, 2015). At a much higher substrate concentration, the active sites of the enzyme become saturated, meaning all the enzymes are engaged in the catalytic reaction and the reaction proceeds at a maximum rate (for the enzyme concentration used). However, the rate of product formation may be significantly influenced by the presence of inhibitors (e.g. product inhibitors) or the degradation of urease enzyme over time (Ahenkorah et al., 2021; Fidaleo and Lavecchia, 2003; Goličnik, 2013). Hence, the mass of product formed over time may be lower than the expected theoretical mass of product formation. One interesting observation that can be made from Figures 6(a) and 6(b) is that, despite using a range of different curing periods (1–14 days), the resulting PR still falls on the same line, and for a large proportion of the data points (PR<100%), the effect of curing time is not obvious apart from the small scatter observed in Figure 6(b). This indicates that the reaction rate is influenced by either product inhibition or degradation of enzymes and these effects are being indirectly captured by the ESF.
By using an optimum constituent concentration (i.e. [Es]/[S0] = 20 kU/mol), it was found that the strengths obtained from both UCS and STS tests were not affected by the types of enzyme – that is, HAE and LAE. The average calcium carbonate PR for the EICP-treated sand specimens was around 97.5% for both HAE and LAE and was very similar to the PR values achieved in the test-tube tests.
The results of the SEM, EDS and XRD analysis indicated that the precipitated calcium carbonate in both the test tubes and soil treatments were mainly calcite crystals. Despite the differences in the morphology of the precipitated calcium carbonate in the test tubes using LAE and HAE, the overall strength behaviours (UCS and STS) for EICP-treated sand specimens were similar. This also suggests that using the optimum chemical constituent concentrations in this study produced similar macro- and micromechanical response irrespective of the type of enzyme used.
Conclusions
The influence of constituent concentration and enzyme activity on the effectiveness and microstructure of precipitated calcium carbonate during the EICP process was examined in this study. The major findings were as follows.
The concentration of the substrate [S0] and enzyme [E0], as well as enzyme activity, affects the PR. The effect of enzyme concentration and activity on PR can be better explained using a normalisation of [Es] = [E0] × activity. PR increased with increase in [Es]/[S0] and reached 100% at a threshold [Es]/[S0] value of approximately 20 kU/mol. Further increases in [Es]/[S0] did not have any effect on PR.
The PR was found to exhibit a non-linear correlation with [Es]/[S0], and a first approximation exponential function was able to capture the relationship with reasonable accuracy. The function also captured the correlation between different chemical constituents for more than 100 data points collected from the literature with reasonable accuracy.
An optimum EICP solution consisting of [Es]/[S0] = 20 kU/mol was used for soil treatment and produced a similar trend for UCS/STS and the mass of precipitated calcium carbonate. Functions were developed to capture the correlation between precipitated calcium carbonate mass and the strength (measured by UCS and STS) for a particular [Es]/[S0] and gave a good prediction with reasonable accuracy.
SEM images showed that the precipitates were calcite crystals with different morphologies and the differences were likely to be caused by the variation in the purity of the urease enzyme used. XRD analysis further indicated that the precipitated calcium carbonate in the test tubes and treated soils were mainly calcite crystals with traces of aragonite.
The findings of this study provide a clear understanding of how the concentration of the chemical constituents in EICP is influenced by the activity of the urease enzyme used. The optimum concentration threshold proposed may be significant for various engineering applications and will in effect increase the efficient use of chemical constituents (particularly urease enzyme), thereby reducing the amount of undesirable by-products for the EICP process.
Acknowledgements
The first author would like to acknowledge the Australian Government Research Training Program scholarship scheme for funding this research. This work was performed (in part) at the South Australian node of the Australian National Fabrication Facility under the National Collaborative Research Infrastructure Strategy.

