


If underground structures built close to the surface lie within a liquefied sand lens, they will be significantly damaged in the case of a seismic event. To achieve an optimal design in terms of depth, diameter and tunnel lining thickness, it is important to consider factors such as ground subsidence, bending moment and axial forces exerted on the tunnel lining. This study intended to perform multi-objective optimisation of relevant tunnel parameters within a liquefied sand lens location under seismic loads. The Flac3D software was used to model the saturated sand lens and determine changes in pore water pressure and effective tension after lens liquefaction. An artificial neural network was used to find optimal values in the genetic algorithm. All optimal design points were obtained per the target function with a revised non-dominated sorting genetic algorithm II algorithm. The results pertaining to depth, diameter and tunnel lining thickness were in opposition to one another, as reducing ground subsidence resulted in increased bending moment and axial force exerted on the tunnel lining. According to the results, it is possible for the designer of the tunnel to use Pareto charts in order to determine the optimal values regarding tunnel depth, diameter and lining thickness within the liquefied sand lens.
Notation
Introduction
In the event of an earthquake, large asymmetrical changes are sometimes observed in soils not susceptible to liquefaction, particularly in proximity to rivers or other large bodies of water. Further investigation has revealed that saturated shale sand lenses are the cause of such changes. Shale sand lenses and their surrounding soil are generally resilient against static loads but quickly become semi-liquid in the presence of dynamic loads. Earthquake events in San Francisco (1906), Alaska (1964), Guam (1993) and Seattle (2001) are examples where liquefaction has occurred within or around such sand lenses and have resulted in extensive damage to structures built in these areas.
Tunnels or other structures built in these types of soils may be affected by liquefaction at the location of the sand lens. This will result in increased pore water pressure and reduced effective tension causing deformations in the tunnel lining and as well as ground subsidence (Hosseini and Azadi, 2012). Vallejo (1988) studied the effect of sand lens liquefaction in clay deposits and calculated the shear fractures caused by liquefaction of the soil; the study showed a cup-shaped subsidence above the sand lens as per Figure 1. Holchin and Vallejo (1995) conducted laboratory experiments on the liquefaction of clay deposits and showed a 70° tension crack at one corner of the sand lens. They also state that their experiment results are consistent with the results obtained from other analyses.
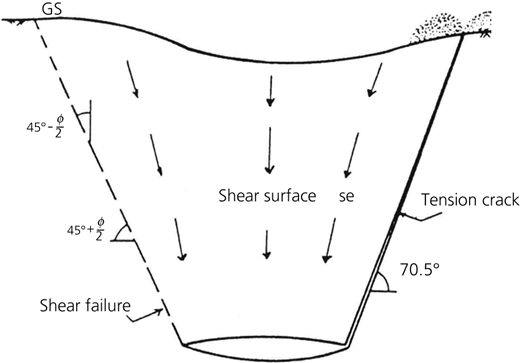
Other studies have also been conducted on this subject. Khodaii (1996) investigated this phenomenon using elastic behaviour models, while Beheshti (1998) used the NISA software solution and stated that the elastic–plastic behaviour model of soil can provide good results in this regard.
Azadi and Bryson (2018) investigated the relationship between the width of the liquefied sand lens and ground subsidence in low-depth tunnels. Zheng et al. (2021) conducted a study on the uplift of underground structures due to liquefaction of sand lenses using the support vector machine model and artificial neural networks. The training and testing of their model were based on a numerical database, and validation of their model was done using results obtained from a centrifuge test. Liao et al. (2019) studied movement control and the various parameters of tunnels built in saturated soils using multi-objective optimisation and stated that it is possible to optimise two opposite target objectives simultaneously.
Su et al. (2015) used an optimised model to determine various tunnel lining parameters. They created numerous models in the Flac3D software while considering various tunnel design parameters such as the type of surrounding stones, depth of the tunnel beneath the ground and lateral earth pressure. They then created an equation for the genetic algorithm and conducted multi-objective optimisation. Finally, they determined the various tunnel lining parameters using the optimised model (Su et al., 2015). Methods using artificial intelligence can be used to find relationships between complex input parameters and target output parameters and are therefore useful in solving geotechnical engineering problems (Suman et al., 2016; Zhang and Goh, 2013). Liquefaction of the soil surrounding the tunnel can increase the forces and moments exerted on the tunnel lining (Rasti and Marandi, 2012). Experiments using shaking tables can also be helpful in determining the forces and moments exerted on the tunnel lining (Haiyang et al., 2019).
Little research has been conducted on the multi-objective optimisation of tunnels built within liquefied sand lenses that are surrounded by soils not susceptible to liquefaction. In most studies, only single-purpose optimisation has been used, and it is hard to find studies that have looked at the opposition of the obtained results with one another. These are among the strong points of the present study compared with previous studies.
Considering the above, the present study aimed to study tunnel diameter, depth and lining thickness at the location of the sand lens and used genetic algorithms to optimise variables that are in opposition to one another simultaneously.
Methodology
There are no specific or special methods to be used in multi-objective optimisation when designing and determining parameters such as tunnel depth, diameter or lining thickness at the sand lens location. Various different approaches have been used for optimisation, but most have involved single-purpose optimisation rather than the simultaneous optimisation of multiple parameters.
The present study aimed to alleviate this shortcoming. In these types of issues, a number of target functions are defined with a desire for them to be minimised or maximised simultaneously. In most cases, these functions are in opposition to one another. This means that improvement in one target function may lead to deteriorations in other target functions. Therefore, an optimum solution that can simultaneously optimise all target functions does not exist, and instead, a series of optimal solutions known as a Pareto-optimal solution or a Pareto curve is to be used. This is the main difference between single-objective and multi-objective optimisation solutions (Pareto and Cours, 1896).
One of the better optimisation algorithms in this regard is the non-dominated sorting genetic algorithm II (NSGAII) algorithm presented by Deb et al. (2002). A revised version of the NSGAII algorithm (Nariman-Zadeh et al., 2005) was used in the present study for the multi-objective optimisation of tunnel depth, diameter and lining thickness inside a liquefied sand lens surrounded by clay deposits. All optimal points from the perspective of the target functions achieved through the revised NSGAII algorithm are presented to the designer for them to choose depending on their needs. It is expected that this approach will enable the calculation of the optimal tunnel depth, diameter and lining thickness within soils susceptible to liquefaction based on ground subsidence, maximum bending moment and axial force.
Concepts in multi-objective optimisation
In multi-objective optimisation problems, the goal is looking to find the design vector , a member of Rn, which can optimise the target function f(X) = [f1(X), f2(X), …, fm(X)]T, a member of Rk, under m, the unequal condition as per Equation 1 and P, the equal condition, as per Equation 2.
Without subtracting from the generality of the problem, suppose that all target functions must be minimised. These multi-objective minimisation problems are known as Pareto problems (Pareto and Cours, 1896) and are discussed further below.
Pareto dominated
Vector U = [u 1, u 2, …, u n] has Pareto dominance over vector V = [v 1, v 2, …, v n] (U ≺ V) if and only if the following expression stands:
Pareto optimised
An X* ∈ Ω point is a Pareto-optimised point (Ω is an acceptable design area that can satisfy Equations 1 and 2) if and only if F(X*) ≺ F(X). This can be described as the following expression:
Pareto set
In multi-objective optimisation, a Pareto set (P*) contains all optimal Pareto vectors.
Evolutionary methods are widely utilised in multi-objective optimisation solutions. These evolutionary algorithms solve problems using a set of initial populations. Many of the issues and complications involved in conventional methods of multi-objective optimisation are solved using these algorithms. For instance, in these methods, all optimal vectors are obtained with a single run of the program, while in other methods only one optimal vector is obtained per iteration.
Numerical analysis
Creating the model
The present study simulated a shale sand lens within a hard clay sediment during liquefaction. The Flac3D software was used for the three-dimensional (3D) modelling of the sand lens within the clay deposit, as well as determining changes in pore water pressure and effective tension affected by liquefaction in the sand lens. This was done in two stages, with the first stage itself comprising two sections. In the first section of the first stage, the soil must reach initial equilibrium, and thus, a static analysis is required. Since the analysis is intended for long-term conditions, the analysis conditions were set to be ‘drained’. The tunnel was then built in the second section of the first stage, which was achieved by activating the tunnel lining element and disabling the soil element. In the second stage of the modelling, dynamic analysis was performed. For this, a dynamic load was exerted at the end of the model to achieve liquefaction conditions. Here, the analysis conditions were set to be ‘undrained’. After analysis was done, the amount of ground subsidence and the forces exerted on the tunnel lining under a dynamic load were evaluated.
Model geometry and boundary conditions in the Flac3D software
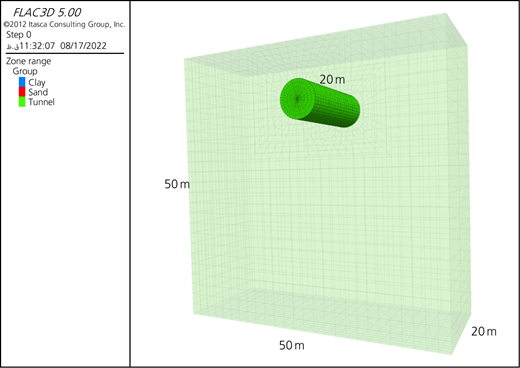
The mesh and model geometry are presented in Figure 2 and were chosen so as to place the stone sediment at the bottom of the model at a depth of 50 m. The width of the model was set wide enough to ensure that the lateral boundaries are adequately distanced from the tunnel itself so as to have no effect on the tunnel. This is equivalent to a distance of 5D from each side of the tunnel, which reduces the error caused by the tension to about 5% and thus enables disregarding the effects of the boundaries on the results of the analysis.
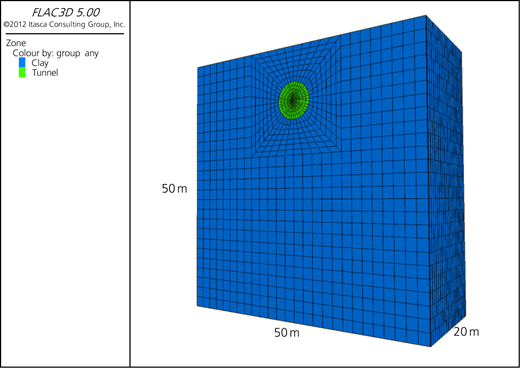
The Flac3D software uses rectangular meshes for its problem solving. The size of the mesh must be small enough so as to allow the propagation of the shear waves generated in the model. According to Lysmer and Kuhlemeyer (1969), the wavelength determines wave propagation in numerical models. The wavelength is itself dependent on the dimensions of the elements along the propagation path. The dimension of the elements must be smaller than one-eighth to one-tenth of the wavelength. Stimulus input waves above 25 Hz were filtered in all analyses (Lysmer and Kuhlemeyer, 1969). Since the soil must be fully saturated to create liquefaction conditions, the water level was set to be equal to the ground level.
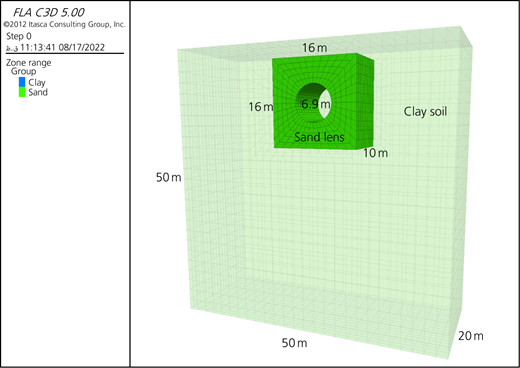
The tunnel was situated inside a sand lens with a width and height of 16 m and a length of 10 m nested within a clay deposit (Figure 3). The sand lens shown was shale and undergoes localised liquefaction under a dynamic load. It is now possible to see the effects of lens liquefaction on the tunnel lining and ground subsidence under different loads and conditions.
Soil parameters
The parameters pertaining to the clay deposit and the liquefied sand lens are presented in Table 1. Specifications of sand lenses based on prior studies (Azadi and Hosseini, 2010; Khoshnoudian and Shahrour, 2002; Liu and Song, 2005), as well as the Verification of Liquefaction Analysis by Centrifuge Studies project (Popescu and Prevost, 1995) in the state of Nevada, USA, were selected. Also, the properties and characteristics of clay were selected based on the study by Hosseini and Azadi (2012).
Soil properties of the clay deposit and the sand lens
| Soil parameter | Behavioural model | Shear modulus: MPa | Bulk modulus: MPa | φ: ° | C: kPa | γ d: kN/m3 | K: m/s |
|---|---|---|---|---|---|---|---|
| Clay deposit | Mohr–Coulomb | 25 | 50 | 30 | 40 | 17 | 10−6 |
| Sand lens | Finn | 20 | 30 | 25 | 0 | 15 | 10−4 |
Considering the aim of evaluating liquefaction effects in the sand lens, the Flac3D modelling must be done in a way as to show changes in volume, pore water pressure and reduced effective tension during liquefaction under dynamic loads. For this purpose, the Finn behavioural model is used, which can model liquefaction based on changes in the amount of strain. This model was presented by Martin et al. (1975) and describes the relationship between changes in bulk strain (Δϵ vd) and cyclic shearing strain (γ) as per the following equation:
In the preceding equation, C 1, C 2, C 3 and C 4 are constant multipliers obtained through cyclical triaxle experiments and are equal to 0.76, 0.52, 0.2 and 0.5, respectively (as per Pashangpishe, 2004). The Mohr–Coulomb method was used to model the clay sediment surrounding the sand lens. This model was chosen based on the study by Hosseini and Azadi (2012).
Applying load
An important influential factor in the dynamic behaviour of soils is their dynamic load. This load is considered to be the main environmental stimulus in analyses depending on its type, magnitude, duration and frequency characteristics. Loads from earthquakes usually take the form of a shear wave emanating from the bedrock towards the surface. Thus, to exert dynamic loads from earthquakes in the present study, the acceleration time histories of seven earthquakes (Table 2) with different frequency contents were used along with a range of input earthquake responses with a scaled maximum acceleration (Figure 4).
Characteristics of the input waves for various earthquakes
| Earthquake | Imperial Valley | Loma Prieta | Northridge | Chi-Chi | Duzce | Montenegro | El Mayor |
| Station | El Centro Array | Capitola | Mulho | Chylol | Lamont | Ulcinj | Cerro Prieto Geothermal |
| Record sequence number | 6 | 752 | 953 | 1244 | 1615 | 4458 | 5825 |
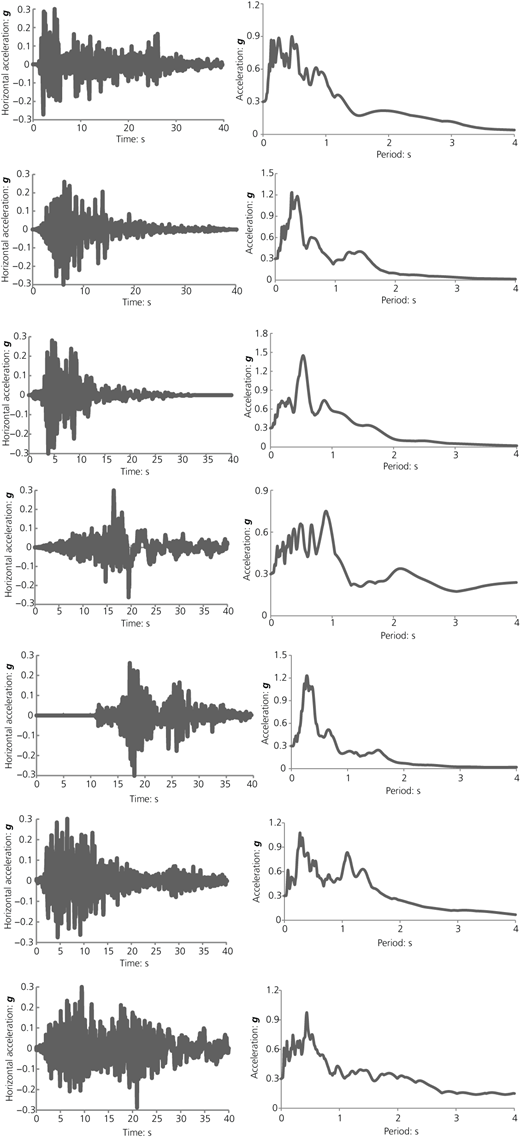
Earthquake response range and the acceleration time histories of input earthquakes with a maximum acceleration of 0.3g and a dampening of 5%
Earthquake response range and the acceleration time histories of input earthquakes with a maximum acceleration of 0.3g and a dampening of 5%
A damping factor of 5% and an open-field condition were considered for the dynamic boundaries. These conditions prevent the reverberation of the waves within the model while allowing the boundaries to act as absorbers. All accelerograms were scaled to a maximum acceleration of 0.3g in the analyses. Selected accelerograms were extracted from the website of the Pacific Earthquake Engineering Research Center (Peer, 2022) from a proximate domain based on ground type, bedrock conditions and distance from faults and were then used in the analyses after certain reforms.
Tunnel lining parameters
The position of the tunnel in the model is shown in Figure 5. The elasticity modulus was set equal to E = 2.236 × 10⁷ kN/m2. These parameters were extracted from a case study related to the Esfahan–Tehran underground metro system.
Modelling analysis
The results of the analysis revealed that exerting the various earthquake loads caused increased pore water pressure within the sand lens, leading to reduced effective tension within the sand lens. The reduced effective tension resulted in the liquefaction of the sand lens around the tunnel, which created new forces and caused deformations in the soil and the tunnel at the location of the sand lens.
Table 3 shows the maximum ground subsidence and bending moment and axial force on the tunnel cover for a tunnel with a diameter of 6.9 m, a tunnel cover thickness of 30 cm and a tunnel depth of 10 m drilled inside a liquefied sand lens and then under different earthquake records. The difference in values obtained in forces and subsidence is due to changes in horizontal acceleration and frequency content in each earthquake record. It must be noted that the water level was set equal to the ground level. The values obtained in Table 3 are considered baseline values in the analysis of results.
Values of axial force, bending moment and ground subsidence in the reference model under different earthquakes
| Earthquake | Imperial Valley | Loma Prieta | Northridge | Chi-Chi | Duzce | Montenegro | El Mayor |
| Axial force: t | 43.9 | 39.57 | 43.23 | 43.09 | 43.98 | 45.51 | 45.69 |
| Bending moment: t m | 8.17 | 7.74 | 9.5 | 8.65 | 7.71 | 8.82 | 9.8 |
| Subsidence: mm | 89 | 81 | 84 | 83 | 90 | 94 | 91 |
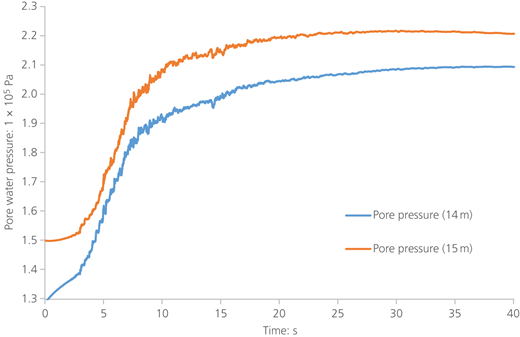
Figure 6 shows the increase in pore water pressure at depths of 14 and 15 m compared with the time (s). This is obtained by exerting the Imperial Valley earthquake load on a tunnel situated at a depth of 10 m, with a diameter of 6.9 m and a lining thickness of 30 cm while inside a sand lens. For example, in the 15 m depth chart, at 0 s and before applying the seismic load, the pore water pressure was equal to 150 kPa. The total pore water pressure in the sand lens after applying the load of the Imperial Valley earthquake at a depth of 15 m increased to nearly 220 kPa. Also, the excess pressure of pore water was close to 70 kPa. This increase in pore water pressure reduced the effective stress and thus led to liquefaction of the sand lens.
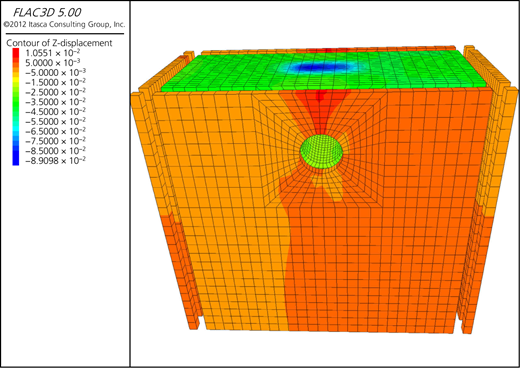
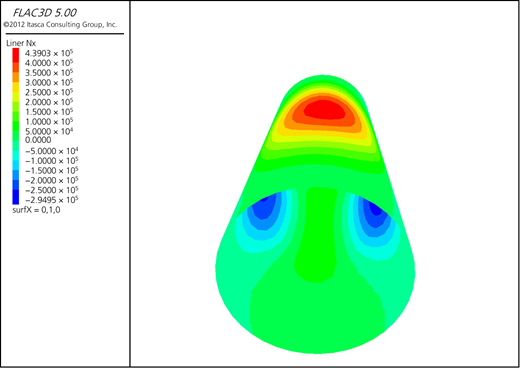
The analysis further reveals that the liquefaction of the sand lens caused ground subsidence above the sand lens as per Figure 7. Figure 8 shows the maximum axial force exerted on the tunnel lining at the location of the sand lens for the Imperial Valley earthquake load record.
Model validation
The results obtained in the present study were compared with and validated by the results of the liquefied sand lens models of Hosseini and Azadi (2012) and Azadi and Bryson (2018). In the aforementioned studies, the tunnel diameter was set to 6.9 m, while the depth was set to 10 m. The lining characteristics included a modulus of elasticity equal to E = 2.236 × 10⁷ kN/m2 and a lining thickness of 0.3 m. The specific weight of the sand lens soil was 15 kN/m2, and the specific weight of the clay deposit was 17 kN/m2. The internal angles of friction of the sand lens and clay deposit were 25 and 30°, respectively. The soil cohesion values of the clay deposit and sand lens were 40 and 0 MPa, respectively. The dimensions of the sand lens were set to a length of 10 m and a radius of 7.5 m around the tunnel perimeter. Exertion of the dynamic load onto the model comprised a sine wave at the base of the model. The frequency, maximum acceleration and duration of the sine wave were 1 Hz, 0.1g and 10 s, respectively. The amount of ground subsidence was 78 mm, while the maximum bending moment exerted on the tunnel lining was found to be 11 t m.
All modelling parameters in the present study were chosen according to the aforementioned researchers with the only difference being that the radius of the sand lens was 8 m and the exerted load was that of the Northridge earthquake with a scaled maximum acceleration of 0.3g for a duration of 40 s. The ground subsidence observed in the present study was 84 mm, while the maximum bending moment exerted of the tunnel at the location of the sand lens was 9.5 t m. This suggests that the results obtained in the present study are similar to those of other researchers. The small difference is likely due to the type of dynamic load exerted at maximum input acceleration and the load duration.
Analysing the inputs and outputs of the 3D model inside the sand lens
Evaluation of the tunnel depth inside the liquefied sand lens
Increasing the tunnel depth inside the sand lens reduces ground subsidence when subjected to earthquake loads due to a less pronounced liquefaction effect. Reducing tunnel depth corresponds to higher amounts of ground subsidence. However, this will also increase the bending moment and axial force exerted on the tunnel lining because of the larger topsoil weight exerted on the tunnel crown. Reducing tunnel depth corresponds to a weaker bending moment and axial force exerted on the tunnel lining. Table 4 shows the amount of ground subsidence and also the bending moment and axial force exerted on the tunnel lining at the sand lens location for a tunnel diameter of 6.9 m and a tunnel lining thickness of 30 cm at various depths for various earthquake loads.
Amounts of ground subsidence, bending moment and axial force exerted on the tunnel lining at the sand lens location at various depths
| Depth: m | Earthquake record | Max. ground subsidence: mm | Max. bending moment: t m | Max. axial force: t |
|---|---|---|---|---|
| 8 | Northridge | 131 | 7.17 | 36.38 |
| 9 | Imperial Valley | 112 | 7.72 | 39.84 |
| 10 | Imperial Valley | 89 | 8.17 | 43.9 |
| 11 | Chi-Chi | 80 | 8.73 | 48.55 |
| 12 | Loma Prieta | 73 | 9.1 | 52.75 |
Evaluation of the tunnel diameter inside the liquefied sand lens
Increasing the tunnel diameter inside the sand lens caused a reduction in ground subsidence. This is because constructing a tunnel with a wider diameter requires a larger amount of liquefiable soil to be excavated. This reduces the amount of liquefaction and corresponds to lower amounts of ground subsidence. Reducing the effects of liquefaction inside the sand lens also reduced tunnel displacement and resulted in increased bending moment and axial force exerted on the tunnel lining. Table 4 shows the amount of ground subsidence and also the bending moment and axial force exerted on the tunnel lining at the sand lens location at a tunnel depth of 10 m and a tunnel lining thickness of 30 cm at various diameters for various earthquake loads.
Effect of the tunnel lining thickness inside the liquefied sand lens
Reducing the tunnel lining thickness inside the liquefied sand lens increased the amount of ground subsidence resulting from the earthquake load. Increasing the lining thickness had the opposite effect. However, changing the tunnel lining thickness had little effect on the amount of observed ground subsidence after the liquefaction of the sand lens. Moreover, reducing the tunnel lining thickness also reduces its resistance to liquefaction by limiting its ability to tolerate the bending moment and axial forces exerted onto it. Increasing the tunnel lining thickness inside the sand lens reduces the deformation of the tunnel lining, thus increasing its weight and ability to tolerate a greater bending moment and axial force caused by liquefaction. Table 5 shows the amount of ground subsidence and the forces exerted on the tunnel lining inside the sand lens for a tunnel depth of 10 m and a diameter of 6.9 m for various lining thicknesses and earthquake loads.
Amounts of ground subsidence, bending moment and axial force exerted on the tunnel lining at the sand lens location at various diameters
| Diameter: m | Earthquake record | Max. ground subsidence: mm | Max. bending moment: t m | Max. axial force: t |
|---|---|---|---|---|
| 6.9 | Imperial Valley | 89 | 8.17 | 43.9 |
| 10 | Northridge | 77 | 9.8 | 45.48 |
| 12 | El Mayor | 66 | 11.21 | 48.27 |
It is apparent that a method capable of simultaneous optimisation of the results pertaining to depth, diameter and lining thickness that may be in opposition to one another is highly valuable. As can be seen from the results obtained, less ground subsidence is accompanied by a higher bending moment and axial force exerted on the tunnel lining inside the sand lens, while the opposite is observed for higher amounts of ground subsidence. This is why simultaneous multi-objective optimisation using NSGAII is required in this instance.
The neural network
As was mentioned before, the aim here is to determine the optimal values pertaining to the tunnel depth, diameter and lining thickness inside the sand lens for a tunnel with specific dimensions and geotechnical characteristics within the minimum and maximum values defined. This would typically require a large number of models to be created in Flac3D or some other software, which is not feasible. Furthermore, the aim of the present study was to find optimal values for tunnel depth, diameter and lining thickness and not values that would merely satisfy the design parameters. To achieve this goal, numerous models must be created using a neural network. This can be achieved by using Matlab, which is a software package for data calculation using numerical matrices.
The number of hidden layers within the network and the number of internal neurons in each layer are among the parameters that determine the accuracy of the network. The neural network program is trained by way of a feedforward network with various functions, and the different layers are taught according to the input and output data (Alborzi, 2009). A bilayer neural network with six hidden neurons was used in the present study to train the inputs and outputs.
Input/output vector used for tunnel depth, diameter and lining thickness
Various models were created in the Flac3D software and were subjected to the various earthquake loads shown in Table 6. Tunnel depth (x 1), tunnel diameter (x 2) and tunnel lining thickness (x 3) were chosen as the inputs of the neural network. Then, based on the analyses of the models, three outputs were chosen as the target functions (per Table 4), which were ground subsidence (f 1), maximum bending moment (f 2) and maximum axial force (f 3) exerted on tunnel lining inside the sand lens.
Amounts of ground subsidence, bending moment and axial force exerted on various tunnel lining thicknesses at the sand lens location
| Thickness: cm | Earthquake record | Max. ground subsidence: mm | Max. bending moment: t m | Max. axial force: t |
|---|---|---|---|---|
| 20 | Chi-Chi | 95 | 6.6 | 41.67 |
| 25 | Duzce | 93 | 7.42 | 42.75 |
| 30 | Imperial Valley | 89 | 8.17 | 43.9 |
| 35 | El Mayor | 87 | 9.12 | 45.1 |
| 40 | Imperial Valley | 85 | 9.88 | 46.03 |
The input range of the neural network for the tunnel depth inside the sand lens was chosen to be between 8 and 12 m. Higher values would result in the tunnel extending outside the sand lens area, and thus, the liquefaction effect would be reduced. The input range of the neural network for the tunnel lining thickness inside the sand lens was chosen to be between 20 and 40 cm. Higher thickness values would be unrealistic due to their cost and time requirements. As for tunnel diameter, the input range was chosen to be between 6.9 and 12 m based on the width of the sand lens and also the feasibility of constructing larger diameter tunnels. To train the neural network and input vectors, they were randomly sorted. This forced the neural network to actually learn the inputs and not merely memorise them.
Error rate of the neural network
Using the data contained in Table 7, the neural network was employed to find relationships between the inputs and outputs of the system based on tunnel depth, diameter and lining thickness. The network is capable of considering the entire range intended for the design. To control the training of the neural network, some parts of the modelling were considered for testing, while other parts were considered for its validation and were thus compared with it. Figure 9 shows the entropy chart related to the improved error rate of the neural network. The predictive error rate for the three output values in the training stage was 0.09144. The predictive error rate for the validation population was 0.4785, while the test set error was 1.248. The network obtained was used as the target function for finding optimal values with the help of a genetic algorithm.
Input/output vector (target function) in the neural network (continued on next page)
| Number | Earthquake record | Neural network input | Target function in the neural network | ||||
|---|---|---|---|---|---|---|---|
| Tunnel depth, x 1: m | Tunnel lining thickness, x 2: cm | Tunnel diameter, x 3: m | Ground surface settlement (f 1): mm | Maximum bending moment (f 2): t m | Maximum axial force (f 3): t | ||
| 1 | El Mayor | 9 | 25 | 6.9 | 115 | 6.98 | 38.84 |
| 2 | Montenegro | 12 | 30 | 10 | 65 | 10.32 | 53.34 |
| 3 | El Mayor | 11 | 40 | 12 | 53 | 13.15 | 55.17 |
| 4 | El Mayor | 9 | 20 | 12 | 87 | 8.57 | 42.87 |
| 5 | Northridge | 12 | 35 | 6.9 | 72 | 10.62 | 53.96 |
| 6 | Chi-Chi | 10 | 35 | 10 | 75 | 10.21 | 47.37 |
| 7 | Imperial Valley | 9 | 25 | 12 | 83 | 9.53 | 44.12 |
| 8 | Chi-Chi | 8 | 35 | 6.9 | 129 | 7.86 | 37.35 |
| 9 | Northridge | 11 | 20 | 12 | 62 | 9.47 | 47.26 |
| 10 | Imperial Valley | 8 | 20 | 6.9 | 136 | 5.7 | 35.08 |
| 11 | Montenegro | 10 | 25 | 12 | 68 | 10.05 | 47.02 |
| 12 | El Mayor | 11 | 25 | 10 | 72 | 9.25 | 47.52 |
| 13 | Northridge | 8 | 25 | 12 | 98 | 9.18 | 40.51 |
| 14 | El Mayor | 10 | 35 | 6.9 | 87 | 9.12 | 45.1 |
| 15 | Loma Prieta | 12 | 30 | 6.9 | 73 | 9.1 | 52.75 |
| 16 | Duzce | 8 | 40 | 6.9 | 125 | 8.7 | 38.2 |
| 17 | Imperial Valley | 12 | 20 | 12 | 57 | 10.03 | 48.82 |
| 18 | Duzce | 9 | 30 | 10 | 93 | 9.31 | 41.18 |
| 19 | Montenegro | 11 | 20 | 10 | 74 | 8.26 | 45.87 |
| 20 | Northridge | 9 | 35 | 12 | 78 | 11.58 | 46.4 |
| 21 | Montenegro | 10 | 35 | 12 | 65 | 11.98 | 49.95 |
| 22 | Loma Prieta | 8 | 25 | 6.9 | 134 | 6.34 | 35.7 |
| 23 | El Mayor | 10 | 30 | 12 | 66 | 11.21 | 48.27 |
| 24 | Duzce | 10 | 25 | 6.9 | 93 | 7.42 | 42.75 |
| 25 | Imperial Valley | 11 | 30 | 10 | 71 | 10.08 | 49.71 |
| 26 | Montenegro | 8 | 40 | 12 | 91 | 11.65 | 44.13 |
| 27 | Chi-Chi | 12 | 35 | 12 | 50 | 13.09 | 56.88 |
| 28 | Duzce | 12 | 25 | 10 | 67 | 9.38 | 50.67 |
| 29 | Northridge | 9 | 40 | 6.9 | 103 | 9.25 | 41.63 |
| 30 | Loma Prieta | 8 | 20 | 12 | 102 | 8.02 | 39.77 |
| 31 | Chi-Chi | 11 | 30 | 6.9 | 80 | 8.73 | 48.55 |
| 32 | Montenegro | 9 | 35 | 10 | 91 | 9.53 | 42.84 |
| 33 | Imperial Valley | 9 | 30 | 6.9 | 112 | 7.72 | 39.84 |
| 34 | Loma Prieta | 11 | 20 | 6.9 | 85 | 7.15 | 43.35 |
| 35 | Northridge | 10 | 30 | 10 | 77 | 9.8 | 45.48 |
| 36 | Northridge | 12 | 30 | 12 | 52 | 12.08 | 54.36 |
| 37 | Imperial Valley | 12 | 25 | 6.9 | 75 | 8.46 | 49.36 |
| 38 | Duzce | 8 | 35 | 12 | 94 | 10.91 | 42.96 |
| 39 | Northridge | 9 | 20 | 10 | 102 | 7.14 | 39.96 |
| 40 | Montenegro | 11 | 35 | 12 | 56 | 12.48 | 53.56 |
| 41 | Loma Prieta | 9 | 30 | 12 | 80 | 10.68 | 45.06 |
| 42 | Montenegro | 11 | 40 | 6.9 | 77 | 10.71 | 51.68 |
| 43 | Duzce | 12 | 40 | 12 | 47 | 13.92 | 59.14 |
| 44 | Imperial Valley | 10 | 30 | 6.9 | 89 | 8.17 | 43.9 |
| 45 | Chi-Chi | 10 | 20 | 10 | 81 | 7.92 | 43.54 |
| 46 | Loma Prieta | 8 | 40 | 10 | 108 | 9.64 | 41.12 |
| 47 | Chi-Chi | 9 | 40 | 12 | 75 | 12.28 | 47.81 |
| 48 | Imperial Valley | 12 | 20 | 10 | 69 | 8.75 | 47.51 |
| 49 | Loma Prieta | 10 | 25 | 10 | 79 | 8.71 | 44.38 |
| 50 | El Mayor | 12 | 20 | 6.9 | 78 | 7.63 | 46.25 |
| 51 | Northridge | 11 | 40 | 10 | 67 | 11.48 | 54.03 |
| 52 | El Mayor | 12 | 35 | 10 | 63 | 11.43 | 55.46 |
| 53 | Loma Prieta | 10 | 40 | 12 | 63 | 12.68 | 51.33 |
| 54 | Loma Prieta | 12 | 25 | 12 | 55 | 11.18 | 51.48 |
| 55 | Duzce | 11 | 35 | 6.9 | 79 | 9.78 | 50.18 |
| 56 | Chi-Chi | 12 | 40 | 6.9 | 71 | 11.93 | 55.02 |
| 57 | Montenegro | 8 | 25 | 10 | 117 | 7.73 | 37.63 |
| 58 | Chi-Chi | 8 | 30 | 12 | 96 | 10.26 | 41.66 |
| 59 | Imperial Valley | 12 | 40 | 10 | 60 | 12.42 | 57.12 |
| 60 | Northridge | 8 | 30 | 6.9 | 131 | 7.17 | 36.38 |
| 61 | Loma Prieta | 11 | 35 | 10 | 69 | 10.89 | 52.12 |
| 62 | El Mayor | 9 | 40 | 10 | 89 | 10.18 | 44.05 |
| 63 | Imperial Valley | 8 | 35 | 10 | 112 | 9.16 | 39.51 |
| 64 | Montenegro | 9 | 20 | 6.9 | 118 | 6.21 | 38.34 |
| 65 | Duzce | 8 | 20 | 10 | 120 | 6.65 | 36.85 |
| 66 | Duzce | 10 | 20 | 12 | 70 | 9.12 | 45.61 |
| 67 | Duzce | 11 | 30 | 12 | 58 | 11.63 | 51.74 |
| 68 | Loma Prieta | 9 | 35 | 6.9 | 108 | 8.41 | 40.62 |
| 69 | Chi-Chi | 11 | 25 | 12 | 60 | 10.41 | 49.65 |
| 70 | El Mayor | 8 | 30 | 10 | 114 | 8.76 | 38.24 |
| 71 | Chi-Chi | 10 | 20 | 6.9 | 95 | 6.6 | 41.67 |
| 72 | Imperial Valley | 10 | 40 | 6.9 | 85 | 9.88 | 46.03 |
| 73 | Chi-Chi | 9 | 25 | 10 | 98 | 8.19 | 40.71 |
| 74 | Northridge | 11 | 25 | 6.9 | 83 | 7.81 | 45.91 |
| 75 | Duzce | 10 | 40 | 10 | 72 | 10.71 | 48.86 |
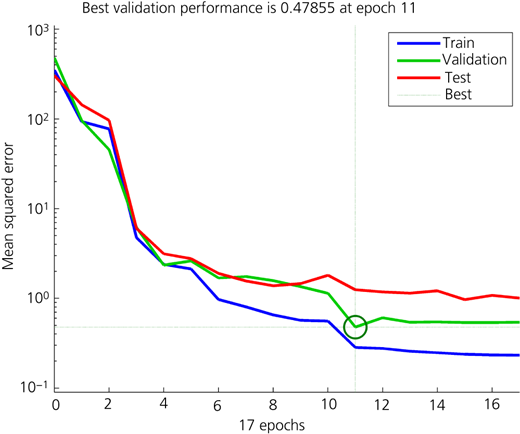
Reduction in detection error rates as the iterations increase in relation to tunnel inputs
Reduction in detection error rates as the iterations increase in relation to tunnel inputs
Figure 10 shows the correlation ratio between the target function and the neural network output, which suggests a high network detection correlation (0.99979).
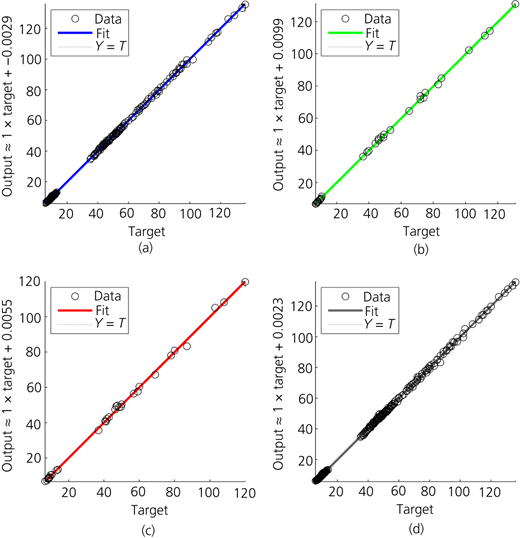
Correlation ratio between the target function and the network output: (a) training, R = 0.99987; (b) validation, R = 0.99981; (c) test, R = 0.99943; (d) all, R = 0.99979
Correlation ratio between the target function and the network output: (a) training, R = 0.99987; (b) validation, R = 0.99981; (c) test, R = 0.99943; (d) all, R = 0.99979
Results
Multi-objective optimisation aided by genetic algorithms
The revised NSGAII algorithm was used for multi-objective optimisation of the problem expounded in the previous section. After optimisation using multi-objective genetic algorithms based on various target functions, results were obtained in the form of Pareto charts. The target function charts were drawn in two dimensions and three dimensions. The target functions that are in opposition to one another must be simultaneously optimised by the designer. The output of the multi-objective optimisation is not an optimal point but rather a set of optimal points described as the Pareto front. These points are non-dominated points. Also, all points in the Pareto chart show optimal points and the designer chooses them based on what is needed in the design.
Optimisation results for tunnel depth, diameter and lining thickness
After optimisation using multi-objective genetic algorithms based on various target functions, the Pareto results are presented as per Figure 11 in terms of the three target functions. As shown in Figure 11, the points of the target function are in opposition to one another. Reducing one target function such as ground subsidence (f1) leads to increases in other target functions such as the bending moment (f2) and axial force (f3). Conversely, the reduction in a target function such as the bending moment (f2) and axial force (f3) results in an increase in ground subsidence (f1).
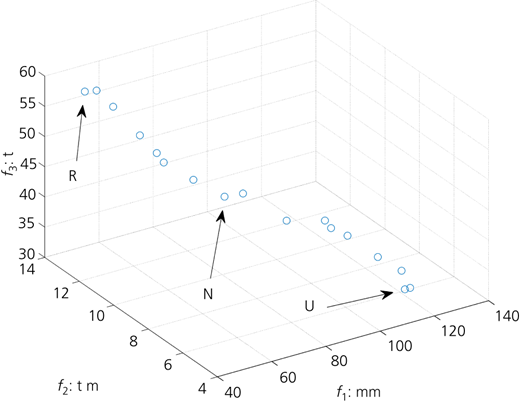
Pareto results pertaining to three target functions – namely, ground subsidence, maximum bending moment and the axial force exerted on the tunnel lining within the liquefied sand lens
Pareto results pertaining to three target functions – namely, ground subsidence, maximum bending moment and the axial force exerted on the tunnel lining within the liquefied sand lens
Therefore, it can be concluded that increasing one objective function leads to decreasing another objective function. Finding a point that can simultaneously optimise all values of the target functions is important. On this basis, the N point was the most optimal point between points R and U in terms of minimising all target functions relative to one another. The N point is the most optimal position for the tunnel considering depth, diameter and tunnel lining thickness within the liquefied sand lens based on the minimisation of all target functions. The design variables and the target function values related to point N are presented in Table 8. The optimisation results of the three target functions are presented in two dimensions and three dimensions in Figures 12 and 13 for better clarification.
Target function values related to point N
| Point | N |
|---|---|
| f1: mm | 75.26 |
| f2: t m | 9.125 |
| f3: t | 45.24 |
| Optimal depth, x1: m | 10.24 |
| Optimal lining thickness, x2: cm | 25.96 |
| Optimal diameter, x3: m | 10.11 |
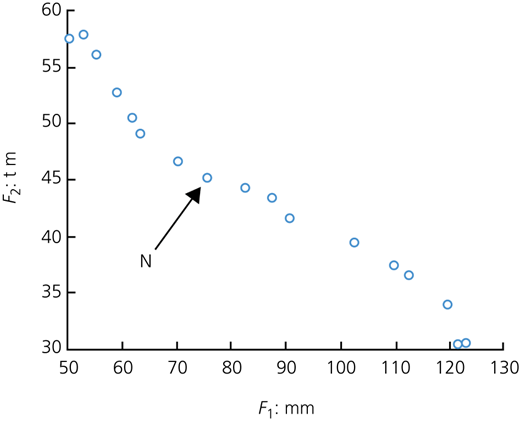
Pareto results pertaining to two target functions – namely, ground subsidence and maximum bending moment exerted on the tunnel lining within the liquefied sand lens
Pareto results pertaining to two target functions – namely, ground subsidence and maximum bending moment exerted on the tunnel lining within the liquefied sand lens
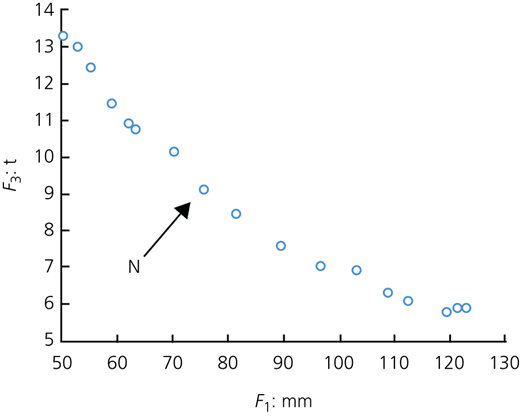
Pareto results pertaining to two target functions – namely, ground subsidence and maximum axial force exerted on the tunnel lining within the liquefied sand lens
Pareto results pertaining to two target functions – namely, ground subsidence and maximum axial force exerted on the tunnel lining within the liquefied sand lens
Conclusion
In the present study, the NSGAII method was used for multi-objective optimisation of tunnels built within liquefied sand lenses that were exposed to various earthquake loads. A number of 3D models were first made with different values for tunnel depth, diameter and lining thickness inside a sand lens. The effects of these variations on ground subsidence, maximum bending moment and maximum axial force exerted on the tunnel lining were evaluated. Also, the teaching and the testing processes between the inputs and outputs of the model were carried out through artificial neural networks. The resulting network was used as a target function in order to find optimal values within the genetic algorithm. The final conclusions based on the data obtained and the analysis performed are as follows.
Increasing the tunnel depth inside the sand lens from 8 to 12 m reduced ground subsidence by 44.3% and increased the maximum bending moment and axial force exerted on the tunnel lining by 21.2 and 31.03%, respectively. Therefore, increasing the tunnel depth inside the sand lens reduces the liquefaction effect of the sand lens and leads to reduced ground subsidence. This increases the topsoil load on the tunnel, and thus, the bending moment and axial force exerted on the tunnel lining are also increased.
Increasing the tunnel diameter inside the sand lens from 6.9 to 12 m reduced ground subsidence by 25.84% and increased the maximum bending moment and axial force exerted on the tunnel lining by 27.11 and 9.05%, respectively. This is because increasing tunnel diameter requires a larger amount of liquefiable soil to be excavated from around the tunnel, and thus, the liquefaction effect of the sand lens and ground subsidence is reduced. This also limits tunnel displacement and increases the bending moment and axial force at the sand lens location.
Increasing the tunnel lining thickness from 20 to 40 cm at the sand lens location increases the maximum bending moment and axial force exerted on the tunnel lining by 33.19 and 9.47%, respectively. This is because a thicker tunnel lining reduces tunnel deformation and increases its weight, which improves tunnel stability against liquefaction at the sand lens location, as the tunnel lining can bear a larger bending moment and axial force at this location. Increased tunnel lining thickness at the sand lens location reduced ground subsidence above the sand lens. Analysis revealed that changing the tunnel lining thickness has little effect on ground subsidence after sand lens liquefaction.
The results obtained regarding tunnel depth, diameter and lining thickness (results (a), (b) and (c)) were such that a reduction in ground subsidence increased the bending moment and axial force exerted on the tunnel lining. Conversely, reduction of the bending moment and axial force exerted on the tunnel lining increased ground subsidence. Considering this issue, multi-objective optimisation using NSGAII was used. Ultimately, the designer can choose a point from the Pareto chart depending on the particular design requirements (ground subsidence, bending moment, axial force) that will simultaneously provide the most optimal position of the tunnel and its diameter and lining thickness inside the sand lens surrounded by clay deposits.
In summary, the use of this method can aid constructive decisions in reaching the determined goals in the design of optimal tunnels that are excavated in a liquefiable sand lens that may be exposed to seismic loads.
Acknowledgement
The authors gratefully acknowledge the assistance provided by the University of California Peer Strong Motion Database.

