Skip to article sections

Deep mixing method (DMM) column quality is commonly characterised by the coefficient of variation (COV) of unconfined compressive strength, which cannot distinguish depth-wise variability from local horizontal heterogeneity. Internal strength variability was characterised for laboratory deep-mixed columns prepared at four blade revolution counts, T2, T4, T6 and T8 (2000, 4000, 6000 and 8000 rev/m), using a miniature DMM apparatus on kaolin clay. Needle penetration tests at 20 positions on 11–12 slices per column provided spatially resolved quNP data. Mean quNP did not increase monotonically with blade revolution count, whereas overall COV decreased from 0.168 at T2 to 0.089 at T8. A two-component variance decomposition revealed distinct spatial patterns: local horizontal heterogeneity dominated at T2 and T4, depth-structured variability dominated at T6, and both components were substantially reduced at T8. Normal and lognormal assumptions were not consistently supported across mixing intensities, with tentative support for a normal approximation found only at T8. Vertical correlation lengths were comparable to or shorter than the 3 cm slice spacing, and horizontal autocorrelation was negligible at the present grid resolution. Overall COV alone is therefore insufficient for DMM quality characterisation; depth-structured columns require denser vertical sampling, whereas locally heterogeneous columns require greater horizontal coverage.

A*2

Stephens-modified Anderson–Darling statistic

C(0)

sample variance of detrended residuals

C(Δ)

sample spatial covariance at lag Δ

COVss

within-slice COV

d

separation distance used in the autocorrelation model

dij

distance between measurement locations i and j

h

horizontal lag distance

lp(θ)

profile log-likelihood function

M

total number of blade wings

M*

number of vertical profiles used in MLE

N

total number of measurement points per column

NP

needle penetration gradient (N/mm)

Nd,Nu

rotational speeds during downward and upward movements (rev/min)

ns

number of measurement points in slice s

p

probability value used in goodness-of-fit tests

qu

unconfined compressive strength, UCT (kPa)

quNP

converted UCT from needle penetration test (kPa)

quNP,s,i

converted strength at point i in slice s

q–uNP

overall column mean of quNP

q–uNP,s

mean quNP of slice s

R(θ)

exponential correlation matrix

Rjk

element of R(θ)

S

number of horizontal slices in a column

T

blade revolution count (rev/m)

Vd,Vu

downward and upward moving speeds of mixing blade (m/min)

ws,i

slice-mean-detrended residual at slice s⁠, position i

zj,zk

vertical coordinates of slices j and k

Δ

spatial lag distance

Δz

vertical slice spacing

ηh

local horizontal variance ratio

ηz

depth-structured variance ratio

θ

exponential correlation-length parameter (cm)

θv

maximum likelihood estimate of vertical correlation length (cm)

ρ(Δ)

empirical autocorrelation function, ACF, at lag Δ

ρ(d)

theoretical ACF at separation distance d

σ2

process variance of exponential covariance model (kPa²)

σh2

local horizontal, variance of quNP (kPa²)

σtotal2

total population variance of quNP (kPa²)

σu,s2

within-slice population variance of slice s (kPa²)

σz2

depth-structured, variance of quNP (kPa²)

σln

lognormal spread parameter

The deep mixing method (DMM) is an in situ ground improvement technique in which cement slurry is mechanically mixed with soft soil to form stabilised columns. Column quality depends on the uniformity of cement distribution, which controls both the mean and variability of unconfined compressive strength, qu (Zuo et al., 2023). Strength variability in DMM has been examined probabilistically since Honjo (1982) and later studies have developed statistical frameworks for interpreting core strength data, representative strength and design strength while accounting for variability, sample size and reliability criteria (Liu et al., 2008, 2017). More recent studies have shown that mean strength and standard deviation alone are insufficient because spatial correlation affects column behaviour and reliability (Namikawa, 2019; Namikawa and Koseki, 2013). Construction and mixing parameters also influence binder distribution and strength variability, although their effects on spatial correlation are not always consistent (Chen et al., 2016; Larsson et al., 2005; Zuo et al., 2023).

Existing characterisations commonly treat a DMM column as a single statistical population and report only the overall coefficient of variation (COV). This approach does not distinguish whether qu variability is organised along the depth axis or scattered locally within horizontal cross-sections. The distinction is important because geotechnical variability is commonly described by both COV and spatial correlation structure, which govern how uncertainty is averaged over space in reliability-based design (Phoon and Kulhawy, 1999). In cement-treated columns, spatial autocorrelation can reduce the overall column strength relative to a uniform column with the same mean strength (Namikawa and Koseki, 2013), and the reliability of DMM column-supported embankments depends on mean strength, COV and spatial correlation length (Wijerathna and Liyanapathirana, 2019). Therefore, two columns with the same overall COV may require different interpretations if one is dominated by depth-structured variability and the other by local horizontal heterogeneity.

The blade revolution count T (rev/m) is the principal mixing-intensity parameter in Japanese DMM practice. The rational mixing number concept of Ota et al. (2000) describes a threshold beyond which further increases in T produce diminishing returns. However, how T governs the internal spatial structure of qu remains unclear. Although Chen et al. (2016) linked binder mass-fraction variability to strength variability and showed that improved mixing reduces overall COV, the partitioning of residual variability between depth-structured and local horizontal components has not been systematically examined.

This study forms part of a broader laboratory programme for evaluating DMM blade performance; however, the present paper focuses on one representative blade design operated at four blade revolution counts: T2, T4, T6 and T8, corresponding to 2000, 4000, 6000 and 8000 rev/m, respectively, with all other mix parameters held constant. Needle penetration tests at 20 positions on 11–12 slices per column provided spatially resolved values of quNP⁠, the converted unconfined compressive strength. Four complementary analyses are reported: (i) descriptive statistics of quNP⁠, establishing the mean and COV trends as a function of T⁠; (ii) decomposition of total qu variance into depth-structured and within-slice components, an analysis that, to the authors’ knowledge, has not previously been applied to DMM strength data; (iii) parametric distribution fitting with formal goodness-of-fit testing; and (iv) spatial autocorrelation analysis with estimation of the vertical correlation length, interpreted within the broader geostatistical framework of scale-of-fluctuation estimation (Lloret-Cabot et al., 2014). Together these provide a more complete spatial characterisation of how mixing intensity governs DMM column quality than is achievable from overall COV alone.

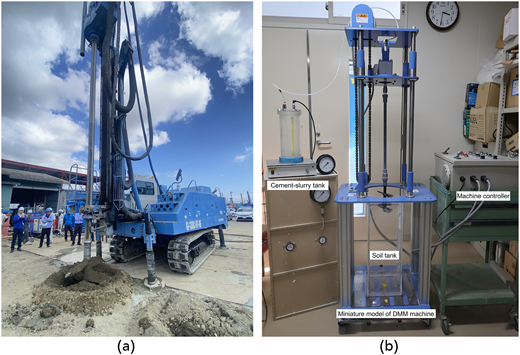
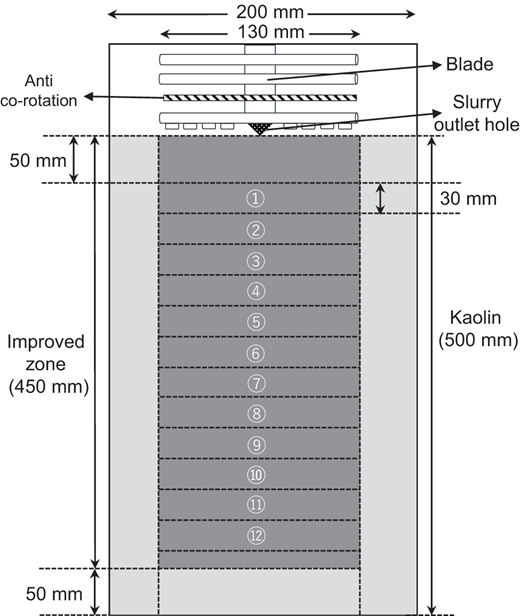
A miniature DMM apparatus was developed to reproduce the slurry-type mechanical mixing process under controlled laboratory conditions. Figure 1(a) shows a representative field-scale DMM machine, while Figure 1(b) shows the laboratory apparatus used in this study. Figure 2 shows the soil tank and experimental configuration. The apparatus comprises a mixing machine, cement-slurry delivery system and soil tank. The soil tank has internal dimensions of 200 mm × 200 mm in plan and 600 mm in height, and was filled with kaolin to a depth of 500 mm. Blade rotation speed can be controlled from 0 to 34 rpm, and vertical penetration and extraction speed from 0 to 1.0 m/min.

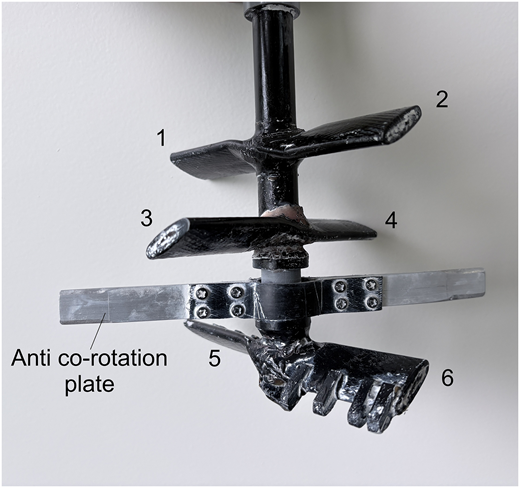
The mixing blade assembly is shown in Figure 3. It comprises six wings along a central shaft of 130 mm dia. (1/10 of a representative full-scale diameter of 1300 mm): four upper mixing wings to agitate the soil and distribute cement slurry, two lower cutting wings to assist penetration, and a horizontal anti-co-rotation plate to suppress co-rotation of the soil mass. Cement slurry was stored in a tank adjacent to the apparatus and delivered pneumatically through an internal conduit to the blade tip, where it was ejected into the surrounding soil. Ejection pressure was maintained at approximately 9 kPa. Since no flow meter was installed, slurry delivery was monitored by tracking the tank-level decrease against pre-calculated target values.

During each test, the blade was rotated and penetrated downward through the kaolin at the prescribed speed, with slurry ejected continuously throughout the 450 mm effective improved zone. On reaching the base, the rotation was reversed and the blade extracted upward at the same speed without further slurry ejection. The effective treated column diameter after mixing and curing was approximately 150 mm, slightly larger than the blade diameter owing to lateral soil displacement during rotation.

The base soil was prepared from powdered kaolin with a liquid limit of 66.6%, a plastic limit of 34.7% and a particle density of 2.61 mg/m³. Purified water was added to achieve a water content of 133.2%, equivalent to twice the liquid limit and corresponding to a liquidity index of 3.1. This high-fluidity condition was adopted for two reasons: it ensures uniform and reproducible filling of the soil box, minimising the influence of initial heterogeneity on the results; and the torque capacity of the miniature apparatus is limited, such that higher soil stiffness would have prevented adequate blade rotation. Although a water content of approximately 1.0–1.5 times the liquid limit is more representative of natural soft clay, the primary objective is to compare strength variability across mixing conditions rather than to reproduce absolute field behaviour.

The binder was a cement-based stabiliser, Solid Ace #100 (Aso Cement Co.), with a density of 3.13 mg/m³. A cement addition rate of 150 kg/m³ and a water-cement ratio of 1.5 were adopted for all mixing conditions. An admixture at 5% of dry cement content was included to enhance slurry fluidity and prevent outlet clogging. These proportions were held constant to isolate the effect of mixing intensity.

Mixing intensity was controlled through the blade revolution count, which is defined as the total number of blade passes per unit length of the improved zone during a single penetration and extraction cycle. Following the standard definition in Japanese DMM (Japanese Cement Association, 2021), T is expressed as:

1

where T is the blade revolution count (rev/m); Nd and Nu are the rotational speeds during downward and upward movements (rev/min), respectively; Vd and Vu are the downward and upward moving speeds of the mixing wings (m/min), respectively; and M denotes the total number of blades composing the mixing wings. In the model tests, M = 6 and Vd = Vu= 0.051 m/min were fixed for all cases. The four mixing conditions examined in this study are summarised in Table 1. These cases are referred to as T2, T4, T6 and T8 corresponding to T = 2000, 4000, 6000 and 8000 rev/m, respectively. The range of T from 2000 to 8000 rev/m was selected to span conditions from clearly under-mixed to very well-mixed states. All cases used identical soil preparation, cement type, cement dosage, slurry mix proportion and curing condition, so that differences in the resulting qu distribution can be attributed solely to the difference in mixing intensity.

After mixing, each column was cured in the soil box at 20 ± 2°C for 7 days and then extracted. Each extracted column had a total length of approximately 450 mm and was cut into 11 or 12 horizontal slices of approximately 30 mm thickness using wire saws, starting from a depth of 50 mm. Exposed surfaces were smoothed with a straight blade knife to ensure reliable needle contact. Needle penetration tests were performed on each exposed surface in accordance with JGS 3431-2012 using a table-mounted device. The needle was pushed perpendicularly into the surface at a constant rate, and the applied load P (N) and penetration depth L (mm) were recorded until L = 10 mm. The needle penetration gradient NP (N/mm) was computed as P/L⁠, and the converted unconfined compressive strength quNP was obtained from the empirical formula of Uchida et al. (2004):

2

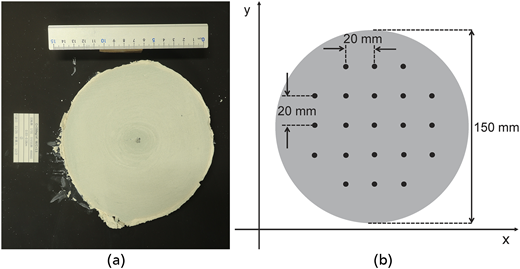
Figure 4(a) shows a typical exposed slice surface after cutting and smoothing. On each exposed surface, a square measurement grid with 20 mm spacing in both the x- and y-directions was established, as shown in Figure 4(b). The original grid comprised 21 points, but the centre point was excluded because cement tended to accumulate near the blade axis, giving a strength response unrepresentative of the surrounding mixed soil. The remaining 20 points were used at every slice depth and for all mixing conditions, ensuring spatial consistency throughout the dataset.

Table 2 summarises the overall statistical characteristics of the quNP for the four mixing conditions. Each of T2, T4 and T6 comprised 240 measurements from 12 slices, whereas T8 comprised 220 measurements from 11 slices because slice 12 was lost during specimen extraction. The grand mean quNP ranges from 136.5 kPa at T8 to 152.3 kPa at T4, with no monotonic trend, indicating that increasing blade revolution count mainly redistributes and homogenises strength rather than systematically increasing it. Overall COV decreases progressively from 0.168 at T2 to 0.089 at T8, consistent with improved mixing uniformity. Skewness also varies systematically. At T2, the distribution is moderately right-skewed (skewness = 0.68), indicating some locally high-strength zones. Skewness increases substantially at T4 and T6 (1.37 and 1.42, respectively), reflecting extreme high-strength values and, for T6, distributional distortion arising from the depth-wise strength gradient. At T8, skewness approaches zero (−0.15), consistent with near-uniform mixing.

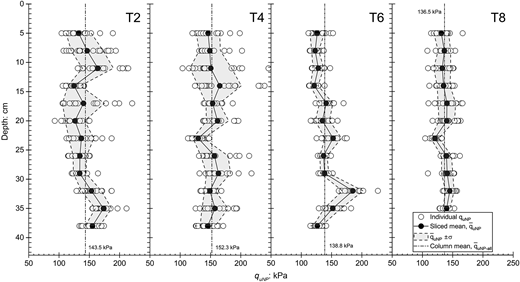
Figure 5 shows the vertical distribution of quNP for the four mixing conditions; Table 3 presents, for each case, the depth-wise range of slice means and the within-slice coefficient of variation COVss, computed from the 20 measurement points within each horizontal test plane. Two distinct variability patterns emerge. At T2 and T4, COVss is high and varies substantially between slices. At T2, five of the 12 slices have COVss exceeding 0.15 (maximum 0.246), reflecting incomplete cement dispersion across the horizontal cross-section. At T4, two slices exceed COVss = 0.15 (maximum 0.234), with individual values reaching 245.8 kPa, the maximum recorded.

At T6, within-slice uniformity improves markedly: all 12 slices show COVss below 0.10 (range 0.043–0.094, mean 0.070). However, slice means vary substantially with depth, from 121.4 kPa at 15.5 cm to 184.9 kPa at 33.5 cm, a depth-wise range of 63.5 kPa, the largest across all four cases. This pattern of low within-slice scatter combined with large depth-wise variation in slice means is the defining characteristic of the T6 case and is examined in detail in Section 4. At T8, both aspects of variability are minimised simultaneously. All slices have COVss below 0.11 (range 0.042–0.105, mean 0.074) and the slice-mean range narrows to only 24.6 kPa, confirming near-uniform cement distribution in both the horizontal and vertical directions.

Overall, COV decreases monotonically with T but cannot distinguish a column dominated by local horizontal heterogeneity (T2, T4) from one whose cross-sections are individually uniform but differ systematically with depth (T6). Section 4 decomposes total variance into depth-structured and local horizontal components to quantify this distinction.

Total quNP variance within each column was decomposed into a depth-structured component, reflecting systematic differences in mean strength between depth levels, and a local horizontal component, reflecting point-to-point scatter within each horizontal test plane. Denoting total population variance as σtotal2⁠, the decomposition is:

3

where σz2 is the depth-structured (between-slice) variance and σh2 is the local horizontal (within-slice) variance, defined, respectively, as:

4
5

Here, S is the number of slices, ns is the number of measurement points in slice s⁠, N is the total number of measurement points, quNP,s,i is the converted strength at point i in slice s⁠, q–uNP,s is the mean strength of slice s, and q–uNP is the overall column mean. The variance ratios are defined as:

6

where ηz quantifies the proportion of total quNP variance attributable to depth-level mean differences, whereas ηh quantifies the proportion attributable to local horizontal heterogeneity within each test plane. Both ratios are expressed as percentages to compare cases with different absolute variances.

Since each mixing condition is represented by a single physical column, the point estimates of ηz and ηh describe the individual model columns rather than the population of all DMM columns produced under each T setting. Hierarchical bootstrap 95% confidence intervals are reported alongside the decomposition results in Table 4, computed by resampling slices with replacement and, within each resampled slice, resampling measurement points with replacement (2000 replications). The intervals are wide owing to the small number of slices per column, but the rank ordering of cases by ηz is preserved across the full bootstrap distribution.

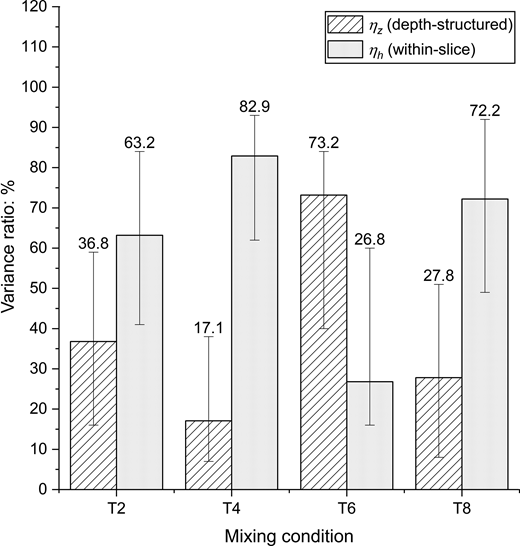
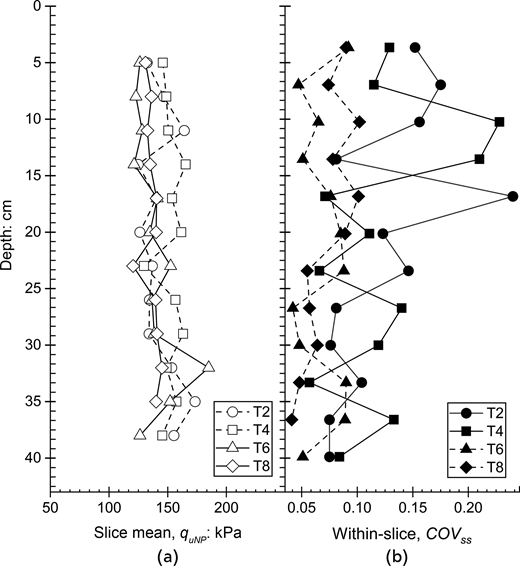
Figure 6 shows the variance ratios as a stacked bar chart; Figures 7(a) and 7(b) show depth profiles of slice-mean quNP and within-slice COVss, respectively. Three distinct regimes are identified. At T2, local horizontal heterogeneity dominates (⁠ηh = 63.2%), with COVss spanning 0.077–0.246, reflecting insufficient mixing to homogenise cement distribution within each cross-section. At T4, local dominance intensifies (⁠ηh = 82.9%), making T4 the most locally heterogeneous case despite its moderate overall COV of 0.148.

The most striking result occurs at T6, where ηz reaches 73.2%, the highest depth-structured ratio across all cases, while COVss remains consistently tight (0.043–0.094). Slice means nevertheless vary substantially with depth (121.4–184.9 kPa, range 63.5 kPa), demonstrating that within-slice homogeneity does not guarantee depth-wise uniformity. The mechanism responsible for this depth-wise gradient at T6 is identified as a subject for further investigation.

At T8, total variance falls to 145.8 kPa2, less than one quarter of the T2 value, with both components substantially reduced and the slice-mean range narrowing to 24.6 kPa. The non-monotonic behaviour of ηz (36.8% → 17.1% → 73.2% → 27.8%) indicates that within-slice homogeneity is largely achieved near T6, while depth-wise uniformity is not fully established until T8, broadly consistent with the rational mixing number concept of Ota et al. (2000), but adds a spatial interpretation to the mixing threshold. Reporting ηz and ηh alongside overall COV therefore provides a more complete description of column quality.

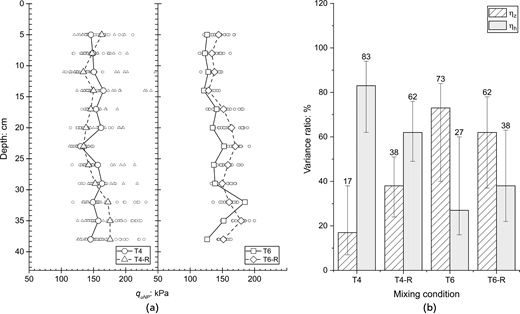
Two additional columns were prepared under the T4 and T6 conditions to assess repeatability; the replicates are denoted T4-R and T6-R. Numerical comparisons are summarised in Table 5, and depth profiles and variance-decomposition results are shown in Figure 8. Mean quNP is reproduced closely for T4 (152.3 vs. 152.7 kPa) but less so for T6 (138.8 vs. 152.4 kPa). Overall COV differs by only 0.008 between T4 replicates and 0.024 between T6 replicates, indicating good reproducibility of global variability magnitude.

In contrast, the variance partitioning shows greater between-column variability. For T4, ηz increases from 17.1% in T4 to 38.1% in T4-R; for T6, ηz decreases from 73.2% in T6 to 62.3% in T6-R. Despite these differences, the rank ordering is preserved: both T6 columns exhibit higher ηz than both T4 columns, indicating that the qualitative distinction between locally heterogeneous behaviour at T4 and more depth-structured behaviour at T6 is reproducible.

The hierarchical-bootstrap 95% confidence intervals in Table 5 partly overlap, so the replicate comparison does not constitute a formal statistical separation. Nevertheless, the consistent rank ordering supports the interpretation that mixing intensity governs the spatial character of variability, not only its magnitude. The T4 vs. T4-R contrast suggests that variance partitioning is sensitive to factors not fully controlled by the present apparatus, potentially including local fluctuations in slurry-delivery pressure. This does not invalidate the qualitative findings but indicates that single-column estimates of ηz and ηh may carry inter-column uncertainty of approximately 10–20 percentage points. Replicate columns are therefore recommended in future studies.

The variance decomposition in Section 4 showed that mixing intensity changes not only the magnitude of quNP variability but also its spatial organisation. This section examines whether these changes are also reflected in the probability distribution of quNP⁠. This is important because DMM design and quality-control practice recognise substantial scatter in in situ treated-soil strength and require correction factors to account for this variability (CDIT, 2002), while probabilistic assessments of representative/design strength depend on the adopted statistical model and lower-tail criteria (Liu et al., 2017). In addition, uncertainty in the estimated strength parameters depends on sample size and spatial correlation (Namikawa, 2019).

Normal and Lognormal distributions were fitted by maximum likelihood. These distributions were selected because both have been examined in previous statistical studies of cement-treated soil strength, although neither should be assumed universally applicable without goodness-of-fit checking (Liu et al., 2017; Namikawa and Koseki, 2013). The normal distribution was tested as a symmetric benchmark that may become appropriate under relatively uniform mixing conditions, whereas the Lognormal distribution was tested as a positive-valued, right-skewed alternative for heterogeneous strength data. Goodness of fit was assessed using the Lilliefors-corrected Kolmogorov–Smirnov test (Lilliefors, 1967) and the Stephens-modified Anderson–Darling test (Stephens, 1974, 1976) at α = 0.05. A distribution was treated as acceptable only when it passed both corrected tests simultaneously.

Distributions were also fitted to slice-mean-detrended residuals, ws,i=quNP,s,i-q–uNP,s⁠, to determine whether apparent non-normality originates from the depth-trend structure or from the local residual field. Because these residuals are spatially nested within slices rather than strictly independent, the detrended p-values should be interpreted as descriptive screening metrics, not exact significance tests.

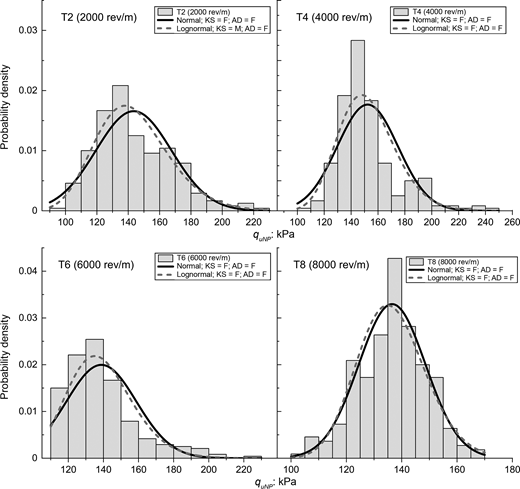
The test results are summarised in Table 6. Histograms with fitted probability density functions are shown in Figure 9. At T2, the normal distribution is rejected by both tests KS p = 0.0010; AD A*2 = 2.211, p < 0.01. The Lognormal distribution gives a marginal fit, passing the KS test (⁠p = 0.059) and falling near the AD acceptance threshold (⁠A*2 = 0.768, p = 0.05–0.10). However, this should not be interpreted as strong evidence of Lognormal behaviour because the distribution remains right-skewed and tail-sensitive. This is consistent with ηh = 63.2%, where local within-slice heterogeneity produces isolated high-strength zones that generate right-skewed behaviour (skewness = 0.68). Slice-mean detrending does not restore normality (⁠KS p = 0.0075; AD p < 0.01), suggesting that the local residual field remains non-Gaussian at T2.

At T4, both distributions are rejected for the raw data. Strong right skew (skewness = 1.37) and extreme values reaching 245.8 kPa produce a heavy-tailed distribution that neither model adequately represents. The high ηh = 82.9% suggests that isolated high-strength zones remain within individual cross-sections, generating outliers that distort the distribution. Slice-mean detrending also fails to produce normal residuals (⁠KS p = 0.0010; AD p < 0.01), indicating that the local residual field remains strongly non-Gaussian.

At T6, both distributions are rejected for the raw data. The histogram does not show a simple unimodal distribution and instead exhibits a pronounced right tail associated with large differences in slice-mean strength. This behaviour is consistent with pooling slices whose means span 121.4–184.9 kPa and with the high depth-structured variance ratio (⁠ηz = 73.2%) identified in Section 4. After slice-mean detrending, the departure from a simple normal form is reduced and the KS test no longer rejects normality. This indicates that the poor fit of the raw T6 distribution is mainly associated with depth-wise variation in slice means rather than the local residual field alone. The AD test, however, continues to reject the detrended residuals, indicating that residual tail mismatch remains.

At T8, the raw dataset is the only case for which the normal distribution is not rejected by either test at α = 0.05. The near-zero skewness and low COV are consistent with near-uniform mixing. The T8 dataset is slightly smaller (⁠n = 220), which marginally reduces test power; therefore, the acceptance of normality should be treated as suggestive rather than definitive. For the slice-mean-detrended T8 residuals, the KS test does not reject normality (⁠p = 0.1330), but the AD test remains marginally sensitive to tail mismatch (⁠A*2 = 0.873, p = 0.025–0.05); therefore, the detrended T8 residuals are treated as a KS pass but not a full normal fit.

The lognormal spread parameter decreases monotonically with increasing T, from σln = 0.164 at T2 to 0.145 at T4, 0.142 at T6, and 0.090 at T8, confirming that distributional spread narrows with increasing T⁠. However, because the lognormal distribution is rejected or only marginally supported for T2–T6, this parameter should be interpreted as a descriptive measure of log-scale spread rather than a structural distributional parameter. Overall, the conventional lognormal assumption is not consistently supported in the present miniature-column dataset. Only T8 provides tentative support for a normal approximation. More importantly, distribution shape reflects the spatial organisation of strength: the distorted T6 distribution is mainly associated with depth-wise mean variation, whereas the near-normal T8 distribution reflects the simultaneous reduction of both spatial variance components. Overall COV alone is therefore insufficient to characterise DMM column quality.

The spatial autocorrelation structure of quNP was examined in the horizontal and vertical directions using slice-mean-detrended residuals. This detrending was applied to remove the depth-structured component identified in Section 4, so that the ACF analysis represents the residual spatial structure of the local quNP field. This follows the geostatistical treatment in which spatial variability is separated into a deterministic trend and a residual component characterised by variance and autocorrelation structure (Baecher and Christian, 2003; Vanmarcke, 1977). For each measurement point at slice s and horizontal position i⁠, the detrended residual is defined as:

7

where q–uNP(s) is the mean of the 20 measurement points within slice s. The empirical autocorrelation function (ACF) was computed as:

8

where C(Δ) is the sample covariance between all pairs of residuals separated by lag Δ⁠, and C(0) is the sample variance. Horizontal pairs were formed from measurement points within the same slice, whereas vertical pairs were formed from corresponding horizontal positions across different depth levels and pooled across the 20 vertical profiles. For the vertical direction, the one-dimensional exponential covariance model was adopted following Vanmarcke (1977):

9

or equivalently in correlation form, following Honjo (1982):

10

where h is the vertical lag distance, σ2 is the process variance and θ is the exponential correlation-length parameter. The exponential form was selected because it provides a simple single-parameter representation of spatial correlation and has been widely used in geotechnical random-field modelling (Baecher and Christian, 2003; Vanmarcke, 1977), including cement-treated soil strength data (Honjo, 1982; Namikawa, 2019; Namikawa and Koseki, 2013).

The vertical correlation length θv was estimated by maximum likelihood, following the multivariate-normal covariance formulation of DeGroot and Baecher (1993) and Namikawa and Koseki (2013). The 20 vertical profiles at distinct horizontal positions were treated as approximately exchangeable realisations of the residual vertical random field. This is a simplifying assumption because all profiles were obtained from a single laboratory column. However, a one-way analysis of variance of mean quNP against radial distance from the grid centre showed no statistically significant radial trend for any mixing condition (p > 0.05), supporting this approximation. For each vertical profile i⁠, the vector of ns detrended residuals was modelled as a multivariate normal vector with zero mean and covariance σ2R(θ)⁠, where R(θ) is the ns×ns correlation matrix with elements:

11

where zj and zk are the depth centre coordinates of slices j and k⁠, respectively. The matrix R(θ) was decomposed using the Cholesky factorisation R = LLT for numerical stability, avoiding direct matrix inversion. Treating the 20 profiles as independent, the total profile log-likelihood obtained by analytically eliminating σ2 is:

12

where M* = 20 is the number of vertical profiles and ns is the number of slices in each profile. For any given θ⁠, the profile estimate of the variance is:

13

The MLE of the vertical correlation length is then:

14

obtained by evaluating lp (θ) over a fine grid of candidate values. The 95% confidence interval for θv was computed using the profile likelihood ratio criterion. All values of θv satisfying

15

are included in the interval, where 1.921 = χ1,0.952/2 corresponds to half of the 5% upper-tail critical value of the chi-squared distribution with one degree of freedom.

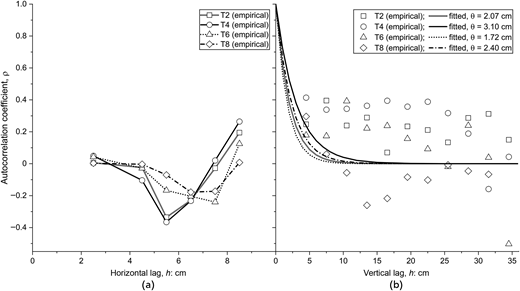
The empirical ACF profiles are shown in Figure 10, and the MLE results for the vertical correlation length are summarised in Table 7. After slice-mean detrending, the horizontal ACF values are effectively zero for all mixing conditions. The maximum correlation across all cases and horizontal lags is only 0.049, which is within the range of sampling noise. Thus, no meaningful horizontal spatial correlation is detectable at the present measurement scale. Because the horizontal grid spans only 8 cm and the inter-point spacing is 2 cm, this result should be interpreted as a resolution-limited finding, not as evidence that horizontal correlation is absent in general.

The detrended vertical ACF profiles show positive but irregular short-lag correlations. The fitted vertical correlation lengths range from 1.72 to 3.10 cm. T4 gives the longest value (⁠θv = 3.10 cm), indicating the greatest residual vertical continuity after detrending. This is consistent with its high within-slice heterogeneity, because unresolved local strength zones may extend slightly across the 3 cm slice boundaries. T6 gives the shortest value (⁠θv = 1.72 cm), consistent with its more homogenised within-slice structure and weak residual continuity beyond the nearest measurement depth.

All estimated θv values are comparable to, or smaller than, the 3.0 cm slice spacing. The MLE estimates are therefore weakly constrained, and the confidence intervals are correspondingly wide (Lloret-Cabot et al., 2014). Because autocorrelation-distance estimates may be biased under limited-data conditions and are sensitive to the assumed correlation function (Cami et al., 2020; Qi and Liu, 2019), the values in Table 7 should be regarded as approximate order-of-magnitude estimates. Finer vertical sampling would be required for more reliable θv estimation.

The estimated laboratory values are much smaller than reported field-scale vertical correlation parameters. Honjo (1982) reported vertical autocorrelation distances of approximately 0.4–4.0 m for cement-stabilised soil. Al-Naqshabandy et al. (2012) reported vertical scales of fluctuation of 0.2–0.7 m for lime-cement columns, corresponding to exponential correlation lengths of approximately 0.1–0.35 m. Pittaro and Mace (2024) reported vertical scales of fluctuation of approximately 0.5–3.5 m for DMM in the Kallang formation, corresponding to approximate exponential correlation lengths of 0.25–1.75 m under the same convention. These values are several times to two orders larger than the present estimates of θv = 1.72–3.10 cm. Direct transfer of θv from the miniature tests to field conditions is therefore inappropriate.

Overall, the dominant spatial structure is the depth-wise mean gradient identified by the variance decomposition, rather than a residual random field with substantial correlation length. Once the depth trend is removed, the residual quNP field approaches spatially uncorrelated behaviour at the scale of the present measurement grid.

Although these numerical values are specific to the present tests, the framework itself is not inherently tied to the specimen scale or base material, provided that spatially referenced strength data are available. In the field, the needle-penetration values used here could be replaced by strength data from cored samples or suitable in situ measurements such as cone penetration tests, which have been used to characterise strength variability in lime-cement columns (Al-Naqshabandy et al., 2012). Measurements at multiple positions across the column diameter over several depths would provide the within-depth variability used to estimate the local horizontal component σh2⁠, whereas differences among the corresponding depth-level mean strengths would provide the depth-structured component, σz2⁠. Applying the variance decomposition of Section 4 would therefore indicate whether field-column variability is predominantly depth-structured or locally horizontal, with the former warranting denser vertical sampling and the latter greater cross-sectional coverage. The numerical values and appropriate sampling intervals would nevertheless need to be established from field-scale data and site conditions.

The internal strength variability of laboratory deep-mixed columns was characterised across four blade revolution counts, T2–T8, using descriptive statistics, variance decomposition, distribution fitting and spatial autocorrelation analysis. The main findings are summarised below.

  • Mean quNP did not vary monotonically with blade revolution count, whereas overall COV decreased from 0.168 at T2 to 0.089 at T8. Under the present laboratory conditions, increasing mixing intensity mainly reduced strength variability rather than increasing mean strength.

  • Variance decomposition identified distinct spatial patterns. T2 and T4 were dominated by local horizontal heterogeneity (⁠ηh = 63%–83%), whereas T6 was dominated by depth-structured variability (⁠ηz = 73%). At T8, total variance fell to less than one quarter of the T2 value and the slice-mean range narrowed substantially. Thus, within-slice homogeneity and depth-wise uniformity did not develop simultaneously with increasing mixing intensity.

  • Normal and lognormal fits were not consistently supported. Raw quNP distributions at T4 and T6 were rejected by both models, T2 showed only marginal lognormal support, and the poor T6 fit mainly reflected depth-wise variation in slice means. Only T8 provided tentative support for a normal approximation.

  • Detrended horizontal autocorrelation was effectively zero at the present grid resolution. Detrended vertical correlation lengths were 1.72–3.10 cm, comparable to the 3.0 cm slice spacing, indicating that the dominant spatial structure was the depth-wise mean variation rather than a strongly correlated residual field.

Overall, COV alone is an incomplete descriptor of DMM column quality. Columns with high ηz require denser vertical sampling, whereas those with high ηh require greater horizontal coverage. Reporting ηz and ηh alongside COV provides a more informative characterisation of strength variability. It may also support future comparison of alternative blade geometries in terms of depth-wise uniformity and local horizontal heterogeneity.

The authors gratefully acknowledge the GI Column Association for providing the miniature DMM apparatus and funding support for the experimental programme. The authors also thank Mr. Shota Sato for assisting with the laboratory experiments.
Al-Naqshabandy
MS
,
Bergman
N
and
Larsson
S
(
2012
)
Strength variability in lime-cement columns based on cone penetration test data
.
Proceedings of the Institution of Civil Engineers – Ground Improvement
165
(1)
:
15
–
30
. .
Baecher
GB
and
Christian
JT
(
2003
)
Reliability and Statistics in Geotechnical Engineering
.
John Wiley & Sons
.
Cami
B
,
Javankhoshdel
S
,
Phoon
K-K
and
Ching
J
(
2020
)
Scale of fluctuation for spatially varying soils: estimation methods and values
.
ASCE-ASME Journal of Risk and Uncertainty in Engineering Systems, Part A: Civil Engineering
6
(4)
:
03120002
. .
CDIT (Coastal Development Institute of Technology)
(
2002
) The deep mixing method: principle, design and construction.
A.A Balkema Publishers
,
Lisse
.
Chen
EJ
,
Liu
Y
and
Lee
F-H
(
2016
)
A statistical model for the unconfined compressive strength of deep-mixed columns
.
Géotechnique
66
(5)
:
351
–
365
. .
DeGroot
DJ
and
Baecher
GB
(
1993
)
Estimating autocovariance of in-situ soil properties
.
Journal of Geotechnical Engineering
119
(1)
:
147
–
166
, .
Honjo
Y
(
1982
)
A probabilistic approach to evaluate shear strength of heterogeneous stabilized ground by deep mixing method
.
Soils and Foundations
22
(1)
:
23
–
38
. .
Japanese Cement Association
(
2021
)
Manual for Ground Improvement Using Cement-Based Solidification Materials
(5th ed) ,
Japan Cement Association
,
Tokyo
.
Larsson
S
,
Stille
H
and
Olsson
L
(
2005
)
On horizontal variability in lime-cement columns in deep mixing
.
Géotechnique
55
(1)
:
33
–
44
. .
Lilliefors
HW
(
1967
)
On the Kolmogorov-Smirnov test for normality with mean and variance unknown
.
Journal of the American Statistical Association, Taylor & Francis
62
(318)
:
399
–
402
. .
Liu
Y
,
Zheng
J
and
Guo
J
(
2008
) Statistical evaluation for strength of pile by deep mixing method. In
Geotechnical Engineering for Disaster Mitigation and Rehabilitation
(
Liu
H
,
Deng
A
, and
Chu
J
(eds)),
Springer Berlin Heidelberg
,
Berlin, Heidelberg
, pp.
195
–
200
. .
Liu
Y
,
Jiang
YJ
,
Xiao
H
and
Lee
FH
(
2017
)
Determination of representative strength of deep cement-mixed clay from core strength data
.
Géotechnique
67
(4)
:
350
–
364
. .
Lloret-Cabot
M
,
Fenton
GA
and
Hicks
MA
(
2014
)
On the estimation of scale of fluctuation in geostatistics
.
Georisk: Assessment and Management of Risk for Engineered Systems and Geohazards
8
(2)
:
129
–
140
. .
Namikawa
T
and
Koseki
J
(
2013
)
Effects of spatial correlation on the compression behavior of a cement-treated column
.
Journal of Geotechnical and Geoenvironmental Engineering
139
(8)
:
1346
–
1359
. .
Namikawa
T
(
2019
)
Evaluation of statistical uncertainty of cement-treated soil strength using Bayesian approach
.
Soils and Foundations
59
(5)
:
1228
–
1240
. .
Ota
K
,
Watanabe
K
,
Kawamura
M
,
Fujii
M
and
Hibino
S
(
2000
)
Experiment for evaluating mixing performance in the deep mixing method, part 1: research objectives and experimental method
. In Proceedings of the 35th Japan National Conference on Geotechnical Engineering, Presented at the 35th Japan National Conference on Geotechnical Engineering. pp.
1203
–
1204
.
(In Japanese)
.
Phoon
KK
and
Kulhawy
FH
(
1999
)
Characterization of geotechnical variability
.
Canadian Geotechnical Journal
36
(4)
:
612
–
624
. .
Pittaro
GA
and
Mace
N
(
2024
) Spatial variability for deep cement mixing in Kallang formation in Singapore. Review of scale of fluctuation and its influence in design. In
Geotechnical Aspects of Underground Construction in Soft Ground
(1st ed.)
CRC Press
,
London
, pp.
480
–
487
. .
Qi
XH
and
Liu
HX
(
2019
)
Estimation of autocorrelation distances for in-situ geotechnical properties using limited data
.
Structural Safety
79
:
26
–
38
. .
Stephens
MA
(
1974
)
EDF statistics for goodness of fit and some comparisons
.
Journal of the American Statistical Association, Taylor & Francis
69
(347)
:
730
–
737
, .
Stephens
MA
(
1976
)
Asymptotic results for goodness-of-fit statistics with unknown parameters
.
The Annals of Statistics
4
(2)
:
357
–
369
.
Uchida
N
,
Eto
Y
,
Ono
H
and
Miura
N
(
2004
)
Strength evaluation of deep mixing soil-cement by needle penetration test
.
Journal of the Japanese Society of Soil Mechanics and Foundation Engineering
52
(7)
:
23
–
25
.
(In Japanese)
.
Vanmarcke
EH
(
1977
)
Probabilistic modeling of soil profiles
.
Journal of the Geotechnical Engineering Division
103
(11)
:
1227
–
1246
.
Wijerathna
M
and
Liyanapathirana
DS
(
2019
)
Significance of spatial variability of deep cement mixed columns on reliability of column-supported embankments
.
International Journal of Geomechanics
19
(8)
:
04019087
. .
Zuo
J
,
Wang
B
,
Li
W
et al.
(
2023
)
Quality assessment and quality control of deep soil mixing columns based on a cement-content controlled method
.
Scientific Reports
13
(1)
:
4813
. .
Published by Emerald Publishing Limited. This article is published under the Creative Commons Attribution (CC BY 4.0) licence. Anyone may reproduce, distribute, translate and create derivative works of this article (for both commercial and non-commercial purposes), subject to full attribution to the original publication and authors. The full terms of this licence may be seen at Link to the terms of the CC BY 4.0 licenceLink to the terms of the CC BY 4.0 licence.

Data & Figures

Figure 1.
Two photos present a large soil drilling machine at a construction site and a miniature D M M machine with laboratory testing equipment.In panel a, a large crawler-mounted drilling machine stands at an outdoor construction site. The machine has a tall vertical drilling mast, hydraulic hoses, metal support rods, and a drilling shaft extending into the ground. A large mound of excavated soil surrounds the drilling area. The machine has a tracked base, a main equipment housing, and stabilizing supports extending to the ground. Several workers wearing safety helmets stand beside the machine. Industrial buildings, parked vehicles, and construction equipment are visible in the background. In the second panel, also labeled a, a miniature model of a D M M machine stands inside a laboratory. The model consists of a vertical metal frame, an upper motor assembly, support columns, threaded rods, a central rotating shaft, and a mixing blade extending into a transparent soil tank. A cement-slurry tank stands beside the model and connects to the upper assembly through a flexible tube. The cement-slurry tank has a transparent cylindrical container, a measuring scale, pressure gauges, and a control unit. A machine controller stands on the other side, with switches, connectors, and cables. The labels identify Cement-slurry tank, Soil tank, Machine controller, and Miniature model of D M M machine.

DMM mixing systems: (a) representative field-scale DMM machine and (b) miniature laboratory DMM apparatus

Close Figure 1.
Figure 2.
A schematic diagram presents a soil mixing blade, slurry outlet hole, and anti-co-rotation component above a 450-millimeter improved kaolin zone.The schematic diagram presents a soil mixing arrangement within a rectangular container. The container has a width of 200 millimeters. The mixing blade assembly has a width of 130 millimeters. The upper assembly contains horizontal blade elements, a hatched anti co-rotation component, and a slurry outlet hole beneath the lower blade. The labels identify Blade, Anti co-rotation, and Slurry outlet hole. Below the assembly, the kaolin section has a total depth of 500 millimeters. The improved zone has a depth of 450 millimeters, with an additional 50 millimeter section at the bottom. The improved zone is divided by dashed horizontal lines into 12 numbered sections, labeled 1 through 12. Section 1 begins below the upper boundary of the improved zone. A vertical dimension marker identifies 50 millimeters between the upper boundary and an intermediate dashed line. Another dimension marker identifies a section thickness of 30 millimeters. The improved zone is enclosed by dashed vertical boundaries, with the numbered sections arranged consecutively from top to bottom. The labels identify Improved zone, 450 millimeters, and Kaolin, 500 millimeters.

Schematic cross-section of the soil tank and experimental configuration, showing the kaolin layer, improved zone, blade position and slicing arrangement

Close Figure 2.
Figure 3.
A soil mixing assembly consists of 6 numbered blades attached to a vertical shaft, with an anti-co-rotation plate between the blade sections.The soil mixing assembly consists of a vertical cylindrical metal shaft with 6 numbered blades and an anti co-rotation plate. The upper section contains 2 pairs of opposing blades. Blade 1 extends from the shaft with a broad, flattened end. Blade 2 extends in the opposite direction and has a rounded, angled tip. Below these, blade 3 extends outward with a broad, flattened surface and a rounded end. Blade 4 extends in the opposite direction with a shorter, flattened tip. A horizontal anti co-rotation plate is mounted below blade 4. The plate consists of 2 flat metal strips extending in opposite directions from a central mounting bracket. The bracket is secured with 4 visible bolts on each side of the shaft. Below the plate, blade 5 extends outward with a tapered, flattened end. Blade 6 extends in the opposite direction and has a broad, curved end with several projecting metal teeth. The blades are attached to the central shaft through welded joints. The shaft extends vertically through the entire assembly, with a circular flange at the upper end.

Photograph of the mixing blade assembly showing the six wing components and horizontal anti-co-rotation plate

Close Figure 3.
Figure 4.
Two panels present a circular specimen with a measuring ruler and a schematic of 25 measurement points spaced 20 millimetres apart.Panel a contains a circular specimen with an uneven outer edge and faint concentric circular marks around a small central spot. A measuring ruler is placed above the specimen, with markings from 0 to 15 centimetres. A small rectangular label containing numbers and text is placed beside the specimen. The specimen has a nearly uniform surface with slight variations in texture and visible irregularities along its perimeter. Panel b presents a schematic of a circular specimen with a diameter of 150 millimetres. The circle contains 21 measurement points arranged in 5 horizontal rows. The first row contains 3 points, the second row contains 5 points, the third row contains 5 points, the fourth row contains 5 points, and the fifth row contains 3 points. The points form a regular grid within the circular boundary. The horizontal distance between adjacent points is marked as 20 millimetres using arrows and dashed reference lines. The vertical distance between adjacent rows is also marked as 20 millimetres. A vertical double-headed arrow indicates the full diameter of 150 millimetres. The horizontal axis is labelled x, and the vertical axis is labelled y. Both axes have arrowheads indicating their positive directions.

Measurement grid: (a) photograph of a typical exposed slice surface and (b) needle penetration testing plan view showing the 20 measurement positions within the 150 mm effective column diameter

Close Figure 4.
Figure 5.
Four-panel plots compare individual q u N P measurements, sliced means, standard deviations, and column means across depth for T 2, T 4, T 6, and T 8.The four-panel plots present q u N P measurements across different depths for T 2, T 4, T 6, and T 8. The horizontal axis represents q u N P in kilo pascals and ranges from 50 to 250 in intervals of 50. The vertical axis represents depth in centimetres and ranges from 0 to approximately 43, increasing downwards, with major intervals of 5. Measurements are presented at depths of 5, 8, 11, 14, 17, 20, 23, 26, 29, 32, 35, and 38 centimetres. The legend identifies open circles as individual q u N P measurements, filled circles connected by solid lines as sliced mean q u N P values, dashed boundary lines as sliced mean plus or minus standard deviation, and vertical dash-dot lines as overall column mean q u N P values. The shaded regions between the dashed boundary lines indicate the spread around the sliced means. The first plot, labeled T 2, has an overall column mean of 143.5 kilo pascals. Its sliced mean values are approximately 132, 143, 165, 126, 140, 128, 136, 136, 136, 153, 175, and 155 kilo pascals at successive depths. The sliced mean decreases from approximately 165 kilo pascals at 11 centimetres to 126 kilo pascals at 14 centimetres. It then fluctuates and reaches approximately 175 kilo pascals at 35 centimetres before decreasing at 38 centimetres. Individual measurements extend from approximately 95 to 225 kilo pascals, with a wider horizontal spread at several depths between 8 and 20 centimetres. The second plot, labeled T 4, has an overall column mean of 152.3 kilo pascals. Its sliced means are approximately 148, 150, 151, 165, 153, 162, 130, 155, 163, 149, 157, and 145 kilo pascals at successive depths. The sliced mean reaches approximately 165 kilo pascals at 14 centimetres, decreases to approximately 130 kilo pascals at 23 centimetres, and fluctuates around 145 to 163 kilo pascals at greater depths. Individual measurements extend from approximately 105 to 250 kilo pascals, with several widely separated points at depths of 11, 14, and 29 centimetres. The third plot, labeled T 6, has an overall column mean of 138.8 kilo pascals. Its sliced means are approximately 126, 122, 128, 121, 142, 135, 153, 136, 138, 185, 153, and 126 kilo pascals at successive depths. The sliced means remain near 120 to 155 kilo pascals through 29 centimetres, increase to approximately 185 kilo pascals at 32 centimetres, and decrease to approximately 126 kilo pascals at 38 centimetres. Individual measurements extend from approximately 110 to 225 kilo pascals. The dashed boundaries widen around the higher sliced mean at 32 centimetres. The fourth plot, labeled T 8, has an overall column mean of 136.5 kilo pascals. Its sliced means are approximately 133, 139, 137, 135, 143, 144, 123, 141, 143, 148, and 143 kilo pascals at depths from 5 to 35 centimetres. The sliced mean decreases to approximately 123 kilo pascals at 23 centimetres and then increases gradually towards 32 centimetres. Individual measurements extend from approximately 110 to 170 kilo pascals. The dashed standard deviation boundaries remain relatively close to the sliced mean line across most depths. Each plot includes a vertical reference line marking its overall column mean, allowing comparison with the depth-specific sliced means and individual measurements.

Vertical distribution of quNP for the four mixing conditions. Open symbols: individual quNP values; filled circles: slice mean; grey band: ±σ; vertical dashed line: overall column mean

Close Figure 5.
Figure 6.
A Grouped bar graph compares depth-structured and within-slice variance ratios for T 2, T 4, T 6, and T 8 mixing conditions.The grouped bar graph presents depth-structured and within-slice variance ratios for four mixing conditions. The horizontal axis represents mixing condition, with categories T 2, T 4, T 6, and T 8. The vertical axis represents variance ratio in percent and ranges from 0 to 120, with major intervals of 10 and minor intervals of 5. The legend identifies eta z as the depth-structured variance ratio, represented by diagonally hatched bars, and eta h as the within-slice variance ratio, represented by unhatched bars. Each mixing condition contains two adjacent bars. All bars have vertical error bars with horizontal caps. The numerical values are labeled above the error bars. For T 2, eta z is 36.8 percent, with an error bar extending approximately from 16 to 59 percent. Eta h is 63.2 percent, with an error bar extending approximately from 41 to 84 percent. For T 4, eta z is 17.1 percent, with an error bar extending approximately from 7 to 38 percent. Eta h is 82.9 percent, with an error bar extending approximately from 62 to 93 percent. For T 6, eta z is 73.2 percent, with an error bar extending approximately from 40 to 84 percent. Eta h is 26.8 percent, with an error bar extending approximately from 16 to 60 percent. For T 8, eta z is 27.8 percent, with an error bar extending approximately from 8 to 51 percent. Eta h is 72.2 percent, with an error bar extending approximately from 49 to 92 percent. The depth-structured variance ratio decreases from 36.8 percent at T 2 to 17.1 percent at T 4, increases to 73.2 percent at T 6, and decreases to 27.8 percent at T 8. The within-slice variance ratio increases from 63.2 percent at T 2 to 82.9 percent at T 4, decreases to 26.8 percent at T 6, and increases to 72.2 percent at T 8. T 6 has the highest depth-structured variance ratio, while T 4 has the highest within-slice variance ratio. The two variance ratios total 100 percent for each mixing condition.

Variance decomposition of quNP into depth-structured ηz and local horizontal ηh components for the four mixing conditions. Error bars indicate hierarchical-bootstrap 95% confidence intervals

Close Figure 6.
Figure 7.
Two-panel line graphs compare slice mean q u N P and within-slice coefficient of variation across depth for T 2, T 4, T 6, and T 8.The two-panel line graphs present slice mean q u N P and within-slice coefficient of variation across depth for four mixing conditions, T 2, T 4, T 6, and T 8. Both panels share a vertical axis representing depth in centimetres, ranging from 0 to approximately 43, increasing downwards, with major intervals of 5 and minor intervals of 1. Measurements occur at depths of approximately 5, 8, 11, 14, 17, 20, 23, 26, 29, 32, 35, and 38 centimetres, with additional points at 40 centimetres in panel b. Panel a presents slice mean q u N P in kilo pascals on the horizontal axis, ranging from 50 to 250 in major intervals of 50. The legend identifies T 2 using open circles connected by a dashed line, T 4 using open squares connected by a dashed line, T 6 using open triangles connected by a solid line, and T 8 using open diamonds connected by a solid line. T 2 values fluctuate between approximately 125 and 175 kilo pascals. They begin near 132 kilo pascals at 5 centimetres, increase to approximately 165 kilo pascals at 11 centimetres, decrease to approximately 125 kilo pascals at 20 centimetres, and rise to approximately 175 kilo pascals at 35 centimetres before decreasing to approximately 155 kilo pascals at 38 centimetres. T 4 values range from approximately 130 to 165 kilo pascals. They begin near 145 kilo pascals at 5 centimetres, increase to approximately 165 kilo pascals at 14 centimetres, fluctuate between approximately 130 and 165 kilo pascals through 29 centimetres, and end near 145 kilo pascals at 38 centimetres. T 6 values fluctuate between approximately 120 and 185 kilo pascals. They begin near 125 kilo pascals at 5 centimetres, remain between approximately 120 and 155 kilo pascals through 29 centimetres, increase to approximately 185 kilo pascals at 32 centimetres, and decrease to approximately 125 kilo pascals at 38 centimetres. T 8 values range from approximately 120 to 150 kilo pascals. They begin near 133 kilo pascals at 5 centimetres, fluctuate around 125 to 145 kilo pascals through 29 centimetres, and remain near 140 to 150 kilo pascals at greater depths. Panel b presents within-slice coefficient of variation, C O V s s, on the horizontal axis, with labeled values from 0.05 to 0.20 in intervals of 0.05. The plotted values extend approximately from 0.04 to 0.24. The legend identifies T 2 using filled circles connected by a solid line, T 4 using filled squares connected by a solid line, T 6 using filled triangles connected by a dashed line, and T 8 using filled diamonds connected by a dashed line. T 2 values are approximately 0.15, 0.17, 0.15, 0.08, 0.24, 0.12, 0.14, 0.08, 0.08, 0.10, 0.08, and 0.08 at successive depths from 4 to 40 centimetres. The highest T 2 value occurs near 17 centimetres. T 4 values are approximately 0.13, 0.12, 0.23, 0.21, 0.07, 0.11, 0.07, 0.14, 0.12, 0.06, 0.13, and 0.08 at successive depths. The highest T 4 value occurs near 10 centimetres. T 6 values fluctuate between approximately 0.04 and 0.09. They begin near 0.05, decrease near 14 centimetres, increase near 23 centimetres, and fluctuate around 0.04 to 0.09 at greater depths. T 8 values fluctuate between approximately 0.04 and 0.10. They begin near 0.09, decrease near 7 centimetres, increase near 10 centimetres, and fluctuate around 0.04 to 0.10 at subsequent depths. Panel a displays the variation in slice mean q u N P across depth, while panel b displays the corresponding within-slice coefficient of variation for the same four mixing conditions.

Depth profiles of (a) slice-mean quNP and (b) within-slice quNP for the four mixing conditions

Close Figure 7.
Figure 8.
Two-panel graphs compare q u N P values across depth and variance ratios for T 4, T 4 hyphen R, T 6, and T 6 hyphen R.The two-panel graph compares q u N P measurements across depth and variance ratios for four mixing conditions. Panel a contains two plots of q u N P against depth. The horizontal axis represents q u N P in kilo pascals and ranges from 50 to 250, with major intervals of 50. The vertical axis represents depth in centimetres and ranges from 0 to approximately 43, increasing downwards, with major intervals of 5. Measurements are plotted at depths of 5, 8, 11, 14, 17, 20, 23, 26, 29, 32, 35, and 38 centimetres. The first plot compares T 4, represented by circles connected with a solid line, and T 4 hyphen R, represented by triangles connected with a dashed line. At depths of 5, 8, 11, 14, 17, 20, 23, 26, 29, 32, 35, and 38 centimetres, T 4 values are approximately 146, 149, 151, 165, 154, 162, 132, 157, 162, 149, 158, and 146 kilo pascals, respectively. The corresponding T 4 hyphen R values are approximately 164, 150, 135, 150, 145, 138, 132, 142, 153, 172, 177, and 177 kilo pascals. The T 4 line fluctuates across the measured depths, while the T 4 hyphen R line decreases initially and then increases towards the lower depths. The second plot compares T 6, represented by squares connected with a solid line, and T 6 hyphen R, represented by diamonds connected with a dashed line. At depths of 5, 8, 11, 14, 17, 20, 23, 26, 29, 32, 35, and 38 centimetres, T 6 values are approximately 126, 123, 128, 121, 140, 135, 153, 137, 138, 185, 153, and 128 kilo pascals, respectively. The corresponding T 6 hyphen R values are approximately 145, 136, 140, 128, 152, 165, 171, 160, 149, 161, 171, and 151 kilo pascals. Both plots contain additional unconnected measurement markers distributed around the connected values at each depth. The first plot includes scattered circles and triangles, while the second includes scattered squares and diamonds. These markers indicate individual measurements with different horizontal spreads at each depth. Panel b presents a grouped vertical bar chart comparing variance ratios for T 4, T 4 hyphen R, T 6, and T 6 hyphen R. The horizontal axis identifies the four mixing conditions. The vertical axis represents variance ratio in percent and ranges from 0 to 120 in intervals of 20. The legend identifies eta z using diagonal hatching and eta h using vertical hatching. Each mixing condition contains two adjacent bars with vertical error bars and horizontal caps. For T 4, eta z is 17 percent and eta h is 83 percent. Their error bars extend approximately from 8 to 38 percent and from 62 to 94 percent, respectively. For T 4 hyphen R, eta z is 38 percent and eta h is 62 percent. Their error bars extend approximately from 24 to 52 percent and from 49 to 76 percent, respectively. For T 6, eta z is 73 percent and eta h is 27 percent. Their error bars extend approximately from 40 to 84 percent and from 16 to 40 percent, respectively. For T 6 hyphen R, eta z is 62 percent and eta h is 38 percent. Their error bars extend approximately from 37 to 78 percent and from 22 to 63 percent, respectively. Across the four mixing conditions, eta z increases from 17 percent for T 4 to 73 percent for T 6 before decreasing to 62 percent for T 6 hyphen R. In contrast, eta h decreases from 83 percent for T 4 to 27 percent for T 6 before increasing to 38 percent for T 6 hyphen R. The two variance ratios total 100 percent for each mixing condition.

Repeatability comparison for the original and replicate T4 and T6 columns: (a) depth profiles of quNP and (b) variance partitioning into ηz and ηh with hierarchical-bootstrap 95% confidence intervals

Close Figure 8.
Figure 9.
Four histograms compare probability density distributions for T 2, T 4, T 6, and T 8, with normal and lognormal fitted curves.The four-panel histograms present probability density distributions of q u N P in kilo pascals for different revolution rates. Each panel contains histogram bars, a solid normal distribution curve, and a dashed lognormal distribution curve. The horizontal axis represents q u N P in kilo pascals, and the vertical axis represents probability density. Panel a represents T 2 at 2000 revolutions per minute. The horizontal axis ranges approximately from 90 to 230 kilo pascals, and the vertical axis ranges from 0 to 0.035. The highest histogram bar reaches approximately 0.021 near 135 kilo pascals. The normal curve peaks near 145 kilo pascals at 0.0165, while the lognormal curve peaks near 137 kilo pascals at 0.0175. Panel b represents T 4 at 4000 revolutions per minute. The horizontal axis ranges from 100 to 260 kilo pascals, and the vertical axis ranges from 0 to approximately 0.035. The highest bar reaches approximately 0.028 near 145 kilo pascals. The normal curve peaks near 153 kilo pascals at 0.0175, while the lognormal curve peaks near 150 kilo pascals at 0.019. Panel c represents T 6 at 6000 revolutions per minute. The horizontal axis ranges approximately from 110 to 230 kilo pascals, and the vertical axis ranges from 0 to 0.045. The highest bar reaches approximately 0.025 near 135 kilo pascals. The normal curve peaks near 138 kilo pascals at 0.020, while the lognormal curve peaks near 135 kilo pascals at 0.022. Panel d represents T 8 at 8000 revolutions per minute. The horizontal axis ranges from 100 to 180 kilo pascals, and the vertical axis ranges from 0 to approximately 0.045. The highest bar reaches approximately 0.043 near 137 kilo pascals. Both fitted curves peak near 135 kilo pascals at approximately 0.033. The legends identify normal and lognormal distributions. The Kolmogorov Smirnov test, K S, and Anderson Darling test, A D, are marked F for all fitted curves except the lognormal distribution in panel a, where K S is marked M and A D is marked F.

Probability density histograms of raw quNP for the four mixing conditions, with fitted normal and lognormal probability density functions

Close Figure 9.
Figure 10.
Two-line graphs compare empirical autocorrelation coefficients for T 2, T 4, T 6, and T 8 against horizontal and vertical lag distances.The 2 line graphs present autocorrelation coefficient, rho, against horizontal and vertical lag, h, in centimeters for T 2, T 4, T 6, and T 8. Both graphs have a vertical axis ranging from negative 0.5 to 1.0, with labeled intervals of 0.2. In panel a, the horizontal axis represents Horizontal lag, h, in centimeters and ranges from 0 to 10, with labeled intervals of 2. The legend identifies T 2 with square markers and a solid line, T 4 with circular markers and a solid line, T 6 with triangular markers and a dotted line, and T 8 with diamond markers and a dash-dot line. At approximately 2.5 centimeters, all 4 coefficients are between 0 and 0.05. At 4.5 centimeters, T 2, T 4, T 6, and T 8 are approximately negative 0.03, negative 0.10, negative 0.02, and 0, respectively. At 5.5 centimeters, the values are approximately negative 0.34, negative 0.37, negative 0.16, and negative 0.07. At 6.5 centimeters, they are approximately negative 0.22, negative 0.23, negative 0.20, and negative 0.18. At 7.5 centimeters, they are approximately negative 0.03, 0.02, negative 0.24, and negative 0.18. At 8.5 centimeters, they increase to approximately 0.19, 0.26, 0.13, and 0.01. In panel b, the horizontal axis represents Vertical lag, h, in centimeters and ranges from 0 to 35, with labeled intervals of 5. The legend identifies empirical values using square markers for T 2, circular markers for T 4, triangular markers for T 6, and diamond markers for T 8. The corresponding fitted curves have theta values of 2.07, 3.10, 1.72, and 2.40 centimeters, respectively. All 4 fitted curves begin near 1.0 at zero lag and decrease rapidly towards 0 by approximately 10 to 15 centimeters. The empirical T 2 values fluctuate between approximately 0.07 and 0.40. T 4 values remain mostly between 0.19 and 0.41 before decreasing to approximately 0.04 at 35 centimeters, with a negative value near 31.5 centimeters. T 6 values fluctuate between approximately 0.05 and 0.40 before reaching approximately negative 0.50 at 35 centimeters. T 8 values decrease from approximately 0.30 near 4.5 centimeters to negative 0.26 near 13.5 centimeters and remain mostly negative at larger lag distances.

Empirical autocorrelation functions of slice-mean-detrended quNP residuals for the four mixing conditions: (a) horizontal direction and (b) vertical direction with fitted exponential models

Close Figure 10.
Table 1.

Mixing conditions adopted in the experimental programme

CaseNumber of blade rotations, T: rev/mRotational speed, N: rev/minPenetration speed, Vd: m/min
T220008.50.051
T4400017.00.051
T6600025.50.051
T8800034.00.051
Table 2.

Overall statistical characteristics of quNP for the four mixing conditions

CasenMean, quNP: kPaSD: kPaCOVMin: kPaMax: kPaSkewness
T2240143.524.00.16892.9220.70.68
T4240152.322.50.148103.9245.81.37
T6240138.819.90.144111.8226.51.42
T8220136.512.10.089104.6166.4−0.15
Table 3.

Slice-wise statistics for the four mixing conditions

CaseSlice-mean range: kPaDepth-wise range: kPaCOVss rangeMean COVss
T2124.8–173.348.50.077–0.2460.127
T4129.8–165.335.50.059–0.2340.125
T6121.4–184.963.50.043–0.0940.070
T8120.5–145.124.60.042–0.1050.074
Table 4.

Variance decomposition of quNP into depth-structured and local horizontal components for the four mixing conditions, including hierarchical-bootstrap 95% confidence intervals

Caseσtotal2⁠: kPa²σz2⁠: kPa²σh2⁠: kPa²ηz⁠: %95% CIηh⁠: %95% CI
T2577.2212.3364.936.8[16,59]63.2[41,84]
T4507.986.7421.217.1[7,38]82.9[62,94]
T6397.5291.0106.573.2[40,84]26.8[16,60]
T8145.840.5105.327.8[8,51]72.2[49,92]
Table 5.

Repeatability comparison for T4 and T6, including hierarchical-bootstrap 95% confidence intervals

QuantityT4T4-RT6T6-R
Mean quNP⁠: kPa152.3152.7138.8152.4
Overall COV0.1480.1560.1440.119
ηz (%) [95% CI]17 [7, 38]38 [24, 51]73 [40, 84]62 [37, 78]
ηh (%) [95% CI]83 [62, 94]62 [49, 76]27 [16, 60]38 [22, 63]
Table 6.

Goodness-of-fit test results for normal and lognormal fits to raw and slice-mean-detrended quNP data

CaseDistributionLilliefors KS pStephens AD A*²AD p bracketResult
T2 rawNormal0.00102.211<0.01Fail
T2 rawLognormal0.05900.7680.05–0.10Marginal
T4 rawNormal0.00107.686<0.01Fail
T4 rawLognormal0.00104.476<0.01Fail
T6 rawNormal0.00107.148<0.01Fail
T6 rawLognormal0.00104.112<0.01Fail
T8 rawNormal0.06810.527>0.15Pass
T8 rawLognormal0.00341.0640.01–0.025Fail
T2 detrendedNormal0.00752.020<0.01Fail
T4 detrendedNormal0.00106.629<0.01Fail
T6 detrendedNormal0.05891.0480.01–0.025Fail/KS marginal pass
T8 detrendedNormal0.13300.8730.025–0.05Fail/KS pass
Table 7.

Maximum likelihood estimates of vertical correlation length θv for the four mixing conditions

Caseθv⁠: cm95% CI: cmSlice spacing: cm
T22.07[1.39, 2.95]3.0
T43.10[2.32, 4.24]3.0
T61.72[0.98, 2.48]3.0
T82.40[1.64, 3.39]3.0

Supplements

References

Al-Naqshabandy
MS
,
Bergman
N
and
Larsson
S
(
2012
)
Strength variability in lime-cement columns based on cone penetration test data
.
Proceedings of the Institution of Civil Engineers – Ground Improvement
165
(1)
:
15
–
30
. .
Baecher
GB
and
Christian
JT
(
2003
)
Reliability and Statistics in Geotechnical Engineering
.
John Wiley & Sons
.
Cami
B
,
Javankhoshdel
S
,
Phoon
K-K
and
Ching
J
(
2020
)
Scale of fluctuation for spatially varying soils: estimation methods and values
.
ASCE-ASME Journal of Risk and Uncertainty in Engineering Systems, Part A: Civil Engineering
6
(4)
:
03120002
. .
CDIT (Coastal Development Institute of Technology)
(
2002
) The deep mixing method: principle, design and construction.
A.A Balkema Publishers
,
Lisse
.
Chen
EJ
,
Liu
Y
and
Lee
F-H
(
2016
)
A statistical model for the unconfined compressive strength of deep-mixed columns
.
Géotechnique
66
(5)
:
351
–
365
. .
DeGroot
DJ
and
Baecher
GB
(
1993
)
Estimating autocovariance of in-situ soil properties
.
Journal of Geotechnical Engineering
119
(1)
:
147
–
166
, .
Honjo
Y
(
1982
)
A probabilistic approach to evaluate shear strength of heterogeneous stabilized ground by deep mixing method
.
Soils and Foundations
22
(1)
:
23
–
38
. .
Japanese Cement Association
(
2021
)
Manual for Ground Improvement Using Cement-Based Solidification Materials
(5th ed) ,
Japan Cement Association
,
Tokyo
.
Larsson
S
,
Stille
H
and
Olsson
L
(
2005
)
On horizontal variability in lime-cement columns in deep mixing
.
Géotechnique
55
(1)
:
33
–
44
. .
Lilliefors
HW
(
1967
)
On the Kolmogorov-Smirnov test for normality with mean and variance unknown
.
Journal of the American Statistical Association, Taylor & Francis
62
(318)
:
399
–
402
. .
Liu
Y
,
Zheng
J
and
Guo
J
(
2008
) Statistical evaluation for strength of pile by deep mixing method. In
Geotechnical Engineering for Disaster Mitigation and Rehabilitation
(
Liu
H
,
Deng
A
, and
Chu
J
(eds)),
Springer Berlin Heidelberg
,
Berlin, Heidelberg
, pp.
195
–
200
. .
Liu
Y
,
Jiang
YJ
,
Xiao
H
and
Lee
FH
(
2017
)
Determination of representative strength of deep cement-mixed clay from core strength data
.
Géotechnique
67
(4)
:
350
–
364
. .
Lloret-Cabot
M
,
Fenton
GA
and
Hicks
MA
(
2014
)
On the estimation of scale of fluctuation in geostatistics
.
Georisk: Assessment and Management of Risk for Engineered Systems and Geohazards
8
(2)
:
129
–
140
. .
Namikawa
T
and
Koseki
J
(
2013
)
Effects of spatial correlation on the compression behavior of a cement-treated column
.
Journal of Geotechnical and Geoenvironmental Engineering
139
(8)
:
1346
–
1359
. .
Namikawa
T
(
2019
)
Evaluation of statistical uncertainty of cement-treated soil strength using Bayesian approach
.
Soils and Foundations
59
(5)
:
1228
–
1240
. .
Ota
K
,
Watanabe
K
,
Kawamura
M
,
Fujii
M
and
Hibino
S
(
2000
)
Experiment for evaluating mixing performance in the deep mixing method, part 1: research objectives and experimental method
. In Proceedings of the 35th Japan National Conference on Geotechnical Engineering, Presented at the 35th Japan National Conference on Geotechnical Engineering. pp.
1203
–
1204
.
(In Japanese)
.
Phoon
KK
and
Kulhawy
FH
(
1999
)
Characterization of geotechnical variability
.
Canadian Geotechnical Journal
36
(4)
:
612
–
624
. .
Pittaro
GA
and
Mace
N
(
2024
) Spatial variability for deep cement mixing in Kallang formation in Singapore. Review of scale of fluctuation and its influence in design. In
Geotechnical Aspects of Underground Construction in Soft Ground
(1st ed.)
CRC Press
,
London
, pp.
480
–
487
. .
Qi
XH
and
Liu
HX
(
2019
)
Estimation of autocorrelation distances for in-situ geotechnical properties using limited data
.
Structural Safety
79
:
26
–
38
. .
Stephens
MA
(
1974
)
EDF statistics for goodness of fit and some comparisons
.
Journal of the American Statistical Association, Taylor & Francis
69
(347)
:
730
–
737
, .
Stephens
MA
(
1976
)
Asymptotic results for goodness-of-fit statistics with unknown parameters
.
The Annals of Statistics
4
(2)
:
357
–
369
.
Uchida
N
,
Eto
Y
,
Ono
H
and
Miura
N
(
2004
)
Strength evaluation of deep mixing soil-cement by needle penetration test
.
Journal of the Japanese Society of Soil Mechanics and Foundation Engineering
52
(7)
:
23
–
25
.
(In Japanese)
.
Vanmarcke
EH
(
1977
)
Probabilistic modeling of soil profiles
.
Journal of the Geotechnical Engineering Division
103
(11)
:
1227
–
1246
.
Wijerathna
M
and
Liyanapathirana
DS
(
2019
)
Significance of spatial variability of deep cement mixed columns on reliability of column-supported embankments
.
International Journal of Geomechanics
19
(8)
:
04019087
. .
Zuo
J
,
Wang
B
,
Li
W
et al.
(
2023
)
Quality assessment and quality control of deep soil mixing columns based on a cement-content controlled method
.
Scientific Reports
13
(1)
:
4813
. .

Languages

or Create an Account

Close subscription notice
Close access options