


This study explores the use of isothermal calorimetry to assess heat release during the initial phases of dredged sediment (DS) stabilisation with the primary goal of predicting the 28-day unconfined compressive strength (UCS) and enhancing the stabilisation process’ quality control. The study was performed on DS samples collected from Göta river, Gothenburg, Sweden. The water content of the raw DS was set to 138%, 185%, and 291%, and mixing was performed with water-to-binder ratios 4, 5, 6, 7, and 8 using a binder consisting of 40% Portland limestone cement and 60% slag. The heat release measurements were conducted during the first 7 days of hydration, non-destructive free–free resonance tests were performed at 7, 14, and 28 days of hydration, and the 28-day UCS was done to assess the compressive strength of stabilised DS. For each water content, a statistical analysis was performed to determine the strength of the relationship, specifically using linear regression, to assess how well early calorimetric data could predict the UCS, and a correlation was found between the 28-day compressive strength and heat release of stabilised DS after 48 h of hydration. By measuring water content and heat release in the early stages of stabilisation, it is thus possible to assess the binder content and predict the ultimate compressive strength of a treated DS.
Notation
- E50
elastic modulus
- Edynamic
elastic modulus in small strain
- Ε(W/V)
calibration coefficient
- Gb
specific gravity of binder
- GS
specific gravity of DS
- GW
specific gravity of water
- Mb
mass of binder
- MS
mass of dry DS
- MW
mass of water
- P(W)
thermal power
- S/S
stabilisation/solidification
- U(V)
voltage that is transformed into heat flow
- Vp
compressive wave velocity
- Vs
shear wave velocity
- WC
water content
- ρ
bulk density of treated DS
- ρSDS
bulk density of treated DS
- Φ(W)
heat transfer rate
- τ (s)
time constant
1. Introduction
Dredging plays a vital role in managing waterways, rivers, lakes, and harbour basins, ensuring the necessary depth for navigation and supporting the construction of port and harbour infrastructure (Mink et al., 2006). The dredged sediments (DS) removed are typically soft marine soils characterised by high initial water content and low shear strength and are therefore unsuitable for use in the construction sector without prior treatment (Burt, 1996; Ross and Mehta, 1989; Xu et al., 2020). Chemical stabilisation is an effective method to improve the mechanical properties of DS. Within this approach, binding agents such as Portland cement and pozzolanic materials, including ground granulated blast furnace slag (GGBFS), a by-product of the steel industry, and fly ash (Abd-El.Aziz et al., 2012; Dermatas and Meng, 2003; Fernández Pereira et al., 2009; Yaghoubi et al., 2019; Zhang et al., 2020) are mixed with the sediments, leading to a reaction that generates a solid matrix. This process improves the geotechnical properties, thus making it possible to use sediments as construction materials (Barjoveanu et al., 2018).
A stabilisation project has different phases that are driven by specific criteria for the desired quality of the final stabilised in situ products. Initially, a laboratory trial mix test is conducted to determine the optimal type and quantity of binder. Secondly, a field test is carried out to validate the practicality of the mixing recipe. Finally, the project is executed based on the established mix design (Kitazume, 2021; Maher et al., 2013). To confirm that the desired quality of the stabilised soil is reached, quality assurance (QA) and quality control (QC) measures need to be applied before, during, and after production (Castellano et al., 2016; Chen et al., 2021; Liu and Zhang, 2021; Zhang et al., 2020; Zuo et al., 2023).
Numerous methods have been devised for appraising the mechanical properties of stabilised soil (Forsman et al., 2017). Typically, a combination of in situ and laboratory tests is employed. Standard tests such as the cone penetration test, standard penetration test, and plate load test are performed in the field, while the unconfined compressive strength (UCS) test is conducted in the laboratory to assess the quality of soil stabilisation. As the strength development in stabilised DS is slow, these QC tests must be conducted at quite long times after mixing to ensure that the product has a high enough strength level for the tests to be successful (Forsman et al., 2017; Larsson, 2005). Therefore, large volumes of treated DS can be produced before the quality of the treated DS is known, and it is very costly to re-stabilise or remove the treated DS if it does not fulfil the project’s requirement. Moreover, it is essential to acknowledge that the outcomes of in situ tests are limited to specific discrete points within the stabilisation area, potentially failing to provide a comprehensive assessment of the overall quality of the stabilisation process. Because of this limitation, a substantial number of tests are needed to obtain statistically significant results, emphasising the need to develop a comprehensive real-time and non-destructive QA/QC methodology to address this challenge effectively (Afrin, 2017; Ding et al., 2020; Makusa, 2013; Porbaha, 2002; Puppala et al., 2005; Puppala and Porbaha, 2004; Xu and Chang, 2016).
Seismic-based testing methods, such as ultrasonic pulse velocity (ASTM, 2024), are non-destructive techniques that can be used to follow the development of stiffness in hydrating specimens. Landis and Shah (1995) used such methods to convincingly illustrate that the wave propagation characteristics of cement-based materials, ranging from fine cement paste to concrete, can be quantified, establishing a clear correlation with the level of non-uniformity within the material. Furthermore, many researchers have performed free–free resonance (FFR) tests on cement-based specimens. They correlated compressive and shear wave velocity (Vp and Vs) with compressive strength and found that these velocities increased non-linearly with increasing compressive strength (Chaiprakaikeow et al., 2017; Guimond-Barrett et al., 2013; Hov et al., 2023; Jamsawang et al., 2022; Rydén et al., 2006; Traites, 2013). However, for this test to be feasible, specimens must attain a minimum level of strength. The time it takes to achieve the minimum strength is affected by initial water content and water-to-binder ratio (w/b).
An alternative approach for assessing the quality of stabilised soil involves measuring the heat generated during the binder reactions using an isothermal calorimeter. Isothermal calorimetry is a technique that quantifies the thermal power (heat production rate) produced by the hydration reactions of small samples of cementitious materials (Wadsö, 2005). This method allows for monitoring the cementitious binder’s overall reaction rate. It provides insights into binder behaviour not captured by a conventional compressive strength test, and it can give results from about 1 h after mixing. Researchers have successfully employed isothermal calorimetry to predict the strength of both mortars and concrete by establishing correlations between the heat of hydration and the compressive strength (Bentz et al., 2012; Frølich et al., 2016; Koenders et al., 2014; Kuryłowicz-Cudowska, 2022; Li et al., 2020). The primary aim of this study is to extend the application of the isothermal calorimetry method to the assessment of stabilised DS, a material with very high water content and low binder content compared with concrete. The objective is to establish a correlation between the heat release patterns at an early age and the compressive strength of the stabilised DS at, for example, 28 days in the laboratory scale. Such a correlation will enable us to estimate the long-term strength of the material at an early stage of development. In addition, such results can be used to validate that the correct amount of binder is used in stabilised DSs during field production.
2. Materials
2.1 Dredged sediment
The DS used was from Göta älv, Gothenburg, Sweden. It was stored in a closed container at the laboratory so that the sediment settled at the bottom. The water on top was decanted and stored in another container. The resulting DS was sieved through a 4-mm mesh to obtain a uniform sample (Gholampoor et al., 2024) called batch A. This batch was thoroughly homogenised by mixing for 5 min using an electric paddle mortar mixer and samples were taken for determining water content (by EN-1097-5-2008) and density (by measuring the mass of 1000 ml of DS). The density and water content of batch A were 1340 ± 22 kg/m3 and 138.0 ± 0.3%, respectively (mean ± standard deviation, n = 8). Density was measured by weighing 1 l of material and the water content was determined by weighing before and after drying at 110°C. The material classification of the batch A material according to grading analysis (SS 027123 (SIS, 2024a)) was clayey silt and the average organic content was 6% (SS 27105 (SIS, 2024b)). The measured liquid limit of batch A was 83%. The test was performed according to ASTM standard (ASTM, 2010). No chemical analysis was made.
Two other batches with higher water contents were created from batch A by additions of the decanted water. These batches, B and C, had water contents of 185.0 ± 0.4% and 291.0 ± 0.9% and densities of 1241 ± 20 and 1163 ± 5 kg/m3, respectively. Water content levels of 138%, 185%, and 291% were selected to reflect the typical range of moisture found in DS in situ.
2.2 Binder
The binder was made from 40% Portland limestone cement (CEM II/A-LL 42.5 R, EN-197) and 60% of a GGBFS (Merit, Swecem) (‘Standard - Ground granulated blast furnace slag for use in concrete, mortar and grout – Part 1’), a binder combination used for ground stabilisation in Sweden. Table 1 shows the composition of these materials.
2.3 Sample preparation
For each batch A, B, and C, mixtures were made with w/b of 4, 5, 6, 7, and 8. This experiment matrix was repeated twice with similar results even if there were some problems with the temperature stability during the first run. The results of the second run are presented here. The mixing was made with a KitchenAid Artisan stand mixer with a flat beater. The mixing time was 5 min, and the mixing speed was 75 rpm. For the mixing process, 1.5 kg of DS was taken, binders were added according to w/b, and mixing was initially made for 1 min. The mixer was then halted to scrape off any material adhering to the blade and the bowl. Following this, the mixing continued for an additional 4 min. Two samples for FFR and UCS were prepared from each mixing by pouring the treated DS into plastic tubes with a bottom plug measuring 50 mm in diameter and 170 mm in height. The plastic tubes were filled in three layers and tapped against the floor around 50 times after filling each layer to remove air. The specimens were placed in a water bath at 20°C for 7 days. Following this, the specimens were removed from the plastic tubes, trimmed to a height-to-diameter ratio of 2, and FFR tested. Water content was measured on the removed part, and the bulk density of the samples was determined on the FFR specimens. The specimens were stored at 20°C in plastic bags with moist tissue paper to prevent drying. At 7, 14, and 28 days, FFR tests were performed, and at 28 days UCS measurements were made.
For measuring the heat release by isothermal calorimetry, samples were taken by step-wise pouring treated DS into 120-ml plastic vials containing cylindrical plastic meshes (25 mm inner diameter, 50 mm in height), and tapping them against the table to remove air. Then, the vessels were capped and placed in calorimeters (I-Cal Betong, Calmetrix Inc) at 20°C and measured at 7 days.
The cylindrical plastic meshes were used to easily extract cylindrical samples (50 mm length, 25 mm diameter) of the materials that had been measured on in the calorimeters to make FFR measurements on them at 7, 14, and 28 days. One sample of untreated DS (no binder) with a water content of 185% was taken as a reference measurement for heat release. It showed essentially zero thermal power.
To investigate the influence of w/b and the DS on the rate of hydration, calorimetric measurements were also made on pastes made with the same binder as above and with w/b ratios of 0.4, 0.6, 0.8, 1, 2, 4, and 8. The mixing of these sample were made by hand in the 120-ml plastic vials.
3. Test methods
3.1 Unconfined compressive strength
The conventional laboratory method for assessing the quality of treated DS is the UCS test. The 2:1 cylinder strength was measured in accordance with the specifications outlined in EN ISO 17892-7 (SIS (Swedish Institute for Standards), 2017). In this study, the UCS test was performed on samples of 50 mm diameter and 100 mm height after 28 days of curing and the strain rate was 1 mm/min until the samples failed or the strain reaches 15%.
3.2 Non-destructive free–free resonance test
The free–free resonant frequency measurement (FFR), also called the free–free resonant column in the civil engineering field (Ryden, 2009a), is a non-destructive test suitable for measuring small-strain elastic modulus of cemented-based materials or cohesive soils in the laboratory by applying a one-dimensional wave-spread theory on an elastic rod. The small-strain elastic modulus can be correlated with the frequencies obtained from cylindrical test specimens, if their length is greater or equal to twice their diameter. The cylindrical specimens are positioned horizontally on a layer of soft foam, thus approximating free boundary conditions. A small hammer is used to initiate vibrations in the specimens. The hammer’s mass is concentrated at the point of impact with sufficient mass to induce measurable vibrations without excessively displacing or damaging the specimen. Recording the specimen’s vibrational response was achieved using a compact-size accelerometer (PCB Piezoelectronics 352C33 and 352B10).
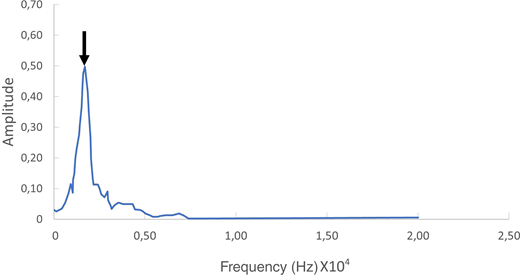
Depending on the placement of the accelerometer and the origin of the vibration source, FFR can measure the frequency of vibration in two orientations: longitudinal (axial), which can be utilised to determine the compressive wave velocity (Vp), and transversal, which provides the frequency for calculating shear wave velocity (Vs). Figure 1 illustrates the longitudinal frequency assessment that was used in the present study, and Figure 2 shows an example of a frequency measurement. By selecting the primary dominant frequency and applying Equation 1, the values for Vp of the specimen can be calculated (Ahnberg and Holmen, 2008; Åhnberg and Holmén, 2011; Ryden, 2009b; Rydén et al., 2006).
Here, Vp (m/s) is compressive wave velocity, fp (Hz) is axial frequency of vibration, and L (m) is the sample length. From the compressive wave velocity, the dynamic elastic modulus in small strain Edynamic (Pa) was calculated by Equation 2 (Verástegui-Flores et al., 2015).
where ρ (kg/m3) is the bulk density of the treated DS.
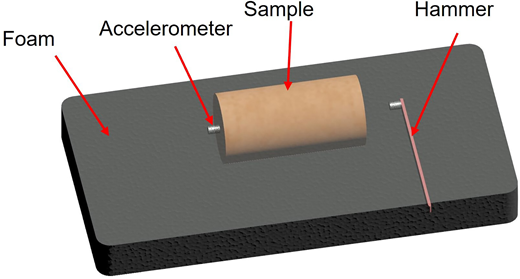
Free–free resonance frequency test, longitudinal measurement. The sample is placed on foam (black) and hit with small hammer (right); the signal is detected by the accelerometer (left)
Free–free resonance frequency test, longitudinal measurement. The sample is placed on foam (black) and hit with small hammer (right); the signal is detected by the accelerometer (left)
3.3 Isothermal calorimetry
Two I-Cal Betong (Calmetrix Inc.) instruments, each with eight isothermal heat conduction calorimeters, were used to measure the heat release rate (thermal power) on hydrating treated DS samples. These field calorimeters have a sample size of 120 ml and have fixed references. The heat produced by the sample is conducted away to a thermostated environment to maintain a constant temperature. Within an isothermal heat conduction calorimeter, heat flow sensors quantify the heat transfer rate Φ (W) from the specimens to the calorimetric heat sink. The output from these heat flow sensors is a voltage U (V) that is transformed into heat flow by multiplication with a calibration coefficient ε (W/V). The calibration coefficients were measured by applying a known thermal power with electrical heaters; in the present case, the heaters were placed in metal disks inside the same type of plastic vials as was used in the measurements. It should be noted that there is a difference between the heat flow that leaves a sample and the thermal power that is produced in a sample; because of the thermal lag of the instrument, these are not equal if the thermal power is changing rapidly, as it is in the beginning of a hydration measurement.
A second parameter of interest is the baseline U0 (V), the voltage when there is no heat production in the sample position. This voltage is usually close to zero, but it is still important to measure it accurately if the calorimetric output is to be integrated, as, in the present study, a baseline error will add up during integration and can produce a significant error in the calculated heat. The application of the calibration coefficient and the baseline is done by Equation 3.
A third parameter that can be of interest is the time constant τ (s), which is a measure of the thermal inertia of the sample and the calorimeter. With the time constant, the so-called Tian correction can be applied to decrease the influence of the thermal inertia (time lag) on a measurement in which rapid changes in thermal power P (W) occurs (Equation 4).
In an ideal case, the Tian equation converts the measured heat flow to actual thermal power produced in a sample. However, the Tian equation is only approximate and can thus only produce a partial correction of the time lag, and for the present measurements, it is only of interest for the first hours after mixing, when rapid changes in the heat flow occur.
A fourth factor to consider is that when we charge a sample into the calorimeter, the calorimeter will be thermally disturbed (as the sample has a different temperature from the calorimeter). In the present calorimeters, this disturbance will last for about 1 h, but this time is shortened to about 30 min when the Tian equation is applied. The initial disturbance causes problems with the integration of the result to give the heat, as we do not want to include the initial disturbance in the integral. The solution is to start the integration after a certain time after a sample was charged; we have chosen 1 h in the present study; this means that heat produced before 1 h is not included in the heat integral.
4. Results and discussion
4.1 Water content and bulk density 7 days after stabilisation
Figure 3 shows the average measured bulk density and water content of the treated DS after 7 days of curing, compared with the calculated initial bulk density and water content. Equation 5 determines the bulk density , which requires the masses of water, solids, and binders and their volumes (specific gravities). Dry DS, cement, and GGBFS were assumed to have specific gravities of 2.7, 3.15, and 2.9, respectively. The water content was calculated by adding the dry binder mass to the DS, that is, by assuming that no hydration – that both decreases the amount of water and increases the amount of solid – had taken place.
where MS is mass of dry DS (g), Mb is mass of binders (g), Mw is mass of water (g), Gw, Gs, and Gb are specific gravity of water, dry DS, and binders (g/cm3).
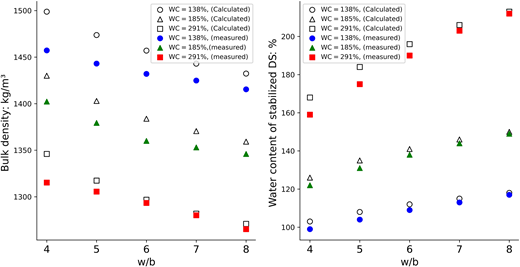
Bulk density and water content of treated DS plotted against water-to-binder ratio. Open markers show initial values calculated as described in the text; solid markers show measured values after 7 days of curing
Bulk density and water content of treated DS plotted against water-to-binder ratio. Open markers show initial values calculated as described in the text; solid markers show measured values after 7 days of curing
According to the results, both calculated and measured density decrease by increasing the w/b due to less binder. Moreover, there is a difference between calculated and measured bulk density, and by increasing the w/b and decreasing binder content, the differences are reduced. This difference is probably due to entrapped air in samples after preparation, which is not taken into account in the calculations. The right diagram shows that both calculated and measured water content decrease by decreasing w/b. The reduction in soil water content commonly observed after stabilisation results from the incorporation of dry binders into the soil and the binding of water in chemical reaction products during hydration (Alrubaye et al., 2016; Cui and Fall, 2018). Also, water evaporation during mixing may influence the water content, but only to a minor extent in our study. The calculated water content is higher than the measured water content, which was measured 7 days after curing because during the hydration process, water was consumed by binders (Lu et al., 2023), and as is seen in Figure 3, by increasing the content of the binder, the water consumption increases, and the differences between calculated and measured water content increases.
4.2 Free–free resonance test
Figure 4 presents the compressive wave velocity (Vp) obtained through the FFR test at 7, 14, and 28 days conducted on samples with a diameter of 50 mm and a length of 100 mm. As expected, an increase in water content leads to a decrease in Vp for samples with the same w/b. The FFR test is most effective on samples that possess sufficient strength, and the initial water content influences its performance. In samples with a high water content (WC = 291%), after 7 days of curing, the compressive wave velocity (Vp) remains relatively consistent across different w/b. However, at 14 and 28 days of hydration, an increase in w/b results in a slight decrease in Vp. Conversely, in samples with lower water content (WC = 138%), Vp decreases sharply with increasing w/b. Notably, samples with a w/b ratio of 8 exhibit similar compressive wave velocities regardless of the water content, whereas those with a w/b ratio of 4 show more significant differences. Figure 5 shows the same type of results as Figure 4, but on calorimetric samples that are only 50 mm in length (compared with 100 mm for the UCS samples). The results show the same pattern, indicating that the smaller specimens also give useful results.
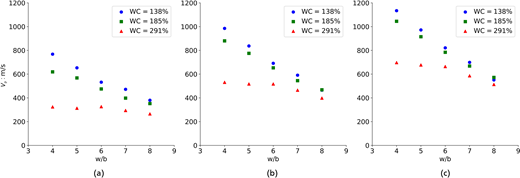
Compressive wave velocity on samples with diameter 50 mm against w/b: (a) 7 days, (b) 14 days, (c) 28 days
Compressive wave velocity on samples with diameter 50 mm against w/b: (a) 7 days, (b) 14 days, (c) 28 days
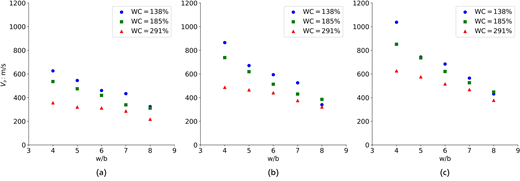
Compressive wave velocity measured on samples with 25 mm diameter against w/b: (a) 7 days, (b) 14 days, (c) 28 days
Compressive wave velocity measured on samples with 25 mm diameter against w/b: (a) 7 days, (b) 14 days, (c) 28 days
In Figure 6, a comparison is presented between the results from FFR measurements on specimens of the two different sizes. It is seen that there is a good correlation but that the larger UCS samples tend to give higher values. The 1:1 slope and the linear correlation between the datasets have a difference in slope of about 15%. The findings are consistent with previous research, which indicates that wave velocity is influenced more by a material’s homogeneity than by specimen size, provided that the length-to-diameter ratio is maintained at 2.0 (Ersoy et al., 2019; Fener, 2011).
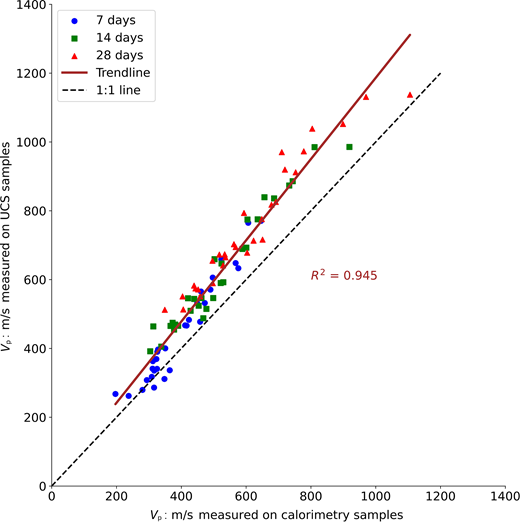
Correlation between compressive wave velocity measured on samples with diameter 25 mm (x-axis) and samples with diameter 50 mm (y-axis) at 7, 14, and 28 days after treatment
Correlation between compressive wave velocity measured on samples with diameter 25 mm (x-axis) and samples with diameter 50 mm (y-axis) at 7, 14, and 28 days after treatment
Note that specimen size does not enter the evaluation equation, so the result that smaller samples also can be used only shows that the measurement method reproduces the ideal conditions of the FFR test (like that the sample does not interact with the surroundings and that the mass of the microphone is negligible compared with the mass of the sample). The slight deviation of the results in Figure 6 from 1:1 may result from that the conditions for the small samples are slightly less ideal than for the larger samples. Nevertheless, our results show that the smaller samples are also useful for following the development of the mechanical properties.
4.3 Compressive strength and elastic modulus
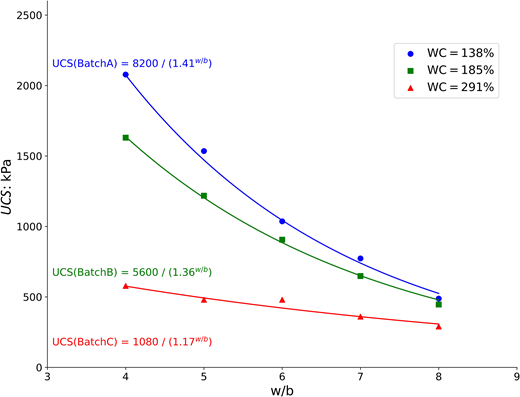
The compressive strength (USC) at 28 days was determined, and stress–strain diagrams were generated for each test; representative diagrams are given in Figure 7, while Figure 8 illustrates the 28-day compressive strength as a function of the w/b. The measured UCS exhibits a similar trend as Vp; by decreasing w/b, the mechanical properties are improved, but the relative improvement is not the same for different water contents. For instance, with a water content of 291%, the average maximum and minimum strengths are 550 and 290 kPa, respectively (a ratio of about 2), while at a water content of 138%, the average strengths range between 2040 and 470 kPa (a ratio of about 4).
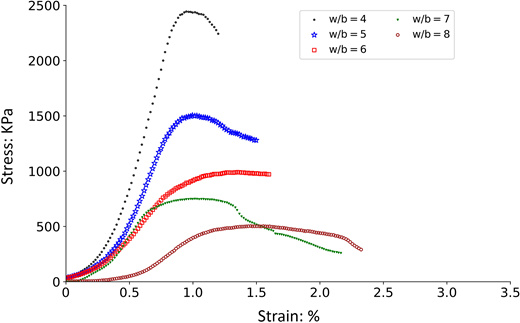
Adding binders enhances the strength and stiffness of the raw soils and results in a transition from a ductile or cohesive nature to a more brittle state. In Figure 7, we can observe that as the maximal strain increases, the compressive strength decreases. The curve shapes that are shown in Figure 7 are normal for stabilised DS (Lindh and Lemenkova, 2023).
It has been shown that Abrams’ law (Abrams, 1918; Equation 6), an empirical correlation between w/b and compressive strength (UCS) originally formulated for concrete, also works for stabilised soil, and the values of B = 1.17 – 1.41 obtained in the present study are similar to findings from prior investigations (Hov et al., 2022; Hov and Larsson, 2023; Miura et al., 2001).
The static elastic modulus (E50) of treated DS is modulus of elasticity at 50% strength derived from the stress–strain diagrams of UCS tests, while the dynamic elastic modulus is calculated with Equation 3 from measured compressive wave velocity. Figure 9 presents these two elastic moduli for the present samples.
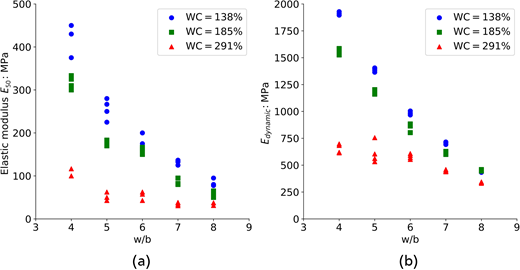
Elastic moduli against w/b for different water content: (a) static elastic modulus (E50), (b) dynamic elastic modulus
Elastic moduli against w/b for different water content: (a) static elastic modulus (E50), (b) dynamic elastic modulus
4.4 Isothermal calorimetry
Representative results for thermal power and cumulative heat release, both per mass of binder, are given in Figure 10. The heat was calculated by integrating the thermal power, starting 1 h after mixing. As all results are given per mass of binder, the diagrams show the hydration kinetics of the binder.
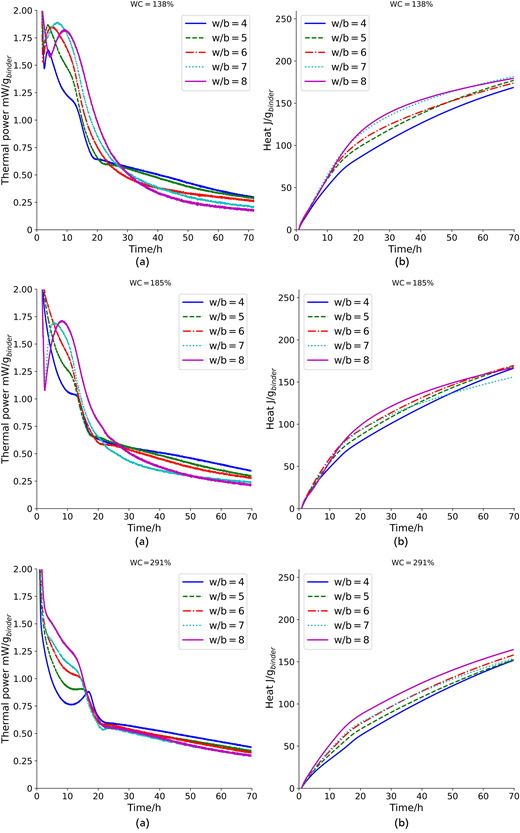
(a) Thermal power per mass of binder as a function of time, (b) cumulative heat release per mass of binder against time
(a) Thermal power per mass of binder as a function of time, (b) cumulative heat release per mass of binder against time
Because of the uncertainty in the baseline, the uncertainty in the heat increases with time of integration. We have therefore only given results up to 70 h, where we estimate that the uncertainty in the heat is ±5 J/gbinder (based on two standard deviations of the differences between two baseline determination made during the measurement period).
We have also made measurements on binder pastes (no DS) with different w/b; these results are seen in Figure 11. When comparing the results of Figures 10–11, the following are seen.
- ▪
The initial kinetics are rather different for pastes and treated DS, but after about 24 h, all curves follow similar trajectories, and the heat produced after 48 h is in the same order.
- ▪
The induction period followed by the main hydration that is seen for all the paste samples – irrespective of their w/b – is not seen in the treated DS.
- ▪
For pastes, the 24 h heat production is higher for lower w/b, but for treated DS, for each water content (WC) the heat is higher for higher w/b. However, when the different WC are compared, lower WC gives higher heat.
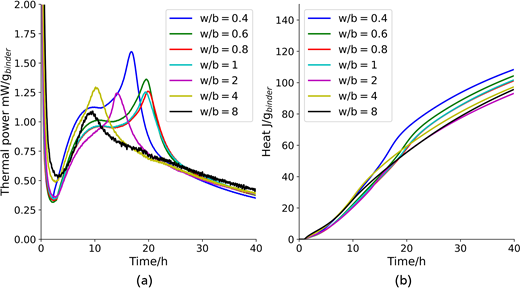
Results for cement paste (no DS). (a) Thermal power as a function of time, (b) cumulative heat release per mass of binder against time for cement paste
Results for cement paste (no DS). (a) Thermal power as a function of time, (b) cumulative heat release per mass of binder against time for cement paste
The differences seen between the neat pastes and the treated DS are caused by soluble substances in the DS. It is well known that many different substances influence the hydration kinetics of binders (Weeks et al., 2008). Although we have not assessed the content of soluble compounds in the DS used in the present study, we can envision that the high organic content (6%) can influence the hydration kinetics. It is common that organic soils and humic acids retard cement hydration (Beddaa et al., 2019), but in the present study, there was no clear retardation.
When a DS is combined with a binder, the thermal power and heat release profiles are unique fingerprints that show the kinetics of the hydration. Calorimetric data from cement paste measurements or measurements with other types of DS should not be used to predict outcomes for a new project involving a different DS. In a worst-case scenario, contaminants in a DS can delay or inhibit (Garci Juenger and Jennings, 2002) the hydration process and render the solidification process without effect on the mechanical properties.
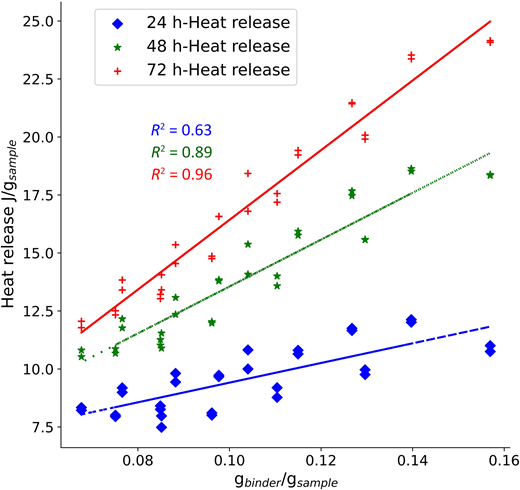
In the present laboratory study, the mass of binder in each sample was known and the results was therefore plotted per mass of binder. In the field, calorimetry can instead be used to assess that the correct amount of binder has been used in a treated DS. To show how this can be done, our measured heats at 24, 48 and 72 h have in Figure 12 instead been plotted per mass of sample The relations between heat per mass of the sample and mass of binder per mass of the sample are linear, with an R2 > 0.95. These results indicate that the binder content can be estimated from heat release and that isothermal calorimetry thus can be used as a QC tool in the field.
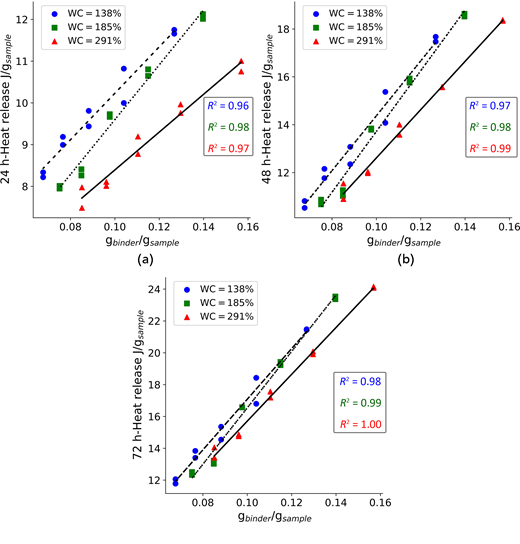
Normalised heat release correlated with normalised binder mass: (a) 24 h, (b) 48 h, (c) 72 h. Note the different scales of the y-axis.
Normalised heat release correlated with normalised binder mass: (a) 24 h, (b) 48 h, (c) 72 h. Note the different scales of the y-axis.
Figure 13 illustrates the relationship between normalised binder content and normalised heat release for all water contents. The data show that, after 48 h of curing, there is a fair correlation between binder content and heat release for all samples (R2 > 0.89).
4.5 Correlation between UCS and heat release
The primary objective of this study is to establish a correlation between 28-day UCS and heat release after 1 or 2 days, providing a method to assess the quality of treated DS in its early state. In Figure 14, plots of 28 days UCS against heat release for the three water contents show linear correlations, showing that short-term heat together with initial moisture content can be used as an indicator of long-term strength. The three graphs represent 24 h, 48 h, and 72 h heat release compared with 28-day UCS. In the 24 h graph, two of the regression lines cross, making the use of the data uncertain, but for the 48 h data, the result is good enough to be used to predict 28-day UCS from the heat and the water content.
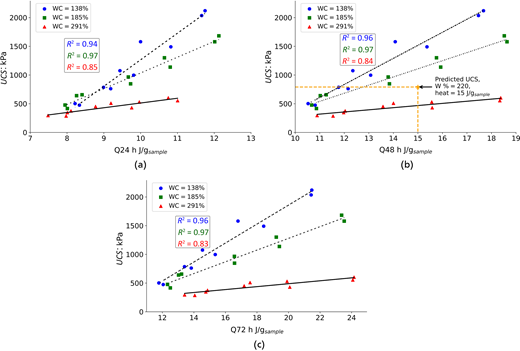
Heat release against UCS correlation: (a) 24 h after curing, (b) 48 h after curing, (c) 72 h after curing
Heat release against UCS correlation: (a) 24 h after curing, (b) 48 h after curing, (c) 72 h after curing
The correlation between heat release and UCS is linear, with R2 ≥ 0.96 for water content less than 200% and R2 = 0.84 for water content 291%. Note that these results are specific to the DS–binder combination tested in this study and will not apply to all types of DS and binders. In practical terms, the following procedure can be used to evaluate the quality of treated DS in the field at an early stage.
- ▪
Perform isothermal calorimetry tests at up to, for example, 2 days and UCS at 28 days (or longer time) with the relevant DS and binder and with different combinations of w/b and water contents.
- ▪
Create relations between short-term heat release (at, e.g., 48 h) and long-term UCS for different water contents.
- ▪
In the field, take fresh samples of treated binder and measure water content and heat release (during, e.g., 48 h).
- ▪
To predict the UCS, integrate the thermal power to get the heat and find the UCS corresponding to the measured water content by interpolation in the y-direction. Figure 14(b) shows an example of this.
5. Conclusion
We have presented a method to control the quality of stabilised DS at the early stage, while the treated sediments are still fresh and capable of being re-stabilised or removed if the quality of treated sediment does not fulfil the project’s requirements. Based on mechanical measurements and calorimetric measurements of treated DSs with different water and binder contents, we found the following.
- ▪
The modulus of elasticity and compressive wave velocity have the same trend as compressive strength.
- ▪
A linear correlation exists between compressive wave velocity measured for standard samples with 50 mm diameter and samples from calorimetric measurements with 25 mm diameter.
- ▪
Measurements with isothermal calorimetry for 48 h can be used to assess the content of the binder in the mix. This can then be used together with the water content to predict the 28-day strength and thus to be used as a QC control measure in the field.
6. Research significance
We introduce a novel method for the early QC of stabilised DS using 48 h isothermal calorimetry to predict the long-term UCS. The ability to correlate heat production within the first 48 h of hydration with the 28-day UCS provides a rapid, non-destructive, and reliable approach to assessing stabilisation quality early in the process. This method could be used both at the laboratory phase and in the field. The findings have significant practical implications for large-scale construction and dredging projects where treated sediments are reused as construction material. This method allows for the early detection of stabilisation issues, reducing the need for costly rework and ensuring that the material meets strength requirements before large volumes are produced. This approach enhances project efficiency and contributes to sustainability by supporting the reuse of DSs in construction, minimising waste and environmental impact. From a scientific standpoint, this study expands the use of isothermal calorimetry beyond its traditional application in cement and concrete studies, applying it to a new material with high water content and low binder ratios. This contribution adds to the growing body of knowledge on early-stage strength prediction techniques, providing a foundation for future research on various binder–sediment combinations in geotechnical engineering.
Acknowledgements
Funding for the work was provided by PEAB, SBUF (Development Fund of the Swedish Construction Industry), and Trafikverket (Swedish Transport Administration), within the framework of the projects ‘Metodik för stabilisering av muddermassor’ (project id: SBUF 13692).

