


The use of recycled aggregates in road pavements can markedly contribute to more sustainable infrastructures, minimising the extraction of virgin aggregates and using secondary materials that would otherwise be discharged into the environment with negative impacts. In Portugal, as in most Southern European countries, most of the recycled aggregates coming from construction and demolition waste are mixed or non-selected recycled aggregates, containing concrete and mortars, natural aggregates, masonries, among others. These materials are considered as low-quality recycled aggregates, due to poor mechanical properties, namely, their resistance to fragmentation and to wear, and as a result their use in roadway pavement layers is frequently unfeasible. This paper presents the results of a laboratory study on mixtures of a non-selected recycled aggregate with natural and tyre rubber aggregates, with a primary focus on resistance to fragmentation. The study also discusses the fragmentation resistance across different aggregate sizes. The results show that to achieve a meaningful improvement in the fragmentation resistance of the recycled aggregate, it should be blended with very high-quality all-in-aggregates. The addition of tyre-derived aggregate (TDA) to recycled and natural aggregates markedly improves fragmentation resistance; however, the concentration of zinc in the TDA leachate exceeds the regulatory limit.
1. Introduction
The population growth and the rapid industrialisation have been contributing to the increase of waste production from a wide range of human activities. Among these activities are those from the construction industry, where construction and demolition waste (CDW) accounts for more than a third of all waste generated in the European Union (EC, 2025). The need to find solutions to avoid landfilling of inert waste and preserve the natural resources is nowadays imperative. The use of recycled aggregates coming from CDW in roadway pavement layers can markedly contribute to more sustainable infrastructures, minimising the extraction of virgin aggregates and using secondary materials that would otherwise be discharged into the environment with negative impacts. This solution represents a meaningful contribution to the Sustainable Development Goals (SDG) set out in the United Nations’ 2030 Agenda.
In recent decades, many studies on the use of recycled aggregates in base and sub-base layers of transport infrastructures have emerged (Jiménez et al., 2012; Arulrajah et al., 2014; Diagne et al., 2015; Yaghoubi et al., 2017; Freire et al., 2019; Yaghoubi et al., 2021; Vieira et al., 2022). Jiménez et al. (2012) evaluate the behaviour of a mixed recycled aggregate, from non-selected CDW, in the surface course of an unpaved rural road. These authors have concluded that the mixed recycled aggregate did not meet the limits of the chemical properties imposed by the Spanish regulations, especially for sulfur compounds and soluble salt content (Jiménez et al., 2012).
Arulrajah et al. (2014) carried out a comprehensive laboratory study of physical and shear strength properties of recycled concrete aggregate (RCA), crushed brick, reclaimed asphalt pavement (RAP), waste excavation rock, and recycled glass. They found that RCA, crushed brick, and waste excavation rock meet the physical and shear strength requirements for aggregates in pavement base and subbase applications. The Los Angeles (LA) abrasion coefficient for the RAP exceeded the threshold.
Diagne et al. (2015) performed a laboratory investigation on the use of recycled clay bricks mixed with RCA for unbound bases of roadways. The hydraulic properties, the effects of weathering (wet-and-dry cycles, freeze-and-thaw cycles) and degradation (Los Angeles, Micro-Deval) behaviour of the mixtures (recycled clay brick of 0%, 5%, 15%, and 30%) were evaluated. Diagne et al. (2015) have concluded that Micro-Deval and Los Angeles abrasion coefficients increased with the percentage of recycled clay bricks on the specimens, while the opposite trend was observed with regard to the resilience modulus. Azam and Cameron (2012) reported that the replacement of 20% of RCA with recycled crushed clay masonry increased the LA value by ≈6.
Yaghoubi et al. (2017) investigated the use of different laboratory compaction techniques (static method and modified Proctor) on the mechanical performance of pavement materials, namely, crushed bricks and RCA. The authors have concluded that RCA specimens show greater unconfined compressive strength, greater stiffness, and greater resilient modulus compared to crushed bricks specimens.
Freire et al. (2019) conducted a laboratory study to evaluate the geometrical, physical, mechanical, and environmental properties of RAP, processed through milling and crushing, with the aim of assessing its suitability for use in unbound granular pavement layers. The authors have concluded that particle size distribution of these recycled materials does not fulfil the best particle size distribution for their application in unbound granular layers. In general, both crushed and milled RAP are suitable for use in unbound granular layers of road pavements. However, crushed RAP showed better physical and mechanical properties.
A laboratory evaluation was undertaken by Arulrajah et al. (2019) to assess the particle size distribution, the pH, the plasticity index, the foreign materials content, the modified Proctor compaction, the California bearing ratio, and the resilient deformation of RCA blended with tyre-derived aggregates (TDAs). In the study conducted by these researchers, TDAs were incorporated into RCA at proportions of 1%, 2%, and 3% by weight.
Apart from the study by Arulrajah et al. (2019), the use of TDA has mainly been investigated in soil mixtures. These studies use tyre rubber materials with particle size from powder to shreds, and TDA contents (ratio of the weight of rubber to that of dry soil) mainly between 2% and 30%, although studies involving samples with soil-to-rubber ratios varying between 0 and 100% can be found (Akbarimehr et al., 2020).
As reported, most of the studies found in the literature on the use of recycled aggregates in pavement layers focus on selected materials such as RCA, crushed bricks, or RAP. The current study was designed to respond to an issue faced by a waste management operator, which has difficulty in marketing a mixed (i.e. non-selected) recycled aggregate, with a narrow range of particle size, due to its poor physical and mechanical performance. To enhance the performance of the mixed recycled aggregate, blends with natural granite aggregates of different grain sizes and origins, as well as with a rubber aggregate (TDA) were studied.
This study covers the resistance to fragmentation through the LA abrasion test and the geoenvironmental characterisation of the recycled and TDAs. The behaviour of different aggregate sizes (>4, 10/14, and 16/31.5 mm) is assessed, along with the performance improvement of the mixed recycled aggregate through blending with natural and TDAs. The present paper is an extended version of the conference paper presented in the 5th International Conference on Transportation Geotechnics by Vieira and Pereira (2024).
2. Materials and methods
2.1 Materials
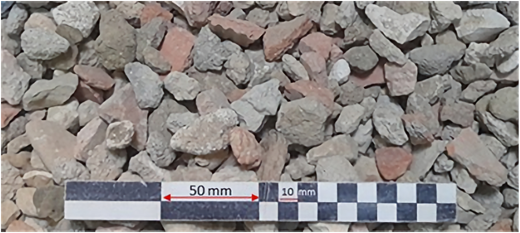
The recycled material used in this study results from the construction and demolition (C&D) waste recycling process performed at a recycling facility located in the Central Region of Portugal. Materials with different particle sizes distribution are produced during the recycling process. The studied material has particle sizes between 10 and 30 mm and is commercially available under the designation CDW10/30 (Figure 1). The material has a very narrow particle size distribution, different constituents (concrete, mortars, natural aggregates, clay masonries, bituminous materials, soil, and glass) and poor mechanical performance, particularly with regard to its resistance to fragmentation. These limitations motivated the present study, which aims to enhance the material’s performance through blending with natural aggregates in the first phase of the study and with natural and TDAs in a subsequent phase.
A preliminary study was conducted blending the recycled aggregate with natural aggregates available in the laboratory (Phase 1). The results of Phase 1 were those presented and discussed in the conference paper (Vieira and Pereira, 2024). The study was complemented by studying mixtures with a new natural aggregate (with better mechanical behaviour) and a TDA (Phase 2).
In the preliminary study, one all-in-aggregate – AIA1 (Figure 2(a)), a coarse aggregate with minimum/maximum particles dimension of 14/20 mm – coarse aggregate 1 – CA1 (Figure 2(b)), a coarse aggregate with particle size 4/10 mm – coarse aggregate 2 – CA2 (Figure 2(c)), and a fine aggregate with particle size 0/4 mm – FA (Figure 2(d)) were used to produce different mixtures. In Phase 2, another all-in-aggregate (AIA2) with better mechanical resistance (Figure 2(e)) and a coarse TDA coming from the recycling of end-of-life tyres (Figure 2(f)) were used.
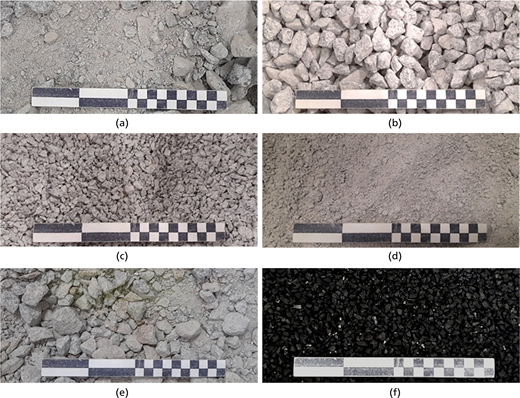
Aggregates mixed with the recycled C&D material: (a) all-in-aggregate 1 – AIA1; (b) coarse aggregate 14/20 mm – CA1; (c) coarse aggregate 4/10 mm – CA2; (d) fine aggregate 0/4 mm – FA; (e) all-in-aggregate 2 – AIA2; (f) tyre-derived aggregate – TDA (on the ruler, one square represents 10 mm)
Aggregates mixed with the recycled C&D material: (a) all-in-aggregate 1 – AIA1; (b) coarse aggregate 14/20 mm – CA1; (c) coarse aggregate 4/10 mm – CA2; (d) fine aggregate 0/4 mm – FA; (e) all-in-aggregate 2 – AIA2; (f) tyre-derived aggregate – TDA (on the ruler, one square represents 10 mm)
All the natural aggregates used in this study (Phase 1 and Phase 2) were obtained through the mechanical fragmentation of granite rocks and have come from the North Region of Portugal. The all-in-aggregates contain a mixture of fine and coarse particles and are characterised by continuous particle size distribution (Figure 3). AIA2 was obtained from a high-quality granite rock, exhibiting higher resistance to wear and fragmentation.
 The graph shows percentage passing on the vertical axis from 0 to 100 percent and particle size in millimeter on the horizontal axis ranging from 0.063 to 63 millimeter. Five curves are presented for C D W 10 30, all in aggregate, coarse aggregate 1, coarse aggregate 2, and fine aggregate. Fine aggregate has the highest percentage passing at small particle sizes and increases steadily to 100 percent at larger sizes. All in aggregate increases gradually across the entire size range. Coarse aggregate 2 shows a sharp increase between about 4 and 10 millimeter and reaches nearly 100 percent near 16 millimeter. Coarse aggregate 1 remains low at smaller sizes and rises sharply near 16 to 20 millimeter. C D W 10 30 increases gradually at smaller sizes and then rises steeply beyond about 10 millimeter, approaching 100 percent at larger particle sizes.
Particle size distribution of the aggregates used in the study
The graph shows percentage passing on the vertical axis from 0 to 100 percent and particle size in millimeter on the horizontal axis ranging from 0.063 to 63 millimeter. Five curves are presented for C D W 10 30, all in aggregate, coarse aggregate 1, coarse aggregate 2, and fine aggregate. Fine aggregate has the highest percentage passing at small particle sizes and increases steadily to 100 percent at larger sizes. All in aggregate increases gradually across the entire size range. Coarse aggregate 2 shows a sharp increase between about 4 and 10 millimeter and reaches nearly 100 percent near 16 millimeter. Coarse aggregate 1 remains low at smaller sizes and rises sharply near 16 to 20 millimeter. C D W 10 30 increases gradually at smaller sizes and then rises steeply beyond about 10 millimeter, approaching 100 percent at larger particle sizes.Particle size distribution of the aggregates used in the study
The TDA was supplied by a recycling facility for end-of-life tyres and consists of rubber granules with particle sizes ranging between 2 and 4 mm (Figure 3). A specific density of 1150 kg/m³ was obtained, which is within the range of values provided in its technical data sheet (1100–1200 kg/m³).
Figure 3 shows the particle size distribution of all the materials used in both phases of the study, and Table 1 summarises some particle size properties.
Some particle size properties of the aggregates
| Material | Dmax*: mm | D50: mm | Coefficient of uniformity, Cu |
|---|---|---|---|
| Recycled C&D material, CDW | 40.0 | 14.6 | 15.8 |
| All-in-aggregate 1, AIA1 | 40.0 | 4.5 | 70.8 |
| Coarse aggregate 1, CA1 | 31.5 | 17.0 | 1.4 |
| Coarse aggregate 2, CA2 | 12.5 | 5.6 | 2.8 |
| Fine aggregate, FA | 6.3 | 0.7 | 15.9 |
| All-in-aggregate, AIA2 | 40.0 | 5.6 | 60.0 |
| Tyre-derived aggregate, TDA | 8.0 | 3.8 | 1.4 |
*Smallest sieve size through which 100% of the aggregate passes (not necessarily the nominal maximum size)
2.2 Mixtures
In the preliminary study (Phase 1), three mixtures were tested, trying to ensure that their particle size distribution fall within the upper and lower limits of grading and fulfil the minimum requirement for fragmentation resistance stipulated by the Portuguese Road Infrastructures Management Entity for base and sub-base layers of roadways: LA abrasion coefficient lower than 40% and 45%, respectively. For this initial study, only natural aggregates available in the laboratory were used.
Mixture 1 combines 50% by weight of recycled C&D waste (50CDW) with 50% of the all-in-aggregate 1 (50AIA1). In the Mixture 2, the proportion of the recycled aggregate decreased to 30% and the all-in-aggregate increased to 70%. Mixture 3 combines 30% of the recycled aggregate with two coarse aggregates (CA1 and CA2 – Figures 2(b) and 2(c)) and the fine aggregate (Figure 2(d)). Table 2 summarises the composition of the mixtures tested in Phase 1.
Composition of the mixtures in the preliminary study (Phase 1)
| Mixture number | Mixture composition | CDW: % | All-in-aggregate 1: % | Coarse aggregate 1: % | Coarse aggregate 2: % | Fine aggregate: % |
|---|---|---|---|---|---|---|
| Mixture 1 | 50CDW + 50AIA1 | 50 | 50 | 0 | 0 | 0 |
| Mixture 2 | 30CDW + 70AIA1 | 30 | 70 | 0 | 0 | 0 |
| Mixture 3 | 30CDW + 15CA1+30CA2+25FA | 30 | 0 | 15 | 30 | 25 |
In Phase 2, additional mixtures were prepared using another all-in-aggregate (AIA2) with a particle size distribution very similar to that of AIA1 (Figure 3), but with better resistance to fragmentation. The study was further complemented by incorporating one-third by volume of coarse TDA into these mixtures, corresponding to 10.6%–11.4% of the aggregate weight, depending on the mixture. This ratio is higher than that investigated by Arulrajah et al. (2019) with recycled aggregates, yet it falls within the range commonly used in soil mixtures.
The composition of the mixtures tested in the subsequent study (Phase 2) is defined in Table 3.
Composition of the mixtures in the subsequent study (Phase 2)
| Mixture number | Mixture composition | CDW: % | All-in-aggregate 2: % | TDA* |
|---|---|---|---|---|
| Mixture 4 | 50CDW + 50AIA2 | 50 | 50 | — |
| Mixture 5 | 30CDW + 70AIA2 | 30 | 70 | — |
| Mixture 6 | AIA2+TDA | 0 | 100 | 1/3 |
| Mixture 7 | 50CDW + 50AIA2+TDA | 50 | 50 | 1/3 |
| Mixture 8 | 30CDW + 70AIA2+TDA | 30 | 70 | 1/3 |
*Proportion by volume of aggregates
Particle size distribution of these mixtures will be presented and discussed in Section 3.
After weighing each material in the required proportion, the materials were mixed thoroughly. From these mixtures, the samples were taken in accordance with the standardised procedures for carrying out the particle size distribution (CEN, 2012) and the determination of resistance to fragmentation using the LA testing machine (CEN, 2020).
2.3 Test procedures
The particles size distribution for all the aggregates and their mixtures was carried out following the European standard EN 933-1 (2012). The LA test method is also a common test used to determine aggregate’s resistance to fragmentation. It is based on a sample of aggregate rolled with steel balls in a rotation drum that promotes the degradation of the material. After rolling is complete, the quantity of material retained on the 1.6 mm sieve is determined to evaluate the LA abrasion coefficient following the equation:
where M is the mass of the aggregate sample placed inside the drum (typically 5000 kg) and m is the mass of material retained on the 1.6 mm sieve.
This test is usually carried out on aggregate passing the 14 mm test sieve and retained on the 10 mm test sieve – reference test, with specific requirements on grading described in the standard (CEN, 2020). It should be pointed out that the test standard requires the preparation of a modified sample, that is, complying with specific particle size requirements. The grading of the test portion shall comply with at least one of the following requirements (CEN, 2020): between 60% and 70% passing a 12.5 mm test sieve; or, between 30% and 40% passing a 11.2 mm test sieve. In the present study, the test samples were prepared in compliance with the first condition, that is the test samples have between 60% and 70% of their mass passing the 12.5 mm sieve.
For coarse recycled aggregates, the standard (CEN, 2020) suggests that the aggregate size 16/31.5 mm may be suitable, as variation to the reference test. Therefore, for coarse recycled aggregates, the test shall be carried out on a modified test sample composed solely of particle sizes 16/31.5 mm, with the additional requirement that the proportion passing the 21.4 mm sieve must be between 45% and 55%. As the LA abrasion test is conducted on modified samples, in the present laboratory study in addition to evaluate the fragmentation resistance of the aggregates and their mixtures following the standard (CEN, 2020), the variation of the LA abrasion coefficient across different aggregate size fractions was also investigated, an aspect that is rarely addressed in the literature. For each mixture, the LA abrasion test was carried out on all the material retained on the 4 mm sieve (typically considered the coarse fraction of the aggregate), on aggregate sizes 10/14 mm (reference test) and on aggregate sizes 16/31.5 mm (variation to the reference test for recycled aggregates).
The first step to prepare the test sample was sieving the mixtures through the pre-defined sieves previously mentioned. Then each test fraction was washed, dried, cooled to ambient temperature and mixed again to obtain the modified laboratory sample.
For each test, a modified laboratory sample with mass around 6000 g was prepared and then reduced to have a mass of 5000 ± 5 g. The fraction 16/31.5 mm of Mixture 3 (Table 2) was not tested, as it would have required the preparation and sieving of more than 200 kg of material to obtain 6000 g of modified laboratory sample.
The ball charge placed inside the drum with the aggregate depends on the nominal maximum size of tested fraction. For the aggregate size 10/14 mm, 12 spherical steel balls with total mass between 5120 and 5300 g were used, while for the fraction 16/31.5 mm and for the samples with material retained on the 4 mm sieve (>4 mm), 14 spherical steel balls with total mass between 5810 and 6010 g were introduced into the drum. In the mixtures containing TDA, the maximum aggregates size has not changed, and consequently the abrasive loads were identical to those of the mixtures without TDA.
At the end of the test, the material retained on the 1.6 mm sieve was washed to eliminate the fine particles and dried until a constant mass was achieved. The LA abrasion coefficient was then calculated in accordance with Equation 1. The constituents of the recycled aggregate were determined following the European Standard CEN (2009) by hand sorting the particles of different constituents (concrete and mortars; unbound and hydraulically bound aggregates; clay and calcium silicate masonry units; bituminous materials; glass; soils and other materials).
When alternative materials such as recycled and rubber aggregate are used in contact with the ground or exposed to the weather, rainwater infiltration may lead to the leaching of potentially hazardous elements, which could pose a risk to the environment. Thus laboratory leaching tests, at liquid-to-solid ratio of 10 l/kg (one stage batch tests with size reduction), following the procedure described in the standard EN 12457-4 (CEN, 2002), were carried out on the recycled aggregate and TDA.
3. Results and discussion
3.1 Characterisation of the recycled C&D material
The particle size distribution of the recycled aggregate presented in Figure 3 confirms that most of its particles range between 10 and 30 mm. Only about 20% of the particles are smaller than 10 mm, while the proportion of fines (<0.063 mm) is ≈6%.
Figure 4 shows the constituents of the recycled C&D material. It is a mixed recycled aggregate composed mostly of unbound aggregates, concrete and mortars, and clay masonries. The percentage of soil mainly corresponds to fine particles that cannot be distinguished through manual sorting and are therefore classified under this category.
 The pie chart presents the composition of construction and demolition waste materials. Unbound aggregates account for 36 percent. Concrete and mortars represent 32 percent. Clay masonries contribute 21 percent. Soils account for 9.5 percent. Bituminous materials represent 0.7 percent. Glass accounts for 0.2 percent. Other materials contribute 0.6 percent. Unbound aggregates and concrete related materials form the largest portions of the total composition.
Constituents of the recycled C&D aggregate
The pie chart presents the composition of construction and demolition waste materials. Unbound aggregates account for 36 percent. Concrete and mortars represent 32 percent. Clay masonries contribute 21 percent. Soils account for 9.5 percent. Bituminous materials represent 0.7 percent. Glass accounts for 0.2 percent. Other materials contribute 0.6 percent. Unbound aggregates and concrete related materials form the largest portions of the total composition.Constituents of the recycled C&D aggregate
Due to its high clay masonries content, exceeding the 10% threshold stipulated by the Portuguese Road Infrastructures Management Entity (IP, 2014), this recycled aggregate alone cannot be considered suitable for use in road pavement layers.
As mentioned in subsection 2.3, one of the points to be investigated in this study is the variation of the LA abrasion coefficient across different aggregate size fractions. Figure 5 presents the LA coefficients achieved when the LA test was carried out on all the material retained on the 4 mm sieve, on aggregate sizes 10/14 mm, and on aggregate sizes 16/31.5 mm.
 The bar chart presents L A coefficient percentage on the vertical axis and particle fraction on the horizontal axis. Three fractions are shown, greater than 4 millimeter, 10 14 millimeter, and 16 31.5 millimeter. The values are approximately 54 percent for greater than 4 millimeter, 51 percent for 10 14 millimeter, and 52 percent for 16 31.5 millimeter.
Resistance to fragmentation of the recycled aggregate: Los Angeles abrasion coefficient for different particles fractions
The bar chart presents L A coefficient percentage on the vertical axis and particle fraction on the horizontal axis. Three fractions are shown, greater than 4 millimeter, 10 14 millimeter, and 16 31.5 millimeter. The values are approximately 54 percent for greater than 4 millimeter, 51 percent for 10 14 millimeter, and 52 percent for 16 31.5 millimeter.Resistance to fragmentation of the recycled aggregate: Los Angeles abrasion coefficient for different particles fractions
The recycled aggregate exhibits a markedly high LA coefficient, considering the thresholds of LA ≤40% and LA ≤45% for base and sub-base layers, respectively, hence the need to enhance its performance. As shown in Figure 5, the LA coefficient of this aggregate varies only slightly between the particles fraction (LA = 54% for >4 mm, LA = 51% for 10/14 mm, and LA = 52% for 16/31.5 mm), which indicates that testing fractions other than the reference fraction (10/14 mm) does not yield substantial differences. This result indicates a certain uniformity in the fragmentation resistance of the particles comprising this aggregate, irrespective of their size.
3.2 Results from the preliminary study
3.2.1 Particle size distribution
The upper and lower limits of grading for base and sub-base layers of roadways stipulated by the Portuguese Road Infrastructures Management Entity (IP, 2014) and the particle size distribution of the three mixtures described in Table 2 are plotted in Figure 6. The figure shows that only Mixture 2 (30CDW + 70AIA1) falls entirely within the range defined by the lower and upper limits. The other two mixtures are slightly out of range, but without much significance.
 The graph shows percentage passing on the vertical axis from 0 to 100 percent and particle size in millimeter on the horizontal axis ranging from 0.063 to 63 millimeter. Curves are presented for Mixture 1, Mixture 2, Mixture 3, along with upper and lower specification limits. All three mixtures increase gradually with particle size. Mixture 2 and Mixture 3 generally lie closer to the upper limit in the mid size range, while Mixture 1 remains slightly lower before converging toward higher sizes. All mixtures approach 100 percent passing at larger particle sizes and remain within the specified limits.
Particle size distribution of the mixtures (Phase 1) and the lower and upper reference limits
The graph shows percentage passing on the vertical axis from 0 to 100 percent and particle size in millimeter on the horizontal axis ranging from 0.063 to 63 millimeter. Curves are presented for Mixture 1, Mixture 2, Mixture 3, along with upper and lower specification limits. All three mixtures increase gradually with particle size. Mixture 2 and Mixture 3 generally lie closer to the upper limit in the mid size range, while Mixture 1 remains slightly lower before converging toward higher sizes. All mixtures approach 100 percent passing at larger particle sizes and remain within the specified limits.Particle size distribution of the mixtures (Phase 1) and the lower and upper reference limits
3.2.2 Resistance to fragmentation
Figure 7 compares the LA coefficient of the recycled aggregate, the all-in-aggregate and the mixtures studied in Phase 1. As shown in Figure 7, for the aggregates and mixtures testing a larger fraction of material (all the particles with size >4 mm) leads to higher values of LA coefficient, that is, depending on the material testing the reference fraction (recommended by the test standard) may not be representative of the aggregate’s real resistance to fragmentation. However, for the AIA1 and for Mixtures 1 and 2, the LA coefficient achieved for particles fraction 10/14 mm (reference fraction) represents well the average value of the coefficient obtained for the three fractions tested.
 The grouped bar chart presents L A coefficient percentage for greater than 4 millimeter, 10 14 millimeter, and 16 31.5 millimeter fractions across five materials. C D W 10 30 shows values around 54, 51, and 52 percent. A I A 1 shows lower values around 46, 40, and 35 percent. Mixture 1 shows approximately 53, 49, and 45 percent. Mixture 2 shows approximately 49, 46, and 42 percent. Mixture 3 shows about 43 percent for greater than 4 millimeter and 34 percent for 10 14 millimeter, with no value shown for 16 31.5 millimeter.
Los Angeles abrasion coefficient for different fractions of the aggregates and mixtures
The grouped bar chart presents L A coefficient percentage for greater than 4 millimeter, 10 14 millimeter, and 16 31.5 millimeter fractions across five materials. C D W 10 30 shows values around 54, 51, and 52 percent. A I A 1 shows lower values around 46, 40, and 35 percent. Mixture 1 shows approximately 53, 49, and 45 percent. Mixture 2 shows approximately 49, 46, and 42 percent. Mixture 3 shows about 43 percent for greater than 4 millimeter and 34 percent for 10 14 millimeter, with no value shown for 16 31.5 millimeter.Los Angeles abrasion coefficient for different fractions of the aggregates and mixtures
Analysing now the variation of the resistance to fragmentation achieved with the mixtures, defined as the ratio between the reduction in LA coefficient achieved with the mixture and the LA coefficient of the CDW for the corresponding fraction, it can be concluded that the improvement achieved with Mixture 1 (50CDW + 50AIA1) was very low, despite having higher significance in the fraction 16/31.5 mm. With this mixture, a decrease in the LA coefficient of 1.8%, 3.9%, and 13.5% was achieved for fractions >4, 10/14, and 16/31.5 mm, respectively (Table 4).
Percentage decrease of the LA coefficient of the mixtures (Phase 1) with respect to the LA coefficient of CDW
| Mixture number | Mixture composition | Retained in 4 mm sieve | Fraction 10/14 mm | Fraction 16/31.5 mm |
|---|---|---|---|---|
| Mixture 1 | 50CDW + 50AIA1 | 1.8 | 3.9 | 13.5 |
| Mixture 2 | 30CDW + 70AIA1 | 9.3 | 9.8 | 19.2 |
| Mixture 3 | 30CDW + 15CA1+30CA2+25FA | 20.4 | 33.3 | — |
It is important to point out that, due to the specific requirements on grading of the modified test sample described in subsection 2.3, the percentages of the mixtures presented in Tables 2 and 3 refer to the composition before the preparation of the test samples, that is, in the tested fractions the percentage of the original aggregates is different.
As shown in Figure 3, the recycled aggregate (CDW10/30) and the AIA1 have similar grading between 16 and 31.5 mm, so it is reasonable to assume that in the fraction 16/31.5 mm, Mixture 1 has similar proportions of the both materials (50CDW + 50AIA1). As the AIA1 has a lower LA coefficient in this fraction (LA = 35%), the performance improvement for these particle sizes is more relevant (LA = 52% for CDW decreased to 45% in Mixture 1).
The all-in-aggregate has only 8.3% of particles between 10 and 14 mm, while the recycled aggregate has 26.5% of its particles in this range (Figure 3). Thus, the fraction 10/14 mm of Mixture 1 contains more particles coming from the CDW than AIA1 particles. It is therefore understandable that, in Mixture 1, the decrease in the LA coefficient in this fraction compared to the LA coefficient of the recycled aggregate was very low – only 0.9% (Table 4).
The decrease in the LA coefficient when all the particles larger than 4 mm were tested in the LA apparatus, without other changes in the mixture grading, was only 1.8% for Mixture 1 (Table 4). It should be noted, however, that the LA coefficient of the AIA1 for particles larger than 4 mm is also very high (LA = 46%, Figure 6).
In Mixture 2, the percentage of all-in-aggregate was increased to 70%, but the improvement in the LA coefficient was not substantial (Figure 6 and Table 4). In fraction 16/31.5 mm there was a decrease in the LA coefficient of 19.2% (LA = 52% for CDW decreased to 42% in Mixture 2), while in the other two fractions the variation was only around 9% (Table 4). The LA coefficient for the above-mentioned fraction would allow to apply Mixture 2 in sub-base layers of low traffic roads (provided other conditions were also fulfilled).
Mixture 3 was produced with one fine aggregate and two coarse aggregates with good resistance to fragmentation (LA coefficient around 30%). It is important to point out that the fine aggregate (0/4 mm) does not have any impact on the resistance to fragmentation using the LA testing machine, as the finest aggregate particles are not tested.
A more pronounced decrease in the LA coefficient was observed with the use of these two good quality coarse aggregates, especially for the reference fraction (Figure 6 and Table 4). It should be noted, however, that only 30% of recycled aggregate is incorporated into this mixture and the use of three different natural aggregates could hinder its application on site.
3.3 Results from Phase 2
3.3.1 Environmental characterisation of the TDA
Table 5 presents the results of the laboratory leaching tests performed on the recycled aggregate and on the TDA, as well as the regulatory limits for leachate concentrations applicable to inert landfill, stipulated by the European Council Decision, 2003/33/EC (2003).
Results of laboratory leaching test and limits of acceptance criteria for inert landfills
| Parameter | Recycled aggregate – CDW10/30 (mg/kg dry matter) | Tyre-derived aggregate – TDA (mg/kg dry matter) | Acceptance criteria – inert landfill (Council Decision, 2003) |
|---|---|---|---|
| Arsenic, As | < 0.05* | 0.01 | 0.5 |
| Lead, Pb | < 0.3* | < 0.3* | 0.5 |
| Cadmium, Cd | <0.003 | < 0.025* | 0.04 |
| Chromium, Cr | 0.45 | < 0.25* | 0.5 |
| Copper, Cu | < 0.25* | < 0.25* | 2 |
| Nickel, Ni | < 0.3* | < 0.3* | 0.4 |
| Mercury, Hg | < 0.01* | < 0.01* | 0.01 |
| Zinc, Zn | < 0.1* | 4.9 | 4 |
| Barium, Ba | < 2.5* | < 2.5* | 20 |
| Molybdenum, Mo | < 0.25* | < 0.25* | 0.5 |
| Antimony, Sb | < 0.01* | < 0.01* | 0.06 |
| Selenium, Se | <0.01* | < 0.01* | 0.1 |
| Chloride, Cl | 51 | < 1* | 800 |
| Fluoride, F | 2.3 | < 1* | 10 |
| Sulfate, SO4 | 670 | < 1* | 1000 |
| Phenol index | <0.05 | 0.32 | 1 |
| Dissolved organic carbon, DOC | 29 | 120 | 500 |
| Total dissolved solids, TDS | 2090 | 480 | 4000 |
| pH | 10.2 | 7.7 | — |
*Limit of quantification (LoQ)
As evidenced in Table 5, the leachate from the recycled aggregate complies with the limits defined by European legislation for inert waste, indicating no considerable environmental risk. Regarding the TDA, all regulatory limits are met except for the concentration of zinc, which reaches 4.9 mg/kg.
Zinc oxide is commonly used as an activator in the rubber vulcanisation process, which is essential for tyre manufacturing. Therefore, the presence of zinc in the TDA leachate, while representing an environmental concern, was not unexpected. High concentrations of zinc in leachate of TDA and crumb rubber have also been reported by other authors (Duin, 2020; Ibrahim et al., 2021; Rhodes et al., 2012). Rhodes et al. (2012) evaluated zinc leaching from crumb rubber using different laboratory methods and found that zinc concentrations increased with smaller particle sizes and longer exposure times.
3.3.2 Resistance to fragmentation
As previously mentioned, in Phase 2, an all-in-aggregate with a particle size distribution very similar to that used in the preliminary study was selected, but with better mechanical performance. Figure 8 presents a comparison of the LA coefficient for the three fractions of the recycled aggregate (CDW10/30), the AIA2 and the various mixtures studied in Phase 2. As concluded in the preliminary study, testing a larger aggregate fraction (particles >4 mm) leads to higher LA coefficients, that is, lower resistance to fragmentation. However, when the coarsest fraction is tested (particles in the range 16–31.5 mm), the LA coefficient is lower than the value obtained with the reference fraction (10/14 mm).
 The grouped bar chart presents L A coefficient percentage for greater than 4 millimeter, 10 14 millimeter, and 16 31.5 millimeter fractions. C D W 10 30 shows values of 54, 51, and 52 percent. A I A 2 shows 42, 34, and 30 percent. Mixture 4 shows 47, 43, and 40 percent. Mixture 5 shows 45, 39, and 36 percent. Mixture 6 shows 30, 22, and 15 percent. Mixture 7 shows 35, 32, and 23 percent. Mixture 8 shows 33, 30, and 21 percent.
Los Angeles abrasion coefficient for different fractions of aggregates and mixtures (Phase 2)
The grouped bar chart presents L A coefficient percentage for greater than 4 millimeter, 10 14 millimeter, and 16 31.5 millimeter fractions. C D W 10 30 shows values of 54, 51, and 52 percent. A I A 2 shows 42, 34, and 30 percent. Mixture 4 shows 47, 43, and 40 percent. Mixture 5 shows 45, 39, and 36 percent. Mixture 6 shows 30, 22, and 15 percent. Mixture 7 shows 35, 32, and 23 percent. Mixture 8 shows 33, 30, and 21 percent.Los Angeles abrasion coefficient for different fractions of aggregates and mixtures (Phase 2)
Using the AIA2, the mixture containing 50% CDW (Mixture 4) can be classified under the LA45 category (LA <45%) for the reference fraction, while Mixture 5 (30%CDW + 70%AIA2) falls within the LA40 category. Based on this classification, Mixture 4 has potential for application in pavement sub-base layers, whereas Mixture 5 may be suitable for both base and sub-base layers. The reduction in the LA coefficient of these mixtures relative to that of the CDW for the three fractions under analyses is presented in Table 6.
Percentage decrease of the LA coefficient for Phase 2 mixtures compared to the LA coefficient of CDW
| Retained in 4 mm sieve | Fraction 10/14 mm | Fraction 16/31.5 mm | ||
|---|---|---|---|---|
| Mixture 4 | 50CDW + 50AIA2 | 13.0 | 15.7 | 23.1 |
| Mixture 5 | 30CDW + 70AIA2 | 16.7 | 23.5 | 30.8 |
| Mixture 7 | 50CDW + 50AIA2+TDA | 35.2 | 37.3 | 55.8 |
| Mixture 8 | 30CDW + 70AIA2+TDA | 38.9 | 41.2 | 59.6 |
Mixture 6 was designed as a test mixture to evaluate the effect of incorporating TDA on the aggregates’ resistance to fragmentation. As shown in Table 3, this mixture is composed only by the aggregate AIA2, to which one-third of its volume of TDA was added. Figure 8 shows that adding the rubber aggregate to the AIA2 resulted in a substantial reduction in the LA coefficient. The greatest decrease was observed in the 16/31.5 mm fraction, where the LA coefficient dropped from 30% to 15%. When the whole coarse aggregate fraction (>4 mm) was tested, the LA coefficient decreased from 42% to 30%. It is important to note that the grain size distribution of the TDA (shown in Figure 4) remained unchanged in all the LA tests, that is the sizes mentioned in the fractions (Figure 8 and Table 6) refer only to the aggregates.
Comparing the fragmentation resistance of Mixtures 4 and 7 shows that the inclusion of TDA markedly reduces the LA coefficient. Reductions of ≈25% were observed for the >4 and 10/14 mm fractions, and over 42% for the coarsest fraction. A similar trend can be observed when comparing Mixtures 5 and 8. The addition of the rubber aggregate led to a decrease in the LA coefficient of 27%, 24%, and 42% in the fractions >4, 10/14, and 16/31.5 mm, respectively, which confirms the beneficial effect of the rubber aggregate on fragmentation resistance.
Table 6 presents the percentage reduction in the LA coefficient for the mixtures studied in Phase 2, relative to the corresponding value for CDW10/30. It can be observed that the improvement achieved through the addition of TDA is approximately double in most cases. The enhancement in the coarsest fraction is notably pronounced, exceeding 55%, while the improvements observed in the other two fractions are of a similar order of magnitude (35%–40%).
The volume of rubber added to each of the three fractions is approximately the same. However, since the total weight of the aggregate sample remains roughly constant, the number of aggregate particles decreases as the particle size increases. As a result, the ratio between the number of rubber particles and the number of aggregate particles (AIA2+ CDW) increases in the coarser fractions. This leads to a greater interaction between rubber and aggregate particles, providing enhanced protection and, consequently, a more pronounced beneficial effect from the addition of rubber.
Figure 9 illustrates the appearance of the three samples of Mixture 8 (30CDW + 70AIA2+TDA) after the LA abrasion test (particles retained on the 1.6 mm sieve after washing). The higher ratio between rubber and aggregate particles in the coarsest fraction is illustrated in Figure 9.
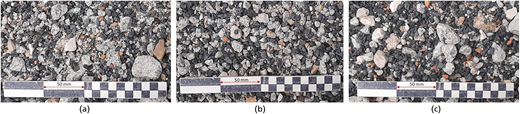
Visual appearance of Mixture 8 after Los Angeles abrasion test (particles retained on the 1.6 mm sieve after washing): (a) retained in 4 mm sieve; (b) fraction 10/14 mm; (c) fraction 16/31.5 mm
Visual appearance of Mixture 8 after Los Angeles abrasion test (particles retained on the 1.6 mm sieve after washing): (a) retained in 4 mm sieve; (b) fraction 10/14 mm; (c) fraction 16/31.5 mm
4. Conclusions and future developments
This paper presents the results of a two-stage study designed to enhance the geometric properties (particle size distribution) and resistance to fragmentation of a mixed (non-selected) recycled aggregate produced by a recycling plant with a narrow particle size fraction (10/30 mm). Based on the study carried out, the following main conclusions can be drawn:
The LA abrasion test is usually carried out on a specific aggregate size of the aggregate, with grading requirements that produce a modified test sample that may not be representative of the material’s behaviour in the field.
For all the aggregates and mixtures tested, the LA coefficient obtained when the test was carried out with all the coarse material (grain size >4 mm) was higher than the value obtained for the reference fraction.
The mixture 50%CDW + 50%AIA2 can be classified under the LA45 category making it suitable for pavement sub-base layers, while the 30%CDW + 70%AIA2 falls within the LA40 category, indicating its potential for use in both base and sub-base layers.
The geoenvironmental characterisation of the TDA, carried out through laboratory leaching tests, revealed that the resulting leachate contains a zinc concentration exceeding the regulatory limit, which may raise environmental concerns regarding its use.
Blending the natural and the recycled aggregates with TDA resulted in substantial reductions in the LA coefficient, confirming the beneficial effect of the rubber aggregate in enhancing fragmentation resistance.
The use of TDA yields a considerable improvement in fragmentation resistance in the coarsest fraction of the aggregate (fraction with larger particle sizes).
This study is part of a broader research effort focused on improving the performance of mixed recycled aggregates. Future work will address other physical and mechanical properties of the mixtures, such as California Bearing Ratio, compaction behaviour, wear resistance using the Micro-Deval test, unconfined compressive strength, and resilient modulus, as well as other wastes and by-products. Potential strategies to mitigate the environmental risks associated with the use of TDAs will also be explored.
Acknowledgements
This work is a result of project “TechRoad”, with nr. 14471 and operation code at the Funds Platform (Balcão dos Fundos) COMPETE2030-FEDER-00589300, co-financed by COMPETE 2030, by Portugal 2030 and by the European Union. This work was also financially supported by Funding – UID/04708 of the CONSTRUCT – Instituto de I&D em Estruturas e Construções – funded by Fundação para a Ciência e a Tecnologia, I.P./MCTES through the national funds.

