
1-20 of 8306
Follow your search
Access your saved searches in your account
Would you like to receive an alert when new items match your search?
Journal

Geotechnical papers on the reinforcement and optimisation of ground for engineering.
in Time-dependent biodegradation of jute drains and its sustainable role in radial consolidation
> Proceedings of the Institution of Civil Engineers - Ground Improvement
Published: 10 August 2026
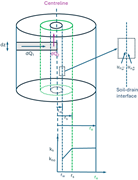
Figure 1. Unit cell with the variation of horizontal permeability and the soil–drain interface A schematic illustrates radial and vertical flow into a drain within a cylindrical soil domain, with drainage radii and hydraulic conductivity. The cylindrical soil domain contains a vertical drain a... More about this image found in Unit cell with the variation of horizontal permeability and the soil–drain ...
in Time-dependent biodegradation of jute drains and its sustainable role in radial consolidation
> Proceedings of the Institution of Civil Engineers - Ground Improvement
Published: 10 August 2026
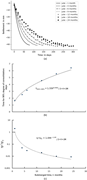
Figure 2. (a) Time settlement curves of jute drains (note: the times indicated in the legend of the figure refer to the submergence duration of the drain prior to commencement of consolidation testing, expressed in months. In contrast, the X-axis represents the consolidation time in days following loading); (b) time taken for achieving 90% consolidation (in days) plotted against the submerged duration; and (c) normalised drain permittivity with the submerged time Three graphs show settlement, consolidation time, and a reduction factor for jute over submerged time. The graph in panel a plots settlement in millimeters against time in days for jute after 1, 4, 6, 9, 12, 18, and 24 months of submergence. All curves and data series decrease rapidly at first and then gradually approach about negative 60 millimeters. The 1 month curve reaches about negative 61 millimeters by about 80 days. The 4 month curve reaches about negative 61 millimeters by about 120 days. The 6 month curve reaches about negative 61 millimeters by about 150 days. The 9 month curve reaches about negative 61 millimeters by about 180 days. The 12 month, 18 month, and 24 month data continue to about 240, 260, and 300 days, respectively, with final settlements close to negative 62 millimeters. Panel b plots time for 90 per cent degree of consolidation against submerged time. The data increase from about 1.6 days at 1 month to about 6.4 days at 24 months. The fitted relation states t D O C, 90 per cent, 1.53 t raised to 0.4361, for 1 less than t less than 24. Panel c plots psi over psi 0 against submerged time in months. The values decrease from about 2 at 1 month to about 0.009 at 24 months. The fitted relation states psi over psi 0, 1.04 t raised to negative 1.64, for 1 less than t less than 24. More about this image found in (a) Time settlement curves of jute drains (note: the times indicated in the...
in Time-dependent biodegradation of jute drains and its sustainable role in radial consolidation
> Proceedings of the Institution of Civil Engineers - Ground Improvement
Published: 10 August 2026
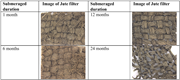
Figure 3. Magnified images capturing the extent of degradation in the drain filter from 1 to 24 months A table compares jute filter surfaces after submerged durations of 1, 6, 12, and 24 months. The table contains repeated columns for submerged duration and jute filter view. At 1 month, the wo... More about this image found in Magnified images capturing the extent of degradation in the drain filter fr...
in Time-dependent biodegradation of jute drains and its sustainable role in radial consolidation
> Proceedings of the Institution of Civil Engineers - Ground Improvement
Published: 10 August 2026
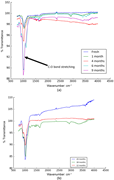
Figure 4. FTIR spectrograms for: (a) 0–9 months and (b) 12–24 months Two line graphs compare transmittance spectra of fresh and submerged jute filters across durations from 1 to 24 months. The graph in panel a plots transmittance from 88 to 102 per cent against wavenumber from 500 to 4500 in... More about this image found in FTIR spectrograms for: (a) 0–9 months and (b) 12–24 months Two line gra...
in Time-dependent biodegradation of jute drains and its sustainable role in radial consolidation
> Proceedings of the Institution of Civil Engineers - Ground Improvement
Published: 10 August 2026
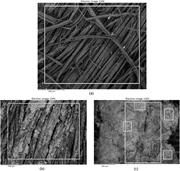
Figure 5. SEM images: (a) fresh jute drain; (b) clogged sections of drain after 4 months; and (c) clogged sections of drain after 24 months (20 times magnified – 1 cm = 500 µm) Three electron micrographs compare jute fibre surfaces after increasing submerged durations. The electron micrograp... More about this image found in SEM images: (a) fresh jute drain; (b) clogged sections of drain after 4 mo...
in Time-dependent biodegradation of jute drains and its sustainable role in radial consolidation
> Proceedings of the Institution of Civil Engineers - Ground Improvement
Published: 10 August 2026
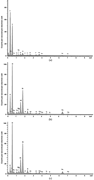
Figure 6. Magnetograms of: (a) the fresh jute drain, with the high amount of carbon and oxygen due to the presence of jute; (b) the 4-month clogged drain; and (c) the 24-month clogged drain with a higher amount of silica, aluminium, and oxygen as compared to the fresh drain Three spectra compar... More about this image found in Magnetograms of: (a) the fresh jute drain, with the high amount of carbon a...
in Time-dependent biodegradation of jute drains and its sustainable role in radial consolidation
> Proceedings of the Institution of Civil Engineers - Ground Improvement
Published: 10 August 2026
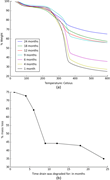
Figure 7. (a) Thermogravimetric curves of drain samples degraded from 1–24 months and (b) percentage of mass loss against the time of degradation for the jute drain Two graphs compare jute filter weight with temperature and mass loss with degradation time from 1 to 24 months. The graph in pane... More about this image found in (a) Thermogravimetric curves of drain samples degraded from 1–24 months and...
Journal Articles
Proceedings of the Institution of Civil Engineers - Ground Improvement 1–13.
Published: 10 August 2026
Journal Articles
Proceedings of the Institution of Civil Engineers - Ground Improvement 1–11.
Published: 10 August 2026
in Research on the technology and bearing characteristics of drained cement-soil mixing piles
> Proceedings of the Institution of Civil Engineers - Ground Improvement
Published: 10 August 2026
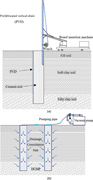
Figure 1. Technical diagram of cement-soil mixing piles for composite drainage Two diagrams show installation and drainage action of prefabricated vertical drains in layered soil using a machine and vacuum pumping system. Panel a shows a board insertion machine placing a prefabricated vertical... More about this image found in Technical diagram of cement-soil mixing piles for composite drainage Two...
in Research on the technology and bearing characteristics of drained cement-soil mixing piles
> Proceedings of the Institution of Civil Engineers - Ground Improvement
Published: 10 August 2026
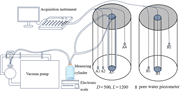
Figure 2. Schematic diagram of the model test A schematic shows vacuum consolidation setup with acquisition instrument, vacuum pump, measuring cylinder, and two soil columns with piezometers. The schematic shows an acquisition instrument connected by tubes to two cylindrical soil columns. A va... More about this image found in Schematic diagram of the model test A schematic shows vacuum consolidati...
in Research on the technology and bearing characteristics of drained cement-soil mixing piles
> Proceedings of the Institution of Civil Engineers - Ground Improvement
Published: 10 August 2026
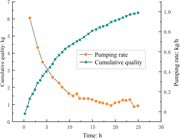
Figure 3. Varying of water pumping volume with time A graph shows pumping rate decreases while cumulative quality increases with time over 25 hours. The graph shows time in hours on the x-axis, cumulative quality in kilogram on the left y-axis, and pumping rate in kilogram per hour on the righ... More about this image found in Varying of water pumping volume with time A graph shows pumping rate dec...
in Research on the technology and bearing characteristics of drained cement-soil mixing piles
> Proceedings of the Institution of Civil Engineers - Ground Improvement
Published: 10 August 2026
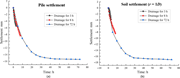
Figure 4. Settlement at different consolidation time Two graphs show pile settlement and soil settlement increasing with time for drainage durations of 3, 8, and 72 hours. The first graph shows pile settlement in millimetres versus time in hours. Settlement starts at 0 and decreases rapidly, r... More about this image found in Settlement at different consolidation time Two graphs show pile settleme...
in Research on the technology and bearing characteristics of drained cement-soil mixing piles
> Proceedings of the Institution of Civil Engineers - Ground Improvement
Published: 10 August 2026
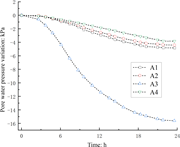
Figure 5. Variation of pore water pressure for 1 day vacuum consolidation A graph shows pore water pressure variation decreases with time for measurement points A 1, A 2, A 3, and A 4. The graph shows time in hours on the x-axis and pore water pressure variation in kilopascal on the y-axis. Al... More about this image found in Variation of pore water pressure for 1 day vacuum consolidation A graph ...
in Research on the technology and bearing characteristics of drained cement-soil mixing piles
> Proceedings of the Institution of Civil Engineers - Ground Improvement
Published: 10 August 2026
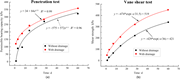
Figure 6. Cement soil test with or without drainage Two graphs show bearing capacity and shear strength increase with time, with higher values under drainage conditions. The first graph shows permissible bearing capacity in kilopascal versus time in days. Values increase with time, reaching ab... More about this image found in Cement soil test with or without drainage Two graphs show bearing capaci...
in Research on the technology and bearing characteristics of drained cement-soil mixing piles
> Proceedings of the Institution of Civil Engineers - Ground Improvement
Published: 10 August 2026
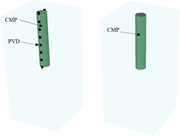
Figure 7. Physical models for FEA Two diagrams show a cylindrical C M P with P V D elements attached along its length and a single C M P without P V D. More about this image found in Physical models for FEA Two diagrams show a cylindrical C M P with P V...
in Research on the technology and bearing characteristics of drained cement-soil mixing piles
> Proceedings of the Institution of Civil Engineers - Ground Improvement
Published: 10 August 2026
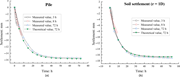
Figure 8. Soil settlement comparison under different drainage conditions Two graphs show pile settlement and soil settlement increasing with time for measured and theoretical values at 3 hours, 8 hours, and 72 hours. Panel a shows pile settlement in millimetres versus time in hours. Settlement... More about this image found in Soil settlement comparison under different drainage conditions Two graph...
in Research on the technology and bearing characteristics of drained cement-soil mixing piles
> Proceedings of the Institution of Civil Engineers - Ground Improvement
Published: 10 August 2026
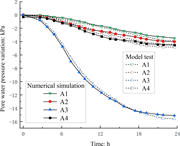
Figure 9. Comparison curves of pore water pressure A graph shows pore water pressure variation decreases with time for points A 1, A 2, A 3, and A 4 in model test and numerical simulation. The graph shows time in hours on the x-axis and pore water pressure variation in kilopascals on the y-axi... More about this image found in Comparison curves of pore water pressure A graph shows pore water pressu...
in Research on the technology and bearing characteristics of drained cement-soil mixing piles
> Proceedings of the Institution of Civil Engineers - Ground Improvement
Published: 10 August 2026
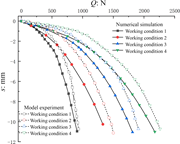
Figure 10. Load–displacement curves for different conditions A graph shows settlement decreasing from 0 to about negative 11 millimetres as load increases to 2500 newtons across four working conditions. The graph plots settlement in millimetres against load in newtons for four working conditio... More about this image found in Load–displacement curves for different conditions A graph shows settleme...

