The number of care‐dependent people will rise in future. Therefore, it is important to support home health care (HHC) providers with suitable methods and information, especially in times of disasters. The purpose of this paper is to reveal potential threats that influence HHC and propose an option to incorporate these threats into the planning and scheduling of HHC services.
This paper reveals the different conditions and potential threats for HHC in rural and urban areas. Additionally, the authors made a disaster vulnerability analysis, based on literature research and the experience of the Austrian Red Cross (ARC), one of the leading HHC providers in Austria. An optimization approach is applied for rural HHC that also improves the satisfaction levels of clients and nurses. A numerical study with real life data shows the impacts of different flood scenarios.
It can be concluded that HHC service providers will be faced with two challenges in the future: an increased organizational effort and the need for an anticipatory risk management. Hence, the development and use of powerful decision support systems are necessary.
For an application in urban regions new methods have to be developed due to the use of different modes of transport by the nurses. Additionally, an extension of the planning horizon and triage rules will be part of future research.
The presented information on developments and potential threats for HHC are very useful for service providers. The introduced software prototype has proven to be a good choice to optimize and secure HHC; it is going to be tested in the daily business of the ARC.
Even in the case of disasters, HHC services must be sustained to avoid health implications. This paper makes a contribution to securing HHC, also with respect to future demographic trends.
To the best of the authors’ knowledge there are no comprehensive studies that focus on disaster management in the field of HHC. Additionally, the combination with optimization techniques provides useful insights for decision makers in that area.
1. Introduction
Based on the current demographic and social developments in industrialized countries a significant increase in the demand for home health care (HHC) can be expected in the future. At the same time, however, the potential for family care reduces due to prolonged employment and changes in family structures. HHC services allow frail people to stay at home as long as possible and to receive professional help. Furthermore, HHC implies lower costs for the social insurance system if compared to intramural health care (e.g. nursing homes, hospitals) (see e.g. Kaye et al., 2009; Biringer et al., 2010).
This paper describes the situation of HHC in industrialized countries and explains the different requirements in organizing and planning of these services in rural and urban areas exemplarily for Austria. Based on literature reviews and the experience of the service providers, it is also shown how different disasters influence HHC. In most studies the effects of disasters are analyzed after their occurrences. Thus, they show the “lessons learned” from a concrete event. Preventive comprehensive studies on this subject hardly exist. In this context, in Trautsamwieser et al. (2011) a software prototype has been developed in cooperation with the Austrian Red Cross (ARC), one of the main HHC service providers in Austria. It serves as a decision support system (DSS) and is able to optimize the daily scheduling of HHC services, as well as to depict the effects of disasters. Therefore, the decision maker(s) can anticipate possible adverse effects and take measures well in advance.
The main contribution of this paper is to reveal potential threats that influence HHC. Based on the work in Trautsamwieser et al. (2011), an option to incorporate these threats into the planning and scheduling of HHC services is proposed. The presented approach was applied to carry out some additional numerical studies with flood data and the results will be discussed with respect to practicability. Furthermore, this paper describes the importance of HHC for industrialized countries and outlines the differences between urban and rural HHC.
This paper is structured as follows. The HHC services and their relevance for today's society are described in Section 2. Additionally, we outline the differences between urban and rural HHC. Section 3 contains the risk assessment and shows the critical factors and vulnerability of HHC services. In Section 4, we apply a DSS from Trautsamwieser et al. (2011). We also present results of some numerical studies with real‐life data that show the applicability of the software prototype on different flood scenarios in Upper Austria. Section 5 concludes the paper and gives an outlook on future research on this topic.
2. The HHC system
HHC providers cover a wide range of services, reaching from qualified home nursing to assistance in leading the household and maintenance of social contacts. These tasks are performed by qualified health care and nursing staff, nursing assistants, geriatric nurses, and home helpers. The stated core services are supplemented by additional services, such as visiting services, meals on wheels, transport services, emergency call systems, or equipment rental and consulting.
The main advantages of HHC services are (see e.g. Schaffenberger and Pochobradsky, 2004):
Facilitation of care‐dependent people to stay at home as long as possible.
Prevention or delay of admission to hospitals or nursing homes.
Enabling earlier discharge from in‐patient care.
Support and relief for relatives or other informal caregivers.
Maintenance of social contacts and prevention of social isolation.
In Austria, according to Statistics Austria (2011), a total of 433,880 people, representing 5.2 percent of the whole population received care allowance in 2009. A current report (Biringer et al., 2010) states that 58 percent of them are informally cared for at home by their own families or friends. The remaining percentage counts to the formal sector of care. This includes traditional elderly or nursing homes as a form of institutional care and day‐care facilities (together 16 percent), as well as HHC services (24 percent). The remaining 2 percent are receiving fulltime care, 24 hours per day. Furthermore, there are alternative concepts in development that are situated between HHC and institutional care, such as the system of “assisted living” (Schneider et al., 2006). Currently, these services count either to institutional care or HHC. Since all the presented numbers include only those people who are reported to national subsidies, the actual number of care‐dependent people is estimated to be significantly higher.
Besides the social aspects, there are also monetary reasons to promote the expansion of HHC services. In Austria, health care is within responsibility of the federal states and therefore there is no homogeneous data available that is up to date. Thus, we present only data of the two regions we consider more detailed in the subsequent sections of this paper, namely Upper Austria (rural) and Vienna (urban). According to Biringer et al. (2010) in Upper Austria the total expenses for intramural care for the elderly (18,059 persons) reached about €123 million in 2009; while in the HHC sector only €50 million (27,923 persons) were recorded. Thus, intramural care of one person costs on average €6,816 while these costs amount only to €1,716 for HHC. In Vienna the situation is similar; intramural health care counts to €435 million (13,950 persons) and HHC to €138 million (26,880 persons). This leads to average costs per capita of €46,438 for intramural care and €5,126 for HHC. The high differences in costs per capita are due to different cost structures in the provinces. Furthermore, the average costs also depend on the quality and amount of services the clients have received. The costs of informal care, however, are not well known, there are only rough scientific estimates, which move in the range of €2 to €3 billion per year for whole Austria (Schneider et al., 2006).
Similar results have been reported by Kitchener et al. (2006) and Kaye et al. (2009), who compared the expenditures for institutional and non‐institutional long‐term care in the US Medicaid system. They found out that states, which are offering extensive HHC services, were able to reduce their spending significantly. On average, total expenditures per capita were $43,947 less per year.
2.1 Current and expected development of HHC
Although the organization of HHC systems differs from country to country, many industrialized countries have reported an increased demand for HHC services in recent years. A study of the OECD states, that per capita spending for long‐term care has increased in the past decade by an annual average of 6.5 percent across 24 OECD countries (Fujisawa and Colombo, 2009). In this time the usage of health services has also changed significantly. Elderly people want to remain in their familiar environment as long as possible. Thus, the traditional retirement homes for people without great care needs were less demanded. A look at the history of hours worked in HHC from 2000 to 2008 shows a change of +29.4 percent for Austria (Bednar et al., 2010) and thus supports this assumption for our test region. Given the current demographic and social developments, not only a significantly increased demand for HHC, but also a drastic reduction in informal care must be expected in future. Starting with around 15 percent in 2006, the share of the population aged 65 and above is estimated to reach 26 percent of the total OECD population until 2050. The group of aged 80 and above is expected to increase its share by 2.5 times between 2008 and 2050 (Fujisawa and Colombo, 2009). Together with increased life expectancy, decreasing birth rates lead to a shift in the age structure. Hence, those demographic groups with the highest probability of being in need of care will grow disproportionately. Additionally, changes in family structures, like the trends to more single households, childless families, and rising divorce rates will also reduce family care potential as well as prolonged employment (Schneider et al., 2006). Woodward et al. (2004) identified three trends for the rapid growth in HHC expenditures in Canada. First, Canadian hospitals faced financial constraints, which led to more aggressive discharge planning and shorter stays. More people recovering from surgery or acute illnesses entered the HHC system. Second, they mention demographic changes, which lead to more frail elderly people. Third, they state that a growing segment of the population has chronic illnesses and physical disabilities. These people also have a longer life expectancy and often want to stay at home as long as possible.
There exist several models to predict the further demand for long‐term care and its expenditures. However, all of them predict a remarkable increase, even under favorable assumptions. Oliveira Martins and de la Maisonneuve (2006) use both demographic and non‐demographic factors to determine future expenditures for 30 OECD countries. They point out that expenditures are highly related to the shares of formal and informal care. As labor force participation is expected to rise in future, informal care has to be supplemented with formal care. One major driver are labor costs of staff, which are given by 85 percent in the UK and between 70 and 90 percent in Germany. Based on the considered scenario, the average spending on long‐term care would rise from 1.1 percent of gross domestic product (GDP) in 2005 up to 1.9 to 3.9 percent of GDP by 2050. Hancock et al. (2007) combined a micro‐ and a macrosimulation model to predict future trends in the key drivers of demand for long‐term care in the UK. Starting with a central base case, they evaluate different funding regimes and care strategies (e.g. free personal care and different charging systems). Besides the demographic development, their model incorporates some key factors like household structures, home‐ownership rates, and marital status. Three factors seem the most important exogenous drivers of demand for and expenditure on long‐term care: life expectancy, disability, and unit costs. Results for the base case show an increase in demand of 156 percent for residential care, 135 percent for local authority HHC, 119 percent for private HHC, and 111 percent for informal care until 2051. In addition to this base case, also a low and a high expenditure scenario is presented, which differ in the assumptions for the exogenous factors. A recent study by the Austrian Institute of Economic Research (Mühlberger et al., 2008) includes similar factors as the study by Oliveira Martins and de la Maisonneuve (2006). Besides the demographic changes and the change in health condition, they also take the rising employment of women and increases in the cost of care into account. Currently, about 80 percent of informal care is still carried out by women. The authors predict the number of people receiving care allowance to be 536,041 in the lower‐bound and 623,083 in the average and upper‐bound scenario in 2030. The average scenario is subject to the same assumptions on the number of recipients as the upper‐bound scenario but differs on the assumptions for cost trend and demand for formal care. The forecast of health care expenditures shows a total increase of approximately 160 percent for the average scenario. According to this forecast the share of nursing expenses on real GDP will hence increase from 1.13 to 1.96 percent between 2006 and 2030 (Mühlberger et al., 2008).
In summary, it can be stated that within the next decades a massive increase in demand for care services has to be expected in industrialized countries. As HHC services are both more cost‐effective and usually preferred by care‐dependent people, this will lead to a further expansion of HHC services and their importance for the society.
2.2 Scheduling and routing of HHC services
The task of scheduling nurses is quite complex and there are numerous factors that must be considered to obtain a feasible solution. Especially HHC service providers that are still planning manually need a lot of time for this task and the outcome is presumably non‐optimal. This shows itself particularly in the case of vacation or illness of the experienced dispatchers. Another case in which planning time and quality of solutions play an important role is in times of disasters. In such cases it is necessary to adapt the routing accordingly as fast as possible and to use the limited resources as efficiently as possible.
Looking at the published literature in the field of HHC reveals that the requirements for planning and scheduling are rather similar in industrialized countries, and that they mainly differ in the prevailing regulatory restrictions. Cheng and Rich (1998) present a mathematical problem formulation for HHC scheduling in the USA. They consider different types of nurses (part‐ and full‐time) with varying qualification levels that have to serve clients within a given time window. Nurses are starting their duty at home. Their objective is to minimize the amount of overtime and part‐time worked. Eveborn et al. (2006) developed a DSS called Laps Care to aid the planners of HHC services in Sweden. Beside the medical skills, language knowledge, and the gender of the nurses, they also consider that clients have preferred nurses and that some visits require more than one nurse. Furthermore, nurses can use several modes of transport, namely walking, bicycles, and cars. Bredström and Rönnqvist (2008) also take temporal constraints that impose pairwise synchronization and pairwise temporal precedence between visits into account. Nickel et al. (2009) presents an optimization model for HHC in Germany. Within their model nurses are starting from a single depot and the objective function consists of four objectives (patient‐nurse loyalty, number of unscheduled tasks, overtime costs, and traveling distance) that are combined within a weighted objective function. Similar problem descriptions have also been published for example by Akjiratikarl et al. (2007) for the UK, Rasmussen et al. (2010) for Denmark, or Trautsamwieser et al. (2011) for Austria.
Summarizing, the task of scheduling nurses consists of assigning visits to nurses and to determine the optimal order in which they should be performed. Thereby, assignment constraints (e.g. qualification levels, language skills, and gender), temporal constraints (e.g. time windows and temporal dependencies), and working time regulations (e.g. maximum working time, shift work, and mandatory breaks) must not be violated. In addition, nurses could start their paid duty at different locations (depot, at home, or at the first client) and may use various modes of transport, even in combination. The objectives range from reducing traveling times (distances, or costs) to increasing the quality of service. One of the major challenges in HHC scheduling is that there are service peaks in the morning, at lunchtime, and in the evening. Therefore, nurses are often employed part‐time or work several shifts a day.
2.3 Differences between urban and rural HHC
The processes of scheduling and routing of HHC services show some differences between urban regions and rural regions. The social structures are usually less pronounced in urban areas. Additionally, the number of solitary or childless people is much higher. This leads to a reduced potential of informal care. A study of the American Medicare system (Kenny, 1993) shows that, due to social structures, the general demand for HHC is larger in urban regions. However, due to the better infrastructure, the demand for qualified services is far smaller than in rural areas. On the other hand, people living in rural regions receive not only more qualified services; they also have a higher visitation frequency. In Austria, Schaffenberger and Pochobradsky (2004) show that a notable difference can be observed in the demanded qualification between Vienna and the remaining provinces. According to them, in Vienna about 81 percent of the employed HHC staff were home helpers, 9 percent assistant nurses, and only 10 percent qualified nurses in 2002. In the other provinces the share of qualified nurses is between 22 and 36 percent.
There are also differences in organizational issues that occur mainly because of two reasons. First, the internal structures of the HHC service providers differ from region to region and second, HHC may be subject to various areas of responsibility. Both apply to Austria, but also to the American Medicare system.
For example, in Upper Austria care‐dependent people or their relatives are asking for services at their next ARC base or at other HHC organizations. The scope of services depends on the level of care dependency and is individually adapted to the client. Depending on the address of the client, he/she is forwarded to the team leader, who is responsible for this region. The team leader assigns the new visits to a nurse who is organizing his/her route by himself/herself, manually. In contrary, in Vienna the municipality‐funded HHC is organized through an organization called “Fonds Soziales Wien”. It collects all service demands and spreads them among all registered organizations that are offering HHC services. This is done according to frame contracts, which are negotiated at regular intervals. The organizations get a detailed offer for a service which has to be performed. This offer includes type and service time, and the number of visits. If known in advance, special requirements like language skills are also given. When the ARC accepts the offer it is given to the team leader of the corresponding district. He/she is then updating the scheduling and route planning. This is done within a scheduling program that is also used for accounting. The nurses are then able to view their schedule at any time with their personal digital assistants. With these mobile devices they are also logging their activities.
If one directly compares the specifications of the previously described rural HHC model with the requirements for an urban model, the most important differences show up at the transport infrastructure. In urban areas like Vienna, access to institutional care is easier because of a bigger density of facilities and a better transport infrastructure. There is also a denser network with different modes of transport. Due to the bigger traffic density, planning with cars will be though considerably more difficult (e.g. traffic jams and searching for parking lots). At the ARC in Vienna about 90 percent of the nurses use public transport to get to their clients whereas in the rural province of Upper Austria all nurses are using cars. Moreover, the distances between the single clients are usually smaller in cities so that nurses can also use bicycles or just walk. As a consequence for routing, one has to consider multiple modes of transport for the nurses on one tour as well as time‐dependent travel times. The latter not only addresses car traffic but also public transport. During rush hours for example, trains and buses have significantly shorter intervals than during the rest of the day. At the outskirts, those intervals are generally larger than at the city center. Time‐dependent travel times are needed on a detailed level without much aggregation to avoid larger waiting periods at the stations. However, to service clients, who are hard to reach with public transport the ARC in Vienna also has a couple of cars, which may only be used by qualified nurses.
3. Disaster vulnerability analysis
People with limited mobility or relying on medical supply (e.g. diabetics) do often need consistent health care. Thus, regular treatments are also necessary in case of disasters. HHC services must be prepared for such situations. Projections of the Intergovernmental Panel on Climate Change (IPCC) (2007) imply that there will be an increase in climate variability, changes in frequency, intensity, and duration of extreme events. Thus, one should be prepared for an increased number of natural disasters. The following assessment analyzes the potential threats and their impacts on HHC and is based on literature reviews, complemented by previous experience of the ARC. As many Red Cross organizations, the ARC is also one of the leading emergency organizations in case of disasters. We highlight different consequences on urban and rural regions, if they are significant. Due to the higher population density, potential impacts are much higher in urban regions than in rural regions.
To the best of our knowledge, there are limited studies that focus on risk assessment in the field of HHC, especially in a comprehensive manner. In general, the effects of individual major disasters are analyzed for all aspects of life, or for the entire health sector. One of the most extensive studies is that of Johnson and Galea (2009) which focusses on the effects of disasters on population health, health systems, and their infrastructure. Their study is based on nearly 200 articles and covers many different types of disasters such as earthquakes, storms, floods, mass fires, terrorism, infectious diseases, and technological disasters like the Enschede Fireworks Disaster of May 2000, and the Chernobyl Disaster of April 1986. A detailed risk assessment for natural disasters is also provided by Melching and Pilon (2006). Besides the general effects, they present background information regarding cause and incurrence of various disasters. A good manual to develop an all‐encompassing Hazards Emergency Preparedness Plan for HHC and hospice has been given by the US National Association for Home Care and Hospice (NAHC) (2008). It lists potential threats as well as the vulnerable infrastructure.
3.1 Vulnerable factors in HHC
According to the description of HHC in Section 2, one can identify the following important factors that are essential to maintain HHC:
Staff. The greatest asset of HHC service providers are their employees, both nurses and administrative staff. Absence of the regular dispatchers often leads to suboptimal schedules. Usually, deputies do not have enough experience for such complex scheduling tasks where extensive knowledge of clients, services, and nurses is required. On the other hand, if nurses are absent, other nurses with appropriate qualification have to fill in for them. If there are no more nurses available, the services must be limited or postponed. The reasons for unexpected absence of employees are diverse, ranging from sickness of individual employees up to a massive absence in the event of disasters. Additionally, motivation of the employees is an important topic.
Clients. Situations that lead to an increase in the number of clients or of the service time require a particularly efficient planning to service all clients. If this is no longer possible they must either be cared for by other organizations, leave their homes for temporary residential care, or stay with relatives or friends. The latter is very uncommon in urban areas because of weaker social networks.
Communication. An increasing number of organizations are relying on mobile communication technologies for controlling their HHC services. At the ARC in Vienna for example, the dispatchers are creating schedules within their operational software. Nurses are then able to view their plans through mobile devices. As a consequence they are rarely at the base. Since time and activity recording are also done electronically, information and communication technologies are essential for almost all organizational activities, but this leads to new vulnerabilities, especially in case of power outages.
Transport. Nurses rely on various modes of transport. Due to the lack of public transport, nurses in rural regions almost always use cars. Whereas in urban regions many, alternative and comprehensive modes are accessible, including public transport. Furthermore, average distances between clients are much lower in urban regions and thereby many routes are being covered by foot or by bike. Cars are mostly used in the suburbs, where the intervals and driving times of public transport are too large.
3.2 Effects of disasters on HHC
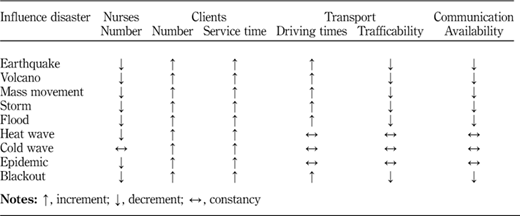
There are many possible disasters that are likely to influence the mentioned factors in subsection 3.1. Disasters can be classified in man‐made and natural disasters. The former are of human origin and range from technical and/or human error to intentional damage like terrorism. However, natural disasters are outside the direct human sphere of influence. Table I summarizes the effects of disasters in the fields of transport, nurses, clients, and communication and is the result of a literature review and the practical experience of decision makers at the ARC; it extends the findings presented in Trautsamwieser et al. (2011) significantly. The selection is based on the classification of the International Disaster Database (EM‐DAT, 2011), which lists the following groups of natural disasters: geophysical (earthquake, volcano, mass movement), meteorological (storm), hydrological (flood), climatological (extreme temperature), and biological (epidemic). Furthermore, it is complemented with blackouts as technological disaster.
Earthquakes lead to building damages and other infrastructure failure in wide areas and as they are usually not predictable they are latent threats, especially in densely built‐up areas. Depending on the magnitude, earthquakes are caused from minor structural damage (e.g. falling objects) up to severe destruction of a whole region. Mori et al. (2007) studied the health needs of people with chronic diseases during an earthquake in Japan. They state that natural disasters have a large physical and mental impact on people with chronic diseases. To minimize exacerbation of symptoms one should pay attention to medication availability and appropriate food (e.g. diabetics), but also for stress management or support for activities of daily living.
Current technology allows monitoring of volcanoes and as eruptions do not occur without warnings, they can be predicted very well. Hence, there should be enough time to prepare for the eruption. Consequently, the International Disaster Database (EM‐DAT, 2011) lists no volcanic disasters in industrialized countries with harm of people. As the usual action is evacuation, volcanic eruptions do not influence HHC significantly. Therefore, the classification in Table I must be seen as potential influence only, if early warnings are failing.
Mass movements like landslides or avalanches mostly occur in alpine regions and have a huge damage potential if directly hitting areas of settlement. Otherwise, they may easily lead to isolation of certain regions, without infliction of major damage or harm. Therefore, the number of clients is likely to increase and if nurses are not able to get to work, their number is also decreasing. As transport and communication infrastructure in alpine regions is usually sparse, failures lead to significant impairments.
Storm disasters may be classified into several sub‐types, but the effects of each type are more or less the same and mostly differ in the affected area. In particular the most common local/convective storm will lead to prolonged driving times and to a reduced trafficability. Roads could be blocked or closed, and power lines could break. Beem et al. (2008) analyze the storm risk in Germany and present a comparison of gust speed and landscape topology. They conclude that the impacts at open fields are much larger than at built areas and therefore, rural regions are more vulnerable. At the same time, the number of available nurses will reduce because some of them may not be able to get to work, while both the number of clients and the service times will increase, since more people would need assistance. Winter storms, which come along with heavy snowfall, will lead to similar effects, due to restricted visibility or slippery roads (see e.g. Changnon, 2007; Norrman et al., 2000). The impact of this type of disaster is much bigger in rural‐ than in urban regions, due to the longer driving distances. Since most power lines in rural areas are overhead transmission lines, snow breakage‐induced blackouts could lead to impairments in communication. Tornados and tropical storms have a particularly high potential for destruction. While the former are highly localized and therefore easier to manage, the second affects huge areas and thus requires a comprehensive disaster management.
Floods can occur in different ways, river floods, coastal floods, and flash floods. Nowadays, river floods are more predictable and therefore provide time to prepare for disaster response. In contrary, flash floods (e.g. caused by heavy rain) or coastal floods (e.g. tsunamis), are hardly predictable, but lead to significant damage. Urban regions are exposed to greater risks because they show large areas of sealed surfaces. The flood risk analysis by Compton et al. (2008) for Vienna reveals that failure of protection measures would lead to substantial damage of transport infrastructure, especially due to possible flooding of underground lines. Thereby, they refer to similar events in Boston, Seoul, Taipei, and Prague. Furthermore, floods often lead to power outages within the flooded area, such that communication will be affected. Clients may need additional services during such events, but limitations in the availability of nurses, however, are only likely to be expected in individual cases, if the nurses are affected themselves or are hindered to get to work.
Extreme temperature events like heat and cold waves affecting primarily the health situation of the clients. However, recent experiences of the ARC revealed that there is reduced availability of nurses during extreme heat events. The main reason for this are cardiovascular diseases. Investigations of past heat waves (see e.g. Diaz et al., 2002; PROCLIM, 2005; Moshammer et al., 2006, 2009) show that especially elderly and single people are vulnerable to heat waves. Palecki et al. (2001) further point out that there is a more significant increase in mortality in urban areas, due to the social structure and the urban‐heat‐island effect. The latter is responsible for the fact that temperature within the city center is higher by up to 8°C and also does not drop significantly during night. Transport infrastructure may be affected by extreme temperatures as road surface could melt or crack and rails could deform. But usually this is only the case to a very limited extent, therefore we do not take this into account.
The main problem of epidemics is the huge increase in the number of clients and service times, paired with a significant decrease in nurse availability. During influenza epidemics, Knebel and Phillips (2008) revealed that more care‐dependent people would be discharged from hospitals earlier, due to short capacities, and that about a quarter of nurses will be sick themselves. Another problem arises from the fact that not all nurses will appear at work, especially if no protective measures are taken (e.g. vaccines). Ehrenstein et al. (2006), Mackler et al. (2007), and Irvin et al. (2008) analyze this circumstance for different diseases like avian influenza and pox. They state that only 20 percent of the nurses are willing to work in the worst case. In this case no protective measures are available. Furthermore, they mention that the willingness to work increases with the qualification level of staff. Gershon et al. (2007) state that the incidence of new diseases seems to increase, and that climate change leads to a shift in vector ranges, such that tropical diseases may occur in temperate regions. Globalization also helps to spread diseases. Theoretically, epidemics may also influence transport or communication infrastructure, but as this only happens if social life totally collapses, we assume that they will not be influenced much.
As technological disaster, blackouts take up a special role since they are often the result of other disasters or man‐made and technical failures. In most cases, however, external events such as extreme weather conditions or other disasters lead to disturbances in the power supply. Pirker and Wiesinger (2005) give an overview of impacts of storms, mass movements, or geographically large events like floods or droughts. Power outages are affecting virtually every area of daily life. Schrümpf (2008) exemplarily describes the impact of a blackout on normal daily routine. A recent and more detailed study about the effects of large‐scale and long‐lasting blackouts was carried out by the “Committee on Education, Research and Technology Assessment” of the German Bundestag (Burchardt et al., 2011). They analyze the effects on several critical infrastructures like telecommunication, transport (road, rail, water, and air), supply of goods (e.g. water, food), and waste disposal, as well as on the financial and health care sector. The authors conclude that after a few days the adequate supply of the population is no longer ensured in affected areas. Freese et al. (2006) analyze the impacts on New York's emergency call system in August 2003, caused by a heat‐induced blackout. They reveal that cardiovascular‐ and respiratory problems, as well as gastro‐intestinal disorders have increased, due to the high temperature, increased physical exertion, and failure of food‐cooling systems. Therefore, increases in number of clients and service times are most likely. Especially in urban areas, it will also come to prolonged driving times and reduced trafficability, due to the collapse of electricity‐based modes of transport like underground, train, and tram. Using buses or cars instead is also not a good alternative because of failure of traffic management systems (e.g. traffic lights). Fickert and Malleck (2008) describe the impact on telecommunication infrastructure. While the old‐fashioned fixed phone line can often be maintained for days, the supply of the new mobile and broadband technologies is only possible for a few hours, at maximum. This hits especially those organizations, which use mobile devices for managing their nurses.
Besides the described singular events, one should also consider that several disasters could occur at the same time or that one disaster might trigger another one. This could lead to multiplier effects and to larger impacts. An example of this can be seen in the earthquake off the coast of Japan in March 2011, which led to a tsunami, which itself triggered a nuclear disaster.
4. Real‐life application for assisting HHC
We studied the HHC services of the ARC in detail for the two provinces: Upper Austria and Vienna. In both regions the task of routing the nurses is done manually or only with limited computational assistance. There is no DSS which computes and suggests possible schedules. Together with the ARC we developed a mathematical model and a software prototype to optimize the daily scheduling of rural HHC services. The main requirements for the software prototype are as follows:
to find good and feasible solutions;
in short computation time; and
with the possibility to incorporate the different effects of disasters.
4.1 Solution approach
The developed model is based on a vehicle‐routing problem (VRP) and takes all the requirements of HHC in rural areas into account. The aim of the optimization is to assign all service tasks a client needs to nurses and to determine the most efficient visiting order, so that the sum of driving times and waiting times of nurses is minimized. At the same time the satisfaction level of both clients and nurses should be maximized. Several factors that may be considered as indicators of satisfaction were incorporated into a weighted objective function. For the clients, the compliance of the preferred nurses and treatment times are measured. On the side of the nurses, overtime and overqualification, as well as the violation of the preferred working times and break times are considered. Constraints that must not be violated are working time regulations (maximum working hours, mandatory breaks, and shift work) and treatment times, if they are time‐critical (e.g. insulin shots). Furthermore, a nurse may also medicate a client only if he/she has the necessary qualification level and shares at least one common language with the client. It is also possible that a client rejects the treatment of a specific nurse due to previous incidents; this is also possible for the nurse. Moreover, there are also various employment contracts; nurses may start their paid duty at home, at the ARC base, or at the first client's home.
Small test instances of the problem can be solved exactly with the solver software Xpress 7.0. However, for real‐life instances it is not possible to find exact or even feasible solutions within finite computing time. Therefore, we developed an algorithm based on variable neighborhood search (VNS). We have chosen this metaheuristic, because it has proven to be a good choice for solving VRPs. A detailed description of the mathematical model formulation and the adapted VNS algorithm can be found in Trautsamwieser et al. (2011).
To enable use of the algorithm in case of a disaster we followed a two‐step approach. In the first step the required data are processed for the second step, the optimization itself. This allows more flexibility since the optimization is independent from disaster modeling. Although most of the scenarios presented in Table I are quite likely to influence the test regions in Upper Austria, it is hard to predict the consequences on HHC in quantitative measures without the corresponding data. Driving times, for example, will increase in most cases but on which roads and by how much are not easily answered questions. Various disasters are locally limited in their impact and both intensity and the affected area cannot be accurately predicted, even with latest forecast models. One just has to think of storm damage or flooding caused by heavy rain. Therefore, we present results for disaster scenarios for which plausible data are available. In the case of Upper Austria data for various flood scenarios are on hand.
The developed software prototype is quite flexible and easy to handle. The team leader or any other person in charge can compute various scenarios. Typically, the overall aim is a minimization of driving times and waiting times. Nevertheless, the team leader can also account to the other attributes which lead to a higher satisfaction level of nurses and clients. These attributes lose their attractiveness in case of disasters, in which decision makers are mainly interested to find feasible schedules. Those can be found by concentrating on a reduction of driving times and waiting times. Hence, the other objectives like overtime have been neglected in the following computations. Additionally, computing time often plays a vital role in case of disasters. Therefore, the user of the software prototype can specify how much time she/he has at disposal to compute a solution.
4.2 Numerical studies
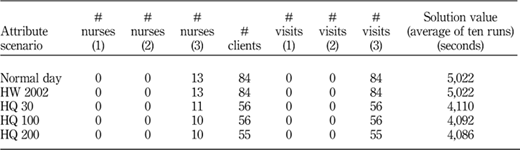
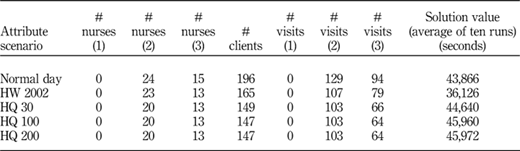
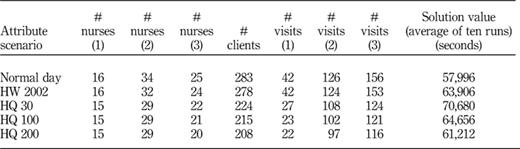
The software prototype was tested for three different regions in Upper Austria. These regions are affected by floods regularly. Region r1 is a small urban region, whereas regions r2 and r3 are bigger in size and rural. For these three regions we obtained real‐life data from the ARC. Tables III‐V give an overview on the problem sizes in these regions. For example, in region r2 there are 39 nurses employed to serve 196 clients. Some of these clients have to be visited several times a day for different treatments. Hence, in total 223 home visits are required. In region r1 the number of clients equals the number of visits, whereas in region r3 283 clients need 324 visits. Each visit is characterized by a certain qualification level according to the nurses abilities needed for this visit. A nurse is only allowed to visit a client if the qualification level of the nurse is at least as high as the qualification level required for this visit. A visit with a qualification level of 1 might be a simple aid in the household and is done by home helpers, whereas a visit with a qualification level of 3 requires a qualified nurse.
The provided data contains the performed visits, the addresses of the participants, the qualification level of both nurses and visits, and the daily contract working times of the single nurses. The data of the duration of the visits as well as the time windows of the visits, in which the treatment has to happen, are not yet recorded in an electronic form. Sometimes the operative staff decides during the day if it is necessary to visit a client in a specific time window. This is often based on information gathered in an informal way (e.g. phone calls from colleagues or the client). Additionally, the service times for the treatments are not standardized and depend on individual factors. Nevertheless, we know that the duration of the visits is normally distributed with a mean dependent on the qualification level. The following times in minutes are needed on average to perform a visit with a certain qualification level: 1 (46.69 minutes), 2 (39.71 minutes), and 3 (28.81 minutes). The standard deviation is set to 15 minutes. Each visit has to be covered within a time horizon of 720 minutes. Some of the visits are assumed to be time‐critical and have to be covered within a time frame of 120 minutes. They are spread over the day randomly. Visits with a qualification level of 1 are usually not time‐critical, because they are not life‐threatening. Some visits with a qualification level of 2 or 3, as for example the change of bandages or an insulin shot, are however time‐critical. The concrete numbers of assumed time‐critical visits for each region (depicted in Table II) were generated through estimates of the decision makers and evaluation of historical data.
According to the decision makers language skills are not relevant in these regions, at the moment. This also holds for preferences of clients and nurses with respect to their preferred working times and treatment times. According to the different work contracts, nurses start their shift at home, at the ARC base, or at the first client's home.
In the following we compare results for a normal day (i.e. a day without any disturbances), a recent flood scenario of the year 2002 (HW 2002), and three flood predictions, estimated by “Hochwasserrisikozonierung Austria” (HORA). HORA is a project funded by the Austrian Government to estimate future potential risks of flood scenarios. Therefore, flood scenarios of the past have been analyzed to estimate 30‐, 100‐, and 200‐year return flood discharges (HQ 30, HQ 100, and HQ 200). We have used these estimations on the current data set to show the consequences of floods on HHC in the corresponding regions. This was done within the geographic information system (GIS) Arc GIS 9.3. The flood zones were used to identify impassable road segments. Based on the remaining roads, shortest travel times were computed between all locations (nurses, clients, and base). The shortest travel time calculation itself was done by the “Department of Geoinformation and Property” of the federal government of Upper Austria, since we did not have access to all required data. In order to calculate travel times that largely correspond to reality, average travel speeds based on floating car data were used therefore. For each scenario, the corresponding travel times were stored in driving time matrices. After this first step of data preparation the optimization starts.
To make suitable comparisons all results are based on the same data set, but with different underlying driving time matrices. The solution values equal the sum of driving times and waiting times for the whole schedule, measured in seconds. As the VNS algorithm includes some randomness in its search procedure, the averages of ten runs are reported. In general, we assume that in case of disasters the results will be worse compared to a normal day. This means that the solution values will increase or no feasible solution can be obtained. However, this is not always the case as shown later. The number of available nurses usually decreases because some of them cannot start their shifts, whereas the number of clients increases. In these computations the number of clients does not increase, because we do not have any information about clients who will only need treatment under such circumstances. Currently, there exists no reliable data about that; it can be assumed that this information is highly dynamic in disaster situations. Therefore, we rely on the number of clients under normal conditions for our computations. Some of the current clients may not be reached via the road network in case of floods. A part of these clients might need to be evacuated and brought to intramural facilities, whereas some treatments might be postponed to a later time if they are not life‐threatening. The decision rests with the person in charge.
As shown in Table III floods do not really have an effect on the results for region r1. If an HW 2002 repeats, the flood neither leads to a reduction in the number of available stuff, nor to a reduction in the number of clients. Moreover, no essential parts of the road network are affected. Hence, the same solution value as under normal conditions is obtained. For an HQ 30, the number of nurses decreases by two and the number of clients that cannot be reached equals 28. In case of an HQ 100 and HQ 200 these numbers change only slightly compared to an HQ 30. We obtain smaller solution values for these scenarios compared to a normal day, because the problem size is smaller and there exist a lot of short ways from one client to another, as region r1 is a small urban region. In Tables III‐V the qualification level of the nurses and the required qualification levels for the single visits are written in parentheses.
In region r2 it can be observed that in case of the floods 2002 a smaller solution value can be obtained. There are two reasons for this result. First, the number of nurses and visits decreases in relation to a normal day. Second, the driving times do not increase a lot between the clients in reach. An HQ 30, HQ 100, or HQ 200 in contrast leads to a higher solution value, although the number of nurses and clients reduces even more. However, in this region the driving times increase significantly and so more time is required to visit all clients.
In region r3 the solution value increases for all disaster scenarios. The number of nurses and the number of clients decreases in all cases. However, feasible schedules can be found for all scenarios.
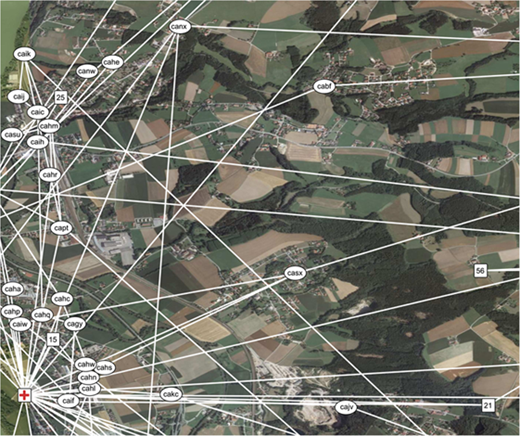
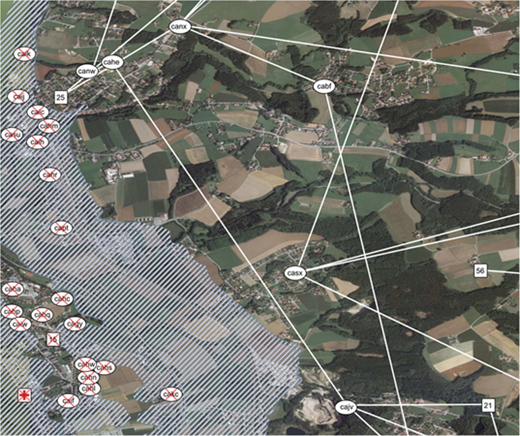
Figure 1 shows exemplary a part of the solution of region r3. On a normal day there are 75 nurses available who have to handle 324 visits at 283 different clients. Since 21 nurses have to visit the ARC base first, many routes start and end there. The clients are marked with circles and show the client ID, the nurses are marked with rectangles and their ID, and the ARC base is symbolized through a rectangle with a cross. Figure 2 shows the same area as Figure 1, but in case of an HQ 200 flood. The flooded area is shaded and all locations that are affected by the flood are crossed out in Figure 2. If a client is not located directly within the flooded area but is surrounded by water and therefore not reachable anymore, she/he is also crossed out if there is no suitable nurse nearby. In the HQ 200 scenario the number of available nurses is reduced by 11 but also the number of visits decreases significantly. The ARC base will also not be reachable in case of such enormous floods. Although, only those nurses who drive directly to their first clients are scheduled in the computed solution, other disaster scenarios may require all nurses to obtain feasible solutions. For such situations all nurses should be able to drive directly to their first clients, independent of their contract.
We presented results for a normal day and various flood scenarios. The consequences of other disasters might be investigated by sensitivity analysis, since no quantitative data are available for these disasters. Typically, the driving times increase for many disasters as depicted in Table I. A possible scenario might be a reduction of the travel speed such that driving times increase by a certain factor for a certain number of roads. We also mentioned that both the number of clients and the service times will increase. This may not hold for all clients because nurses could try to tighten the service time at unaffected clients, if this is possible. Furthermore, there are currently no data available about clients who only need treatment during disasters. Hence, the number of clients and their service times are hard to predict and thus are best modeled by a sensitivity analysis. The presented computations show that there is still a buffer for new clients and extended service times even in case of an HQ 200. Therefore, the ARC is prepared for a certain level of uncertainty in the tested areas.
5. Final remarks
Several studies indicate that industrialized countries will be confronted with an increased demand for HHC in the future. Furthermore, it can be expected that the number of natural disasters increase. Therefore, HHC service providers will be faced with two challenges: an increased organizational effort due to the increased demand and the need for an anticipatory risk management. As shown in Section 3 there are many potential disasters that may influence HHC. We showed exemplary how potential floods affect HHC in three regions in Upper Austria. To tackle the above‐mentioned challenges we presented a solution approach from Trautsamwieser et al. (2011) that has been developed in cooperation with the ARC. The algorithm ensures that resources are used as efficient as possible and the chosen design of the software prototype also allows disaster modeling within GIS. This also opens up the possibility to use real‐time data, such as available at the public authorities. As disaster modeling is done independently from optimization, various disaster types can be incorporated.
For further evaluation, the software prototype is going to be tested in the daily business at the ARC in Upper Austria. Together with the ARC in Vienna, a software prototype for optimization of HHC in urban regions is currently in development. Due to the different requirements mentioned in Section 2, the developed software prototype for rural regions is not suitable for urban regions. Especially the different modes of transport and the usage of time‐dependent travel times require different data structures and algorithmic procedures. Additionally, an inclusion of sequenced visits and divisible mandatory breaks further complicates the model.
For all presented flood scenarios feasible solutions could be found. Nevertheless, still with optimization methods, disasters may occur that make it impossible to sustain the care for all clients. Therefore, some kind of triage should be implemented in future. At the ARC triage is based on the profound knowledge of the nurses and team leaders. To build up a comprehensive and staff independent triage system, sufficient data about the clients and their relatives are needed. These data are currently not available. Furthermore, it is intended to enlarge the planning horizon from a single day to one week. This gives decision makers more flexibility, as it offers the possibility to postpone non life‐threatening services to a later day in the week. Indeed, this leads to a more complex model because one has to consider additional constraints like mandatory rest periods or constancy of the servicing nurses.
The presented DSS was intentionally designed and developed to help HHC service providers in industrialized countries like Austria to cope with the increasing demand and to support them during times of disaster. As this DSS relay on modern information technologies, its applicability in developing countries may be limited at the moment.
The authors are grateful to the ARC for providing data and suitable information; especially to Monika Wild, Reinhard Schmidt and Harald Pfertner. The authors also want to thank the Austrian Federal Ministry for Transport, Innovation and Technology for financial support by grant no. 824753, within the National Research Development Programme KIRAS Austria.
References
About the authors
Klaus‐Dieter Rest is a Research Assistant at the Institute of Production and Logistics, University of Natural Resources and Life Sciences, Vienna, Austria. He holds a Diploma in Business and Economics, specialist area Management Science and is currently working on his Doctoral thesis in the field of Optimization of Urban Home Health Care. His research interests are within the field of health care logistics, urban logistics but also in disaster management.
Andrea Trautsamwieser is a Research Assistant at the Institute of Production and Logistics, University of Natural Resources and Life Sciences, Vienna, Austria. She holds a Diploma in Technical Mathematics. Her main areas of focus are health care logistics, integer programming, mathematical modelling, and matheuristics. To this end, she has published papers in internationally peer reviewed journals and presented her work at several international conferences.
Patrick Hirsch is an Assistant Professor and Project Manager at the Institute of Production and Logistics, University of Natural Resources and Life Sciences, Vienna, Austria. He obtained his Doctoral degree in Business Administration from the University of Vienna. He received two awards for his Doctoral thesis. His research interests include transportation logistics, health care logistics and disaster management. Together with his team, he obtained some research grants in this area. In his research projects he works together with other universities, companies, and non‐profit organizations such as the Austrian Red Cross. He has presented his work at several international conferences and published some book chapters and journal articles. Patrick Hirsch is the corresponding author and can be contacted at: patrick.hirsch@boku.ac.at