As the intensity of natural disasters increases, there is a need to develop policies and procedures to assist various agencies with moving aid to affected areas. One of the biggest limitations to this process is damage to transportation networks, in particular waterways. To keep waterways safe, aids to navigation (ATONs) are placed in various areas to guide mariners and ships to their final destination. If the ATONs are damaged, then the waterways are left unsafe, making it difficult to move supplies and recover from a disaster. The aim of this paper is to explore the effectiveness of pre‐positioning strategies for port recovery in response to a natural disaster.
A stochastic facility location model is presented to determine where teams and commodities should be pre‐positioned in order to maximize the number of ATONs repaired, given a constraint on response time. The first stage decisions focus on determining the location of resources. The second stage decisions consist of the distribution of supplies and teams to affected areas.
Results show the benefit of pre‐positioning and the value of coordination toward the responsiveness of restoring waterways. Furthermore, the relationship between resources, repair time, and response is characterized.
There has been extensive work addressing pre‐positioning as it relates to responding to the needs of populations affected by disasters. However, little has been done to explore pre‐positioning in the context of business recovery from severe weather events.
1. Introduction
Ports and waterways are key modes of transportation used to move cargo, commodities and other assets around the country. There are approximately 360 publicly and privately owned ports within the USA, each of which is dedicated to transporting specific commodities based on their location and proximity to certain industries (Haveman and Shatz, 2006).
Disruptions at ports due to manmade or natural disasters can have a significant impact from an economic and operations perspective. For example, the 2002 west coast (Los Angeles/Long Beach) port shutdown due to labor disputes caused the US economy to lose approximately 6.3‐19.4 billion dollars (Park, 2008). As a result of Hurricane Katrina many ports on the gulf coast were closed, resulting in increased oil prices (Haveman and Shatz, 2006). Hurricane Ike caused 14 refineries in Texas to be shutdown which caused a major disruption in energy supplies nationwide. Some energy officials even expected a possible rise in gasoline prices (Nichols and Seba, 2008).
Restoration of transportation pathways after a natural disaster is one of the major components of the recovery activity. Movement of relief goods to affected areas primarily occurs via land, air or sea. Effective goods movement can hamper the response effort if the required materials are not readily available for rebuilding the infrastructure. In the case of the Haiti Earthquake, piers were damaged at the port which hindered the aid from reaching affected victims (CNN News, 2010).
Many ports have hurricane preparedness plans set in place ahead of a storm. These plans provide an outline of preparation activities in 12 h increments (i.e. 12, 24, 36, 72 h) until the port shuts down completely. Examples of some of these preparation activities include the following: vessel owners notifying the US Coast Guard (USCG) whether the vessel will remain docked or leave the port; suspending all vessel operation (loading/unloading); storing equipment in proper position to prevent movement or moving it to a safe location.
Another important factor that is critical to the safety and navigability of waterways post‐storm is proper functioning of aids to navigation (ATONs). ATONs assist vessels and mariners with navigation through the waterways and are mostly located on water. Examples of such equipment include lighted/unlighted buoys, minor lights/beacons and day beacons. During severe weather events, it is possible for some of these ATONs to be damaged. As a result of Hurricane Katrina, approximately 63 percent of ATONs in New Orleans, LA and 87 percent of ATONs in Mobile, AL were damaged. Many were in proper position but, their sound and light signals were working at low power and thus needed to be repaired. (USCG, 2005b). Damage to the ATONs resulted in 11 port closures for the gulf coast. After Hurricane Katrina, it took four days even with shipping disruptions to reopen ports. Furthermore, four weeks after the storm there were still 500 ATONs that had still not been repaired (Caldwell, 2006). A key post‐storm readiness measure for ensuring ports are functional is to make sure waterways are navigable. These same ATONs regardless of a disaster receive routine maintenance in order to maintain protection for waterways. The USCG has a process in place to prioritize the repair of damaged ATONs. However, the manpower and resources required for the repair process were overwhelmed after Hurricane Katrina (Caldwell, 2006).
The purpose of this research is to develop a model that can help with understanding the impact of port disruption and the effectiveness of pre‐positioning emergency repair commodities to provide rapid response for port recovery actions. Some of the earliest work addressing optimal stock levels of repair items was done in the context of aircraft engine repair for the United States Air Force (Sherbrooke, 1968). The repairable inventory problem addresses the optimal stocking level and placement of repairable units in a two‐echelon supply chain consisting of a single supplier (depot) and multiple operational locations (bases). Optimal stocking policies are determined based on a service condition (e.g. maximizing availability, minimizing backorders) subject to a budget constraint (Guide and Srivastava, 1997). Several extensions to this problem have been considered including multi‐item, multi‐indenture repairable units (Muckstadt, 1973), queuing‐based multi‐echelon approaches to determining the number of repair facilities and number of spares (Gross and Pinkus, 1979), transshipments between bases (Pyke, 1990), limited repair capacity (Jung and Lee, 1989; Diaz and Fu, 1997 ), non‐identical maintenance facilities (Shtub and Simon, 1994), multiple resupply modes (Perlman and Levner, 2010) and alternate objective functions such as minimizing expected cost (Kim et al., 1996). For an extensive discussion of the literature in this area, the reader is referred to Kennedy et al. (2002) and Guide and Srivastava (1997). It should be noted that some repairable inventory management models incorporate reverse flows to repair facilities. The term spares inventory management usually reflects the case where reverse flows are not included since the spares are not repairable (Guide and Srivastava, 1997). Some recent work related to inventory management of spare parts has included rationing when there are multiple demand classes with varying levels of criticality (Kocaga and Sen, 2007), inclusion of response time constraints on repair activities (Caglar et al., 2004), and spare parts classification methods (Molenaers et al., 2012; Bacchetti and Saccani, 2012).
The problem presented in this paper considers repairable units as well as replacement parts but differs from the repairable inventory literature in that reverse flows of the failed unit to the repair facility are not considered. In this sense, optimal stocking of functional spares is considered. Furthermore, spare part criticality is incorporated through the repair priority for the failed end item. In the work presented in this paper, equipment failure results from an extreme disaster event, resulting in a surge in demand for repair items. In the repairable inventory literature, demand for spares is primarily modeled as a function of the failure distribution associated with the using item (which is often assumed to follow a Poisson process). Therefore, inventory stocking policies for ATON repair items is more closely aligned with inventory management under demand surge conditions. There is an extensive body of work in the humanitarian logistics literature addressing inventory management under situations of demand surge, where the demand surge is primarily resulting from extreme natural disaster events (e.g. Rawls and Turnquist, 2010; Lodree, 2011; Falasca and Zobel, 2011). One strategy for planning inventories to respond to the demand caused by these events is to stock items in some short‐time frame prior to the occurrence of the event. This activity is commonly referred to as stock pre‐positioning. To address the timely repair of ATONs, the model presented in this paper also uses pre‐positioning. Specifically, we focus on the pre‐positioning of workforce and commodities needed to repair ATONs and determine the optimal stocking quantities of those commodities to ensure the port is returned to an operational status as quickly as possible. This research objective is achieved by the development of a two‐staged stochastic model to maximize the amount of aids repaired during the response phase.
The remainder of this paper is outlined as follows. Section 2 summarizes related literature on inventory pre‐positioning. Section 3 describes the problem background, assumptions and modeling approach used for this research. Section 4 outlines the experimental design and data used for the numerical study. The results of the numerical study are presented in Section 5. Concluding remarks and areas of future study are presented in Section 6.
2. Literature review
2.1 Overview of pre‐positioning
Pre‐positioning is defined as the method of placing supplies or commodities in strategic locations to be readily available for response teams. This method was first used by the military to provide various supplies during war efforts (Johnstone et al., 2004). Many relief organizations have begun to use the very same method to increase response after large‐scale emergencies. For example, CARE international organization is one of the largest relief organizations that disperse supplies and resources to countries in need. Duran et al. (2011) develop a global supply chain relief network for CARE that determines where supply should be pre‐positioned and how much should be pre‐positioned such that average time to transport items to a regional demand area is minimized. Although pre‐positioning is accepted, there have been instances where it has not been very favorable. Balcik and Beamon (2008a) state that pre‐positioning can be costly and only a few organizations can support having distribution centers to store and distribute relief commodities (e.g. World Food Program, World Vision International and United Nations Humanitarian Response Depot).
In order to determine the best pre‐positioning approach, the location and quantity of commodities must be considered. Depending on the length of time or type of commodities being stockpiled, organizations or agencies should weigh usability and potential danger of locations based on the damage that can occur if a disaster strikes. Various pre‐positioning models have been developed to address location or location/quantity determination of supply items. The relevant research is summarized in the following sections.
2.2 Location selection
Humanitarian related pre‐positioning models in response to disasters reflect the most recent pre‐positioning literature by academic researchers. Jia et al. (2007) develop a model that determines the number of facilities to locate in order to address large‐scale medical emergencies such as a small pox outbreak or anthrax threat. The facilities are located such that the quality of the response (measured via demand coverage or minimum service distance) is maximized. Ukkursuri and Yushimito (2008) propose a general location routing model which determines where to preposition hurricane relief supplies. The selection of the locations takes into consideration the reliability of the ground transportation network and thus maximizes the reliability a demand area is reached. Military related pre‐positioning models have been developed by Johnstone et al. (2004), Brown et al. (2005) and Ghanmi and Shaw (2008). Johnstone et al. (2004) develop a mixed‐integer programming model to minimize the total response time required to meet munitions demands of various air bases. The model determines the location of afloat pre‐positioning ships (AFP) and the flow of the material from AFP to ports of entry to support munitions demand by air bases. The model of Brown et al. (2005) determines where to position defensive interceptor platforms, which are used to combat theater ballistic missiles. The proposed model can accommodate the case where both attacker and defender have knowledge of the other's strategy and can determine an optimal defense against an attack assuming the attacker expects no defense. Ghanmi and Shaw (2008) develop a simulation‐optimization model to evaluate different air and sealift strategies as well as strategic pre‐positioning of assets. Monte‐Carlo simulation is used to study the effectiveness of the various lift options and pre‐positioning strategies. They measure the impact of pre‐positioning on deployment cost and time.
2.3 Location/commodity quantity determination
Rawls and Turnquist (2010) consider a multi‐commodity pre‐positioning and location problem to satisfy demand resulting from a hurricane. The objective is to find the number of new facilities to open, the size of the facilities and the purchase quantities for the materials that are pre‐positioned. The problem is formulated as a stochastic mixed‐integer programming model with uncertainty in demand, damage to roads and damage to facilities determined from hurricane scenarios. Duran et al. (2011) develop a mixed‐integer programming model to determine the location of supply warehouses and the quantity of relief supplies to be stored in a global relief network. The warehouse locations determined by the model minimize the average response time over a set of demand scenarios. The demand scenarios are comprised of quick onset disasters such as earthquakes, windstorms, wave surges and floods.
Balcik and Beamon (2008a) also consider facility location and stock pre‐positioning decisions for quick onset disasters. They present a scenario‐based mathematical model that determines the number and location of the distribution centers and the amount of relief inventory to stock such that the total expected demand covered by the distribution centers is maximized. The disaster scenarios and associated scenario‐specific demand is constructed from historical data on earthquake‐related disasters. Chang et al. (2007) present a framework for emergency logistics planning in response to floods. Two stochastic programming models are presented to determine the rescue storage locations, quantities of rescue equipment and the distribution of the equipment in a rescue network containing multiple levels (head, regional, local) and resource sharing among levels. The first model groups the rescue areas and classifies their level of emergency such that expected shipping distance of the equipment is minimized. The second model determines the local rescue bases that need to be established after the disaster as well as the corresponding quantity of rescue equipment in the warehouses at all levels. Salmeron and Apte (2010) developed a pre‐positioning model to position food and medical supplies to specified relief locations in order to supply affected populations. Ee Shen (2006) developed a pre‐positioning model that takes into consideration the expansion of facilities to house medical supplies and personnel which are later delivered to help rescue survivors from a hurricane or earthquake scenario.
2.4 Research contribution
While there has been extensive work addressing pre‐positioning as it relates to responding to the needs of populations affected by disasters, there has been little work addressing pre‐positioning as it relates to business continuity. To the best of the author's knowledge, this is the first paper that explores the effectiveness of pre‐positioning strategies for port recovery in response to a natural disaster. The model proposed here considers multiple commodities and the associated workforce required to repair damaged items. Prior pre‐positioning models also address multiple commodities and placement of those commodities within the network, however, we incorporate a bill of material type relationship between repair items and damaged items. In an effort to incorporate realistic operational parameters that drive port recovery decisions, the model presented in this paper incorporates travel time and repair time such that the number of ATONS restored to a functioning state during the allotted recovery phase is maximized. Lastly, many pre‐positioning models address long‐term strategic allocation of resources. We focus on operational decisions and illustrate how short‐term hurricane forecast information can be used to drive resource allocation decisions. Furthermore, we specifically examine the impact of coordination and responsiveness based on the length of the recovery phase.
3. Methodology
3.1 Problem background
The main organization responsible for the maintenance of ATONs is the USCG. This maintenance occurs through the response of ATONs teams. The current process utilized post storm is as follows. Teams assess the functionality of ATONs and categorize them based on their damage (i.e. critical, urgent and routine). If a disaster or emergency damages the ATONs then a team is sent out to fix them or the ATONs are sent to a facility where it can be refurbished.
The USCG currently has nine facilities dedicated to the repair of ATONs which are all located near a port. Most of the supplies needed to repair the aids are not sent out until after the hurricane occurs. The ATONs teams prioritize the damage to the aids by a discrepancy response factor score. This score is a number given to an ATON to show the criticality of damage and determines the level of correction. The higher the score the more critical the damage is to the ATON and the higher the level of correction. Once the ATONs are listed in priority order, the team begins to make repairs so that the waterway is safe again for vessel traffic. Many states within a coast guard district only have one team. Depending on the amount of damages, the length of time to restore the waterways to a navigable state could be extensive. Some minor repairs can be performed where the ATON is located. ATONs that are extensively damaged are taken to a facility to be repaired and then introduced back into its original location (USCG, 2005a).
3.2 Model assumptions
For this problem, we consider two stages. The first stage consists of the preparation phase prior to a hurricane striking an area where ATONs are located. The timing of decisions associated with this phase is short term and initiated by the forecast of an approaching storm. A set of suppliers are used to provide repair items. Various safe locations are designated to hold repair supplies. Each of these facilities can be supplied by federal organizations as well as industry. The second stage consists of the response phase. Based on the level of damage and location of ATONs, supply is pre‐positioned after a storm and sent to the affected areas for repair efforts. The ATONs will use the following priority system: critical, urgent and routine to determine which aids to fix.
For this model, the following assumptions are made.
Demand for repair items:
- (1)
There are four regions representing affected areas where ATONs are located. Those regions are Alabama, Florida, Louisiana and Mississippi and are chosen because they are part of the gulf coast and are prone to hurricanes.
- (2)
The demand for repair items in an affected area is based on projected ATON damage estimates determined from the forecasted path of a hurricane.
Supply locations for repair items:
- (1)
Each supply location represents a coast guard sector and therefore, represents the permanent location of repair teams.
- (2)
There is a limited amount of supplies available in the market. The location of the supplies is not considered in the model but the cost to acquire the supplies from a federal or industry partner is considered.
- (3)
Teams and commodities can be pre‐positioned to safe (land) locations. These locations are known a priori and correspond to areas near the closest port.
Repair commodities:
- (1)
The repair commodities considered in this model are flashers, radar reflectors and discrepancy buoys.
- (2)
Commodities used for on scene repair are flashers and radar reflectors.
- (3)
Commodities used in place of damaged buoys that must be transferred back to safe location for repair are discrepancy buoys.
- (4)
The process to repair ATONs uses the following priority system:
critical – based on damage requires the use of discrepancy buoy until original buoy is repaired;
urgent – the damage is able to be fixed on the scene; and
routine – there is less damage and repair can take place after the most critical ATONs.
Repair teams:
- (1)
Since each affected area within a region is geographically clustered, ATONs teams are assigned to each of those clusters.
- (2)
Each team uses one cutter to navigate to the affected area. Therefore the number of cutters needed is directly related to the number of teams.
- (3)
Teams are dispatched as an aggregate unit.
3.3 Model formulation
A two‐stage stochastic facility location model is developed to solve this problem. According to Birge (1997), the general mathematical notation for this model with recourse is as follows:
where:
The first‐stage decisions, are represented by a vector. These decisions are taken without knowing the full information of some random event. The second‐stage decisions are recourse, or corrective actions based on the information received. The objective function (1) minimizes the cost cT associated with the first‐stage decisions x plus the expected cost of the second‐stage decisions. ξ represents the full information of some random event and Q(x,ξ) or recourse function represents the dependency of the random vector on different scenarios. Constraints (2, 3) are related to the first‐stage decisions of the model. Constraint (4) is related to the second‐stage decisions of the model.
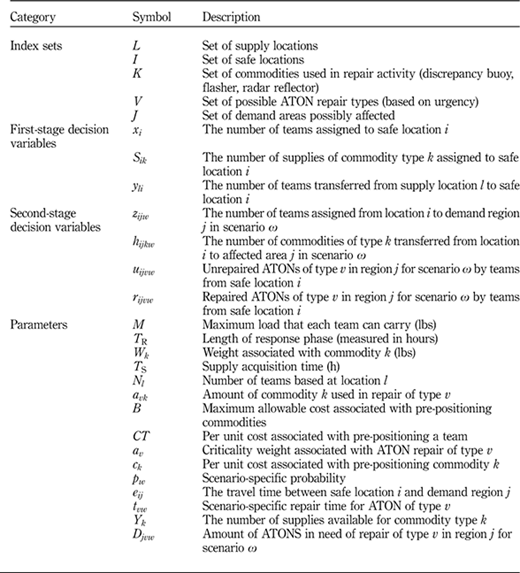
Using this framework, a formal description of the model follows. Table I summarizes the notation:
s.t.
Flow balance (pre‐positioning):
Supply constraint:
Budget constraint:
Aid to navigation team constraint:
Repair time constraint:
Inventory balance constraint:
Repaired ATONs to pre‐positioned supplies constraint:
Affected area constraints:
Non‐negativity constraints:
The objective function (5) maximizes the expected amount of ATONs that are repaired during the response phase. The first set of constraints (6, 7) represent the flow balance equations to ensure the amount of pre‐positioned teams do not exceed the teams available at the respective supply locations. Constraint (8) ensures that supplies stored at a safe location do not exceed the weight of the amount of items that all pre‐positioned teams at a specific location can carry. Constraint (9) represents an upper bound on the amount of supplies (publicly or privately) available for each commodity type. Constraint (10) ensures that cost associated with pre‐positioning does not exceed the available budget. Constraint (11) makes certain the number of teams dispatched per location and scenario cannot exceed available supply of teams per location. Constraint (12) ensures the time to repair items at the demand region per scenario cannot exceed the available operation hours of teams allocated to an affected area. Constraint (13) makes certain that the amount of repaired and unrepaired ATONs equals the total demand (damaged ATONs). Constraint (14) represents the material relationship between repaired ATONs and pre‐positioned supplies. The next set of constraints (15,16) is dedicated to affected areas. The amount of supplies sent to an affected area cannot exceed available supply and commodities can only be allocated to an affected area if the teams are allocated to that area. Constraint (17) is the typical non‐negativity constraints for the decision variables.
The model captures the processes a port takes to become fully operational based on the repair of ATONs. The first‐stage decisions determine the optimal quantities of teams and commodities allocated to safe locations pre‐landfall of a hurricane. The second‐stage decisions determine the amount of teams needed to fix ATONs that are damaged in each region, with regards to the repair type (i.e. critical, urgent, routine).
4. Experimental design
The purpose of this research is to quantify the impact of pre‐positioning activities on the ability of a port to quickly recover from severe weather incidents. The specific research questions of interest are as follows:
RQ1. How will pre‐positioning affect the responsiveness of the port during the recovery phase?
RQ2. What is the effect of supply variation on the amount of ATONs repaired?
RQ3. What is the benefit of private, non‐profits and government agencies working together to provide support?
RQ4. What is the impact of time (repair/travel) on the response phase?
RQ5. What role does the location of safe and supply locations have on the amount of ATONs repaired and the amount of supplies used for response efforts?
Using data obtained from the USCG and the national weather service, an extensive computational study is conducted to answer these research questions. A detailed description of the data is described within the following sections.
4.3 Data modeling and scenario generation
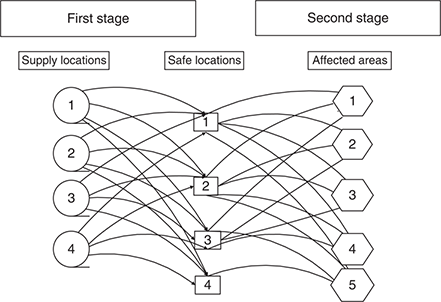
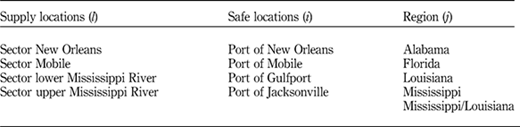
The supply chain (Figure 1) data is represented by l=4 supply locations, j=5 regions (with the fifth region being a combination of two regions) and i=4 safe locations. Each supply location is representative of USCG sectors within the eighth district. The eighth district represents states within the gulf coast region. The safe locations represent different ports located within a region (Table II). The affected areas shown are regions that have ATONs that are damaged.
The demand for supplies is determined based on the location of potentially damaged ATONs throughout the five regions identified in Table II. Given the location of the functioning ATONs are known, those subject to damage are those that are within the path of an approaching hurricane. In practice, historical data of past storm damage would be used to estimate the likelihood that certain ATONs would be damaged given the storm location and intensity. For the purposes of the case study, we use historical data provided by USCG District 8 (damaged ATONs in the locations affected by Hurricane Katrina) to build scenario specific demand estimates. This particular report lists 777 ATONs and serves as the base for our study.
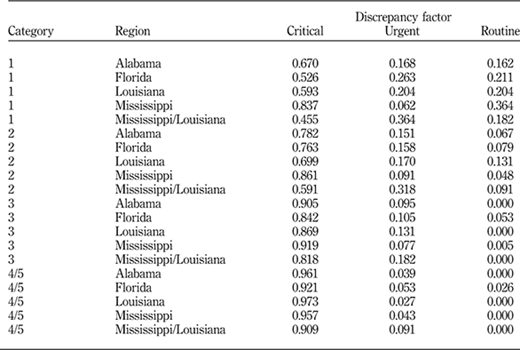
First, each aid was classified as critical, urgent or routine according to the assumptions defined in Section 3. Let Njv denote the number of aids of category v in location j. Second, the fraction of critical, urgent or routine aids damaged is determined. Let fjvw denote this fraction for location j given hurricane category w, which is hereafter called a discrepancy factor. Since the data provided only reflects outcomes associated with a category 3 hurricane, other factors are created by appropriately scaling up or down relative to this case. Table III lists all of the discrepancy factors.
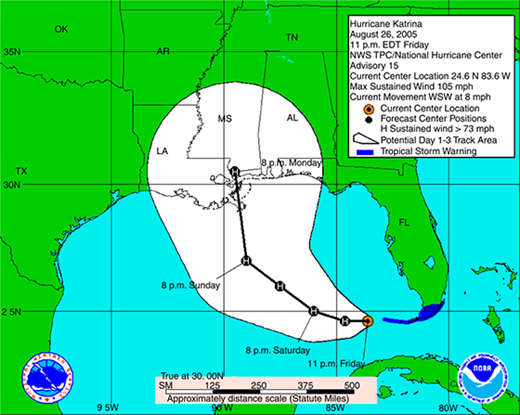
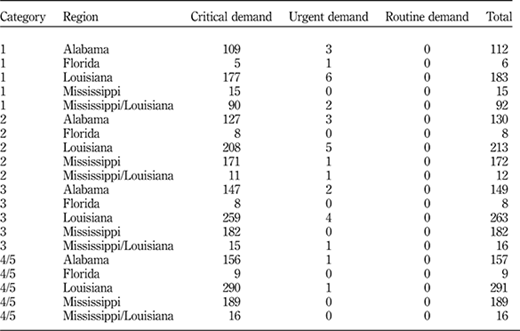
Using the 72 h forecast cone depicted in Figure 2, the likely affected area and as a result, the ATONs that lie within the forecast cone are determined. In order to obtain the demand for repair items per region and storm intensity level (Djvw), the discrepancy factor is multiplied by the total number of ATONs for a region located inside the forecast cone. This computation is shown in Equation (18) and the results are summarized in Table IV:
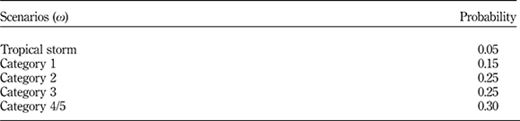
The scenario probabilities are based on information from the National Hurricane Center concerning the strike probabilities for Hurricane Katrina. These probabilities are provided as a function of the Saffir/Simpson scale for a specific forecast of the hurricane's projected path. Table V displays the scenario probabilities for this model based on the forecasted path from Figure 2.
For this model there are two different pre‐positioning costs used: repair items and repair teams. Cost information used for repair items in this model is based on information obtained from USCG web site (USCG, 2010). It is assumed that the repair items needed to fix the ATONs are discrepancy buoys, flashers and radar reflectors. Due to the unavailability of data, the pre‐positioning costs for teams before the disaster occurs are assumed. These values represent the transportation of the teams to the various supply locations. Sensitivity analysis is conducted as part of the numerical study to understand the effect of these costs on the optimal pre‐positioning strategy.
4.4 Performance measures
In order to evaluate the effectiveness of the solution proposed by the model, several performance measures are considered. These performance measures are defined in terms of the objective function and are listed below:
Equation (19) determines the impact of responsiveness, and is hereafter called the response ratio. (∑v∑j∑w∑ipwavrijvw) is the expected number of ATONs that are repaired during the response phase and is the value of the objective function. (∑w∑v∑jpwavDjvw) is the expected number of ATONs needing repair.
Equation (20) determines the relative change in the objective function value between two experiments. This expression quantifies the impact of available supply as well as measure the value of pre‐disaster coordination. The value of pre‐disaster coordination is measured by comparing the objective function values associated with a pre‐disaster preparation policy (pre‐positioning) and post‐disaster coordination policy. The post‐disaster coordination objective function value is determined by eliminating the pre‐positioning decisions associated with commodities in the first stage of the model, adding extra time to procure supplies after the event, and changing the budget constraint to be scenario specific rather than applied to the first‐stage pre‐positioning decision. These activities adequately reflect what happens if coordination is done post‐disaster rather than pre‐disaster.
5. Results
5.1 Impact of responsiveness
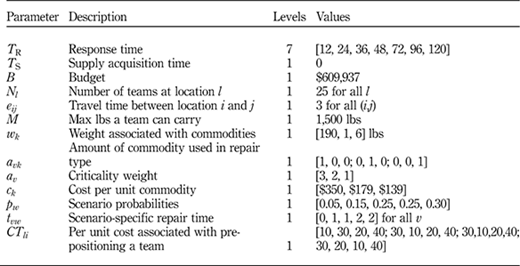
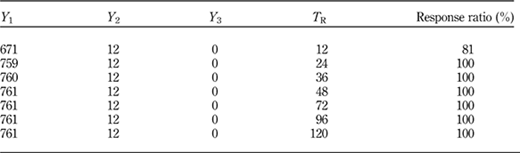
Table VI summarizes the parameters used to examine the impact of responsiveness. It should be noted that to determine the exact amount of supplies needed to repair ATONs based on the parameters of this study, Yk is defined as a decision variable instead of a parameter so that supply is unconstrained. Table VII shows the supplies and corresponding response ratio for each response time considered. The response times of 24 h and higher result in a 100 percent response ratio. This shows that for damage scenarios considered in this case study, a minimum of 24 h is needed to ensure the waterways are returned to a navigable condition. In addition, the amount of critical supply needed is unchanged after 48 h because the amount of teams allocated to the particular regions are unchanged at response times of 48 h and higher.
5.2 Supply variation
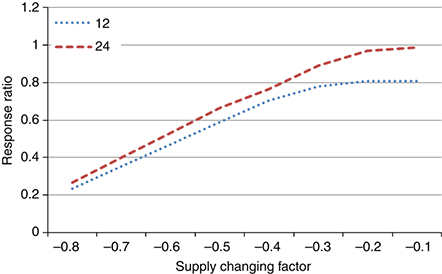
Using the data from Tables VI and VII, the impact of varying the amount of available supply is explored. The optimal number of supplies for the 12 and 24 h case, obtained from solving the unconstrained model, is used in the supply constrained version of the model. These values are decreased from 10 to 80 percent and the results are shown in Figure 3. As the supply changing factor decreases, the response ratio decreases, thus resulting in a decline in the amount of ATONs repaired. This relationship is intuitive, however, the figure quantifies the relative impact of the decrease. For example, in the 12 h response time case, a 60 percent decrease in available supply results in a 47 percent response ratio. This means that less than half of the ATONs are not repaired on average. For response times of 24 h and higher, a 10 percent decrease in supplies still results in an expected response ratio of 100 percent.
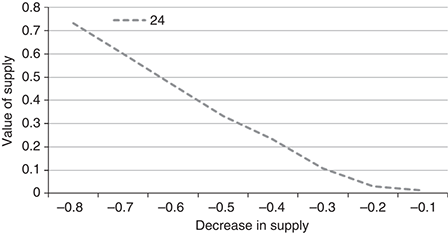
Figure 4 shows the value of supply for the 24 h response time case. The value of supply is measured as the relative decrease in the expected number of repaired ATONs between the base case (as represented by the unconstrained model) and the constrained model. Figure 4 shows an alternative way to measure the impact of inadequate supply. In particular, a 20 percent decrease in supply results in approximately a 5 percent decrease in responsiveness.
5.3 Value of coordination
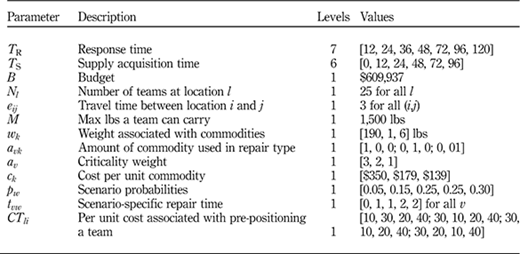
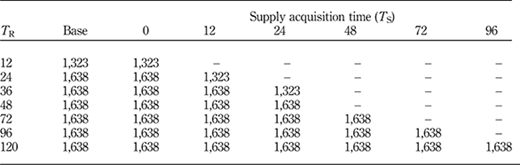
The parameters used for this experiment are summarized in Table VIII. Tables IX and X show the expected ATONs repaired and the value of pre‐disaster coordination, respectively. In Table IX, the base case represents the expected number repaired from the unconstrained supply model as a result of pre‐positioning. The expected repaired for the various supply acquisition times are based on the results from the unconstrained supply model assuming post‐disaster coordination (e.g. no pre‐positioning). The lack of coordination is shown when the supply acquisition time is increased and no pre‐positioning occurs. Increasing supply acquisition time, effectively reduces the amount of available time to repair ATONs. Therefore, when the supply acquisition time increases the amount of ATONs repaired decreases. For example, a response time of 24 and 36 h shows the expected amount of ATONs repaired changes from 1,638 to 1,323. After 36 h the expected amount of ATONs repaired remains the same since there is enough time to offset any increased time needed to acquire the necessary supplies.
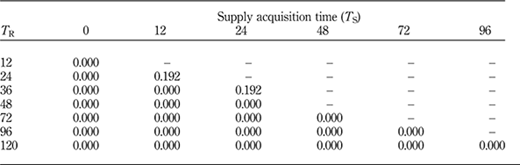
Table X displays the relative decrease in the expected number of ATONs repaired as a result of post‐disaster coordination. For example, a 19.2 percent reduction in effectiveness is achieved when it takes 12 h to acquire the supplies (or about a half day) given a 24 h desired response time. However, if the response time is increased, then 12 h to acquire the supplies has little impact on effectiveness. Essentially, post‐disaster coordination waits for the uncertainty to be revealed before making decisions about the type of supplies needed. The results of the model show that when the desired response time is not tight, pre‐disaster decision making about supplies has little impact.
While it is quite intuitive the increasing supply acquisition time can have a negative effect on responsiveness, it is important to quantify the negative effects. This helps to reinforce the need for coordination efforts well in advance of disaster events.
5.4 Impact of time
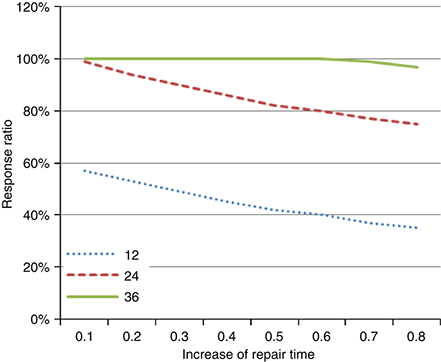
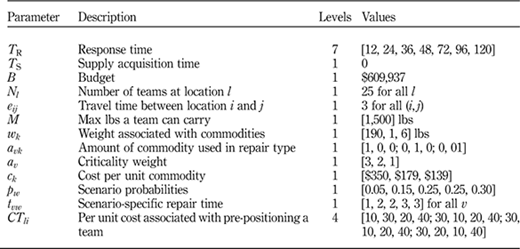
In order to effectively repair all ATONs it is important to understand the impact of repair time on overall responsiveness. Table XI summarizes the parameters used in this experiment. Figure 5 shows the effect of the repair time on the response ratio. It is obvious that increasing the repair time has a negative impact on the ability to repair all ATONs during the response phase. However, even if the repair time estimates are inaccurately determined, a response ratio of 100 percent can still be achieved. This is true for the case when the desired response time is 36 h, and the repair time increasing factor (or equivalently the error factor associated with repair time estimates) is smaller than 0.70.
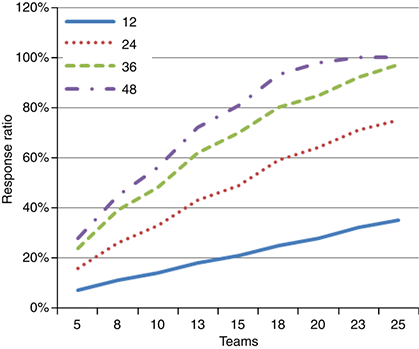
Figure 6 shows in the extreme case (repair time factor of 0.8), the relationship between the resources (teams) and the response ratio. Clearly, decreasing teams has a negative impact on response. When repair time is high and resources are low, expected repairs will also be low. In the face of highly uncertain repair times, the decision maker should ensure there are adequate resources to perform the necessary recovery activities in the desired time.
5.5 Role of supply and safe locations on team allocation
Pre‐positioning of teams is influenced by pre‐positioning costs and travel time from safe locations to affected areas. In order to understand the allocation of teams from supply locations to safe locations, two specific cases are considered: constant travel time and variable travel time. Solution results are evaluated for instances where the available response time is 12 and 24 h using the parameters from Table VI. As discussed previously, these response times are associated with outcomes where the response ratio for ATON repairs are 0.81 and 1.00, respectively.
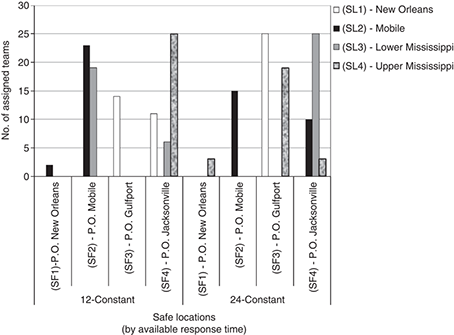
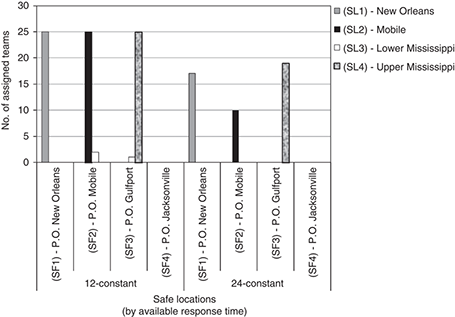
When the travel time from safe locations to affected areas is held constant, the primary factor affecting team allocation is the pre‐positioning cost. Based on the parameters used, one would expect that the teams would be allocated to the location with the lowest per unit pre‐positioning cost. However, as illustrated in Figure 7, this does not occur. This is primarily due to the fact that only 38 percent of the budget is used and any safe location has the same ability (in terms of travel time) to send teams to perform the required repairs. This implies there are several team allocations that can yield the same response ratio overall while satisfying the budget constraint. When the budgetary constraint is reduced to 20 percent of the original budget value ($121,187.40), then the allocation of teams to safe locations more closely aligns with what one would intuitively expect as depicted in Figure 8. In particular, teams are now positioned at safe locations using less expensive “travel arcs.” When the response time is limited to 12 h, teams assigned to the Ports of New Orleans, Mobile and Gulfport are primarily received from New Orleans, Mobile and Upper Mississippi. When the response time is increased to 24 h, a greater number of repairs are made using fewer teams.
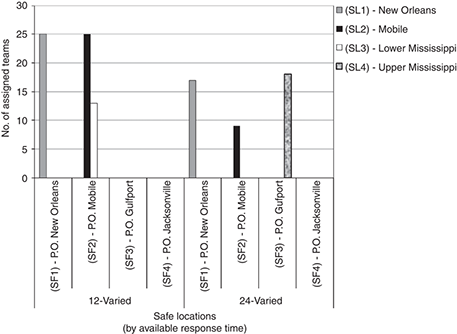
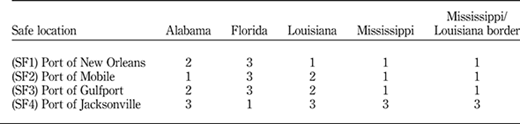
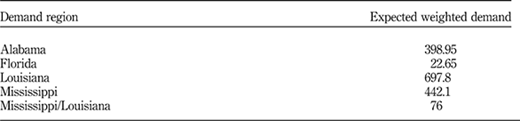
When the travel time (eij) from safe locations to affected areas is not constant (Table XII), team allocations to safe locations are also influenced by areas where the highest service can be provided relative to the heavily damaged area (Figure 9). Table XIII summarizes the cumulative demand across the scenarios weighted by their level of severity (av). Louisiana, Alabama and Mississippi experience highest damage and subsequently the highest demand for resources. As a result, teams are primarily positioned at New Orleans and Mobile for the 12 h response time case. Teams are assigned to the Port of New Orleans from the New Orleans storage location. Those assigned to the Port of Mobile are primarily from mobile, with additional teams sourced from Lower Mississippi. These assignments are intuitive, as Louisiana and the Mississippi/Louisiana border can be effectively served through either port. Alabama and Mississippi can be satisfied by the Port of Mobile.
6. Conclusion and future research
This paper introduced a two‐staged stochastic pre‐positioning model to assist with short‐term port recovery decision making in response to severe weather events, such as hurricanes. In particular, we determine the placement of human and material assets prior to the storm and the distribution of those assets after the storm in order to return the waterways to a navigable state. Constraints in the form of travel time to affected areas and ATON repair time are incorporated in order to realistically evaluate how long it takes for the port to recover from a hurricane event. We also introduce a response ratio performance metric to quantitatively show the level of restoration that can be achieved based on a target recovery time. Using data obtained from the USCG, the model illustrates the impact of coordination achieved via pre‐positioning of repair supplies and response teams.
6.1 Summary of findings
For the case study data used in this research (which is derived from damage estimates based on Hurricane Katrina), the following key results are obtained:
At least 24 h is required to restore waterways to a navigable condition, assuming unlimited availability of supply resources.
When supply resources are constrained and target recovery time is not tight, relatively small deviations from the optimal level of supplies (approximately 10 percent) still result in complete repair of damaged resources within 24 h. Extreme cases of constrained supply (deviations of 50 percent or more) can limit effectiveness by as much as 40 percent.
If the desired response time is sufficiently large, post‐disaster coordination can be an effective strategy to implement as the uncertainty associated with the needed supplies is removed. For the case examined in this work (12 and 24 h response times), as long as the supply acquisition time is <50 percent of the target recovery time, then post‐disaster coordination is helpful. This implies close relationships with component suppliers must be negotiated in advance to ensure resources are obtained at the time needed.
It should be noted that Hurricane Katrina represents a worst case scenario. Therefore, the number of ATONs that may be damaged for non‐extreme cases may be significantly smaller suggesting that repair can be done in a smaller time frame with potentially fewer resources.
6.2 Relevance of work to broader field
While the results presented are quite intuitive, the model provides a different perspective for quantifying disaster management activities. Prior research in disaster management activities has often weighed resource allocation decisions against objective functions based on operation cost or responsiveness to addressing population needs (unmet demand). Restoration of transportation infrastructure is important in being able to execute time sensitive goods movement activities. Therefore, time associated with repair or restoration activities is a key dimension to consider in disaster management modeling literature. From an operational perspective, it is important to be able to quickly evaluate and quantify the impact of resource allocation decisions. The model developed as part of this research, allows for these decisions to be assessed under various disaster scenarios and management directed target recovery time.
The model presented in this paper is largely motivated by port recovery operations. However, it can also be applied to relief inventory planning for simultaneous regional disaster events. Specifically, Djvw can represent the demand for an end item (v) in a specific region j. Each region has a set of relief products that may share similar configurations as defined by the amount of commodity k used in item v (avk). The allocation of teams to demand regions can represent any allocation of critical resources required to transport the relief items to the necessary demand regions, subject to a weight restriction on the resource used. In our model, the weight restriction is based on the maximum amount that a team can carry in a small vessel (cutter). The repair time constraint (12) can be modified to represent scenario specific travel time required to deliver the relief products to the affected population. The objective function can alternatively be interpreted as maximizing the expected demand satisfied based on the priority level assigned to each region.
6.3 Limitations
One of the obvious limitations of the model is the assumption that work is being conducted continuously during the target response time. In actuality, there may be situations where teams work for only a specified time frame (e.g. 10 h). Incorporating worker hours would obviously decrease the number of repaired ATONS during the response time horizon if the number of teams available is held constant. Another limitation is that availability of data on damaged ATONS. While Hurricane Katrina represents an extreme case, resource allocation policies determined as part of this model could be improved with better information about damaged ATONS from other storms.
6.4 Future research
Currently, the model is developed assuming port disruptions and damage to port assets results from a weather event. However, disruptions can also occur from terrorist‐related threats and accidents. The applicability of this model in determining resource allocation of assets in those situations would also be of interest. Another area in which this work could be extended is to create a predictive model for damage estimates based on the storm intensity. This would improve the accuracy of the model in terms of scenario generation, as well as provide more insight into the best resource allocation policies under different storm categories. Lastly, the model could be extended to consider teams making multiple trips to affected areas during the response phase.
The authors would like to thank the US Coast Guard for providing various manuals and documents to help in their understanding of the entire ATON repair process. This material is based upon work supported by the US Department of Homeland Security under Award Number: 2008‐ST‐062‐000010.
Disclaimer: The views and conclusions contained in this document are those of the authors and should not be interpreted as necessarily representing the official policies, either express or implied, of the US Department of Homeland Security.