

The increasing number of natural disasters has increased the attention on emergency plans aimed at providing fast support to affected communities. In this context, inventory pre-positioning management, which involves positioning the materials required to meet the affected community's needs early, has been increasingly acknowledged, but many challenges persist. The purpose of the paper is to provide a decision support system for the optimal quantification and location of humanitarian aid, trying to enhance and extend the existing literature on this topic.
The paper develops a numerical model for inventory pre-positioning of humanitarian aid to reduce both emergency response times and costs connected to goods procurement for seismic events. By examining the characteristics of the territory and the affected population, the model defines the optimal stock levels for four basic need items (hygienic sanitary kits, beds, blankets and camp tents) to be pre-allocated in the territory.
The model was validated using data obtained from the two severe earthquakes that occurred in Italy. The case study showed how the simulated outputs differ from the real case data and the economic benefits of adopting inventory pre-positioning considering the cost reductions (purchase, storage, transport and fulfilment of requirements).
The proposed decision support system allows the pre-positioning of emergency supplies in local areas in order to reduce response times and increase the speed of intervention in the event of seismic events, exploiting the advantages of a simulation model. Numerical and graphical results can easily support improvements in humanitarian logistics, providing those affected with rapid, cost-effective and better-adapted responses.
1. Introduction
In the last thirty years, the number of natural disasters occurring across the planet, and the associated damages, in terms of human lives lost, as well as material, economic and environmental consequences, has seen a continuous, almost linear growth (UNISDR, 2015). A disaster is the result of a huge ecological breakdown in the relations between the man and environment, and it can be natural (earthquakes, tsunami, floods and hurricanes) or human-made (terrorist attacks and chemical leakages) (Caunhye et al., 2012).
These disasters peaked at 500 in 2000 and 2002, compared to slightly over 50 in 1975 (Ruckversicherungs-Gesellschaft, 2013). According to the International Disaster Database (EM-DAT, 2018), in 2018 alone, there were 315 natural disaster events recorded with 11,804 deaths, over 68 million people affected, and US$131.7 billion in economic losses across the world. Furthermore, the world has witnessed the deadliest disaster of the century over the last decade: the number of deaths caused by 2004 Asian tsunami, the 2008 Cyclone Nargis and the 2010 Haiti earthquake was more than 500,000 (Balcik et al., 2016). This increasing number of catastrophic events such as hurricanes, earthquakes or floods has forced the most frequently affected populations to build shelters and prepare necessities ahead of time. In this context, the World Meteorological Organization has highlighted that for each dollar invested in prevention, seven dollars could be saved for humanitarian aids and reconstruction. Currently, however, only 10 per cent of the total funds allocated to emergencies are spent on prevention.
Despite the efforts of scientists and geologists and the technological development in this sector, natural disasters still occur quite unexpectedly or with a warning time too short to enable the population to prepare for the emergency. The adoption of preventive and planning measures for emergency management are thus critical for ensuring the quick recovery of affected communities. The requirement to appropriately respond to emergencies and to be prepared for their possible occurrence has led to a new branch of management: so-called disaster or emergency management (Haddow et al., 2017). This new discipline involves methods and techniques for the management of crisis events, with the main purpose of planning, managing and overcoming emergencies by optimizing and streamlining material, instrumental and human resources.
Emergency management is defined as a discipline that deals with all risks and consequences connected to natural or human-made disasters. It involves preparing, supporting, rebuilding and rehabilitating the affected society through the efficient management of resources and responsibilities linked to the government, voluntary and private agencies (Haddow et al., 2017; UNISDR, 2007; UK-Government, 2004). This definition allows us to distinguish two time horizons clearly: the pre-emergency, which includes all the activities aimed at preparing and planning for mitigation in the event of a disaster, and the post-emergency, which involves the implementation of these actions and procedures to reduce damages and return the economic and social situation to normal.
A natural disaster represents an immediate and often unexpected breaking point. When one occurs, there is a consequent transition from the pre-emergency to the post-emergency phase. The direct nature of this transition involves concise reaction—a critical element in emergency management that demands the appropriate integration of all involved entities. The emergency management cycle identifies five stages within these two time horizons (McLoughlin, 1985; Thomas, 2003; Baird, 2010):
Prevention: preventive measures for human danger should be taken at both the national and international levels. The aim of these measures should be to provide permanent protection from disasters. Not all disasters, especially natural ones, can be prevented. However, the risk of losing human lives or damaging physical assets can be mitigated with environmental planning and design standards.
Mitigation: this phase has a long-term vision that does not focus exclusively on the next emergency but includes all possible future events. The aim is to eliminate disasters or reduce their frequency and intensity.
Preparedness: the purpose of this phase is to achieve a satisfactory level of readiness to respond to any emergency through the adoption of programs that consolidate the cooperation between technical and managerial skills at each decisional level.
Response: this step is an operational stage in which all the activities included in the emergency planning must be translated into real actions. In this phase, the community must face the immediate and short-term effects of the disaster. The aim is not only to save human lives and material assets but also to satisfy basic human needs. The main activities are aid, assistance, research, medical services, evacuation, preparation of shelters, initial repair of damaged infrastructures, etc. The effectiveness of these activities depends heavily on two variables: time and available information.
Recovery: this is considered the most complicated step of emergency management, as it involves decisions and actions related to rebuilding home environment, restarting employment, restoring businesses and permanently repairing and rebuilding infrastructure.
In the last years, several studies have been presented in the literature for pre-disaster and post-disaster management (Heaslip, 2018; Heaslip, 2013; Habib, 2016; Caunhye et al., 2012; Timperio, 2017; Maharjan and Hanaoka, 2019). In particular, the importance of effective supply chain management has been increasingly acknowledged in the humanitarian aid sector (Balcik et al., 2016; Jahre, 2017; Seifert, 2018).
Focussing on the logistics aspect, Van Wassenhove (2006) discussed the differences between logistics in the industrial/commercial and humanitarian sectors, highlighting the similarities and differences, and the need for greater collaboration among companies, research centres, and humanitarian organizations for more effective supply chains. Unlike commercial supply chains, in which logistics operations are relatively established and can regularly be planned, most logistical decisions in the relief chain are made within shorter time frames (Balcik and Beamon, 2008). However, facility location and stock pre-positioning decisions are critical aspects of disaster preparedness and hence require long-term planning to achieve a high-performance emergency response. The use of a warehouse for storing emergency relief items has been proven to improve overall responsiveness, efficiency and effectiveness of the humanitarian supply chain while decreasing the cost incurred in the process (Maharjan and Hanaoka, 2017).
The existing studies that focus on pre-disaster inventory management generally address long-term pre-positioning decision like determining location and amount of stocks (Balcik et al., 2016). In particular, inventory pre-positioning management involves positioning the materials required to meet the affected community's needs ahead of time (Rawls and Turnquist, 2010). It has been increasingly acknowledged in the humanitarian aid sector, and as observed by Heaslip (2018) in the Special Issue on Humanitarian Operations Management, the topic is maturing as a discipline, but many challenges persist.
As shown in detail in the next section, the models proposed in this field are often focused on the choice of number and location of the warehouses or on the relief items inventory. The technical and dimensional characteristics of the relief items are not taken into consideration, and therefore, the sizing of the warehouses is not realized. Most models based localization and inventory decisions on estimated demand in terms of homeless, defining a set of scenarios based on historical data. The simulation and reproduction of natural disasters, such as earthquakes or hurricanes, have not been integrated into these models. Moreover, the methods do not always consider the possibility that the warehouse is destroyed due to the natural disaster (earthquake, Hhurricane, tsunami) and the consequences of such destruction, in terms of infrastructure costs and fulfilment or shortage costs.
For these reasons, the main purpose of this paper is hence to present a numerical approach for the optimization of inventory quantification and allocation in order to both reduce the total management costs and improve response time, overcoming the current gaps in literature. In particular, the proposed model answers the following questions:
Which is the optimal location of the warehouses?
How many warehouses are needed and what size?
What inventory level is required for each relief item (hygienic sanitary kit, camp beds or cots, blankets and camp tents), by reproducing the real conditions that occur during an earthquake and minimizing all costs related to warehouses?
The decision of where to pre-position emergency supplies in preparation for a disaster, such as a tsunami, Hhurricane or earthquake, and how much inventory to pre-position is taken by reproducing the real conditions that occur during an earthquake and minimizing all costs related to warehouses. Therefore, the proposed model provides a decision support system for defining the optimal number of warehouses and the optimal quantity of essential goods to be allocated within a designated area.
The rest of this paper is organized as follows. Section 2 provides a brief introduction to inventory pre-positioning theory and a bibliographic analysis of previous studies in the field. Section 3 introduces the simulation model with its hypothesis, input data and steps for implementation. The calibration of the basic parameters and validation of the model using data taken from the two worst earthquakes occurred in Italy in the last 40 years (Irpinia in 1980 and L'Aquila in 2009) is presented in Section 4. Section 5 presents and discusses the simulation results, and finally, the main conclusion and future development are presented in Section 6.
2. Inventory pre-positioning: state of the art
The modern concept of inventory pre-positioning was first introduced in the army in the sixties when the USA placed stocks in European warehouses to deal with the Berlin crisis. During the years, this concept became officially known as pre-positioning of material configured in unit sets (Akkihal, 2006). Fritz Institute has formally defined the pre-positioning problem as the process of planning, implementing and controlling the efficient, cost-effective flow of and storage of goods and materials, from disaster location to point of consumption for supporting vulnerable people. (Thomas and Mizushima, 2005).
The materials placed in these warehouses are generally bulky. This means that on the one hand, there is the negative effect of the increased holding costs. On the other hand, however, there is a significant reduction in transport costs and loading/unloading times, increasing promptness in the provision of aid. The main purpose of inventory pre-positioning theory is to improve emergency response times by reducing the time spent delivering non-consumable goods in the event of a disaster. These goods, which are similar to those needed for military pre-positioning, are used for the construction of temporary structures and for facilitating rescue operations. They include medicine and medical equipment, food, personal hygiene and healthcare kits, shelters and accommodation, special and security tools, means of transport, storage and management equipment, water supply systems, electrical devices, radio and telecommunications.
If these inventories reach the scene of the disaster quickly, there is a higher chance of mitigating the damage. The rapid construction of shelters and the provision of drinking water and medical care are crucial for preventing indirect phenomena that may lead to the development of diseases and the deterioration of public health.
In recent years, several studies have been published demonstrating the validity of inventory pre-positioning due to the minimization of delivery times and costs connected to the procurement of essential goods (Richardson et al., 2010). While natural disasters do not provide prior notice, communities can nevertheless be prepared to face them through the use of this instrument (Van Wyk et al., 2011).
As reported by Balcik et al., 2016, there is a growing literature that addresses a variety of problem settings and presents mathematical models in the field of pre-disaster inventory planning and management. These models were developed to determine the location and amount of inventory to store before a sudden-onset disaster to deliver supplies to the affected areas as soon as possible.
Dekle et al. (2005) were the first to investigate the problem of facility locations for emergency interventions. They examined where to locate Disaster Recovery Centers (DRCs) that are used whenever a disaster occurs such as a Hhurricane or a terrorist attack. The authors used a standard set-covering model, in a two-stage approach to find, recommend and accept DRC locations for a single county in Florida. The main objectives were to minimize the average travel distance to a closest DRC, to minimize the maximum travel distance to a closest DRC, to minimize the total number of DRCs needed and to maximize the probability that at least one DRC will be useable following a disaster. Akkihal (2006), instead, identified optimal worldwide airport locations for warehousing non-consumable goods required for the initial deployment of aid. The aim was to identify those areas from which it is possible to reach affected territories in the shortest amount of time. The model, in fact, minimizes the average distance from a homeless person to the nearest warehouse. The most important underlying assumptions are (1) every disaster requires a response from a warehouse (its closest warehouse) and (2) warehouses always have enough inventory to satisfy the demand. Recently, Maharjan and Hanaoka (2017) determined the optimal number and locations of warehouses to be placed in Nepal for a humanitarian supply chain that would respond to sudden-onset disasters. The research study develops a modified version of the maximal covering location problem introducing additional constraints that reflect the real scenario of Nepal. The problem is solved using a simplex algorithm with branch and bound applied to the relaxed integer. However, no inventory decisions are considered in these models.
Beamon and Kotleba (2006), instead, developed a stochastic re-stocking strategy for a warehouse supporting a long-term emergency operation, considering pre-located warehouses. The authors tested their strategies in a simulation that runs over a 100-year time frame and evaluated their results using a relief-specific performance measurement system.
A model incorporating both facility location and inventory decisions is proposed by Balcik and Beamon (2008). The authors provided a model that defines the number and location of the warehouses as well as the amount that should be stocked at each warehouse with a maximal covering type of approach. Based on historical information, they create scenarios for disaster location and impact (demand) for a single event and minimize the expected response time overall scenarios.
Mete and Zabinsky (2010), instead, analysed a wide variety of potential disasters and magnitudes, and they proposed a stochastic approach for the storage location of medical supplies. The authors considered where to store medical items and inventory levels, with a focus on preparing for earthquakes in the Seattle area. They also consider the risk of stocking supplies in specific locations and the trade-off with being able to offer fast delivery after the earthquake occurs. These location and inventory decisions are taken in a two-stage stochastic model using specific disaster scenarios with demand estimates. The authors also offer an MIP transportation model that can be used in the response phase to help with routing decisions. These two models do not incorporate the possibility of inventory being destroyed and do not explicitly model shortage costs.
The model proposed by Rawls and Turnquist (2010) focused on where to store supplies and the quantities in each location for communities principally affected by hurricanes. The authors also considered the functionality of the transport network in the wake of a disaster. To find a large-scale solution to this complex problem, the authors developed a heuristic algorithm called Lagrangian L-shaped method, which they applied to the real threat of hurricanes in the USA. Gutierrez (2011) finds the optimal number and location of pre-positioning warehouses, given that demand for relief supplies can be met from both pre-positioned warehouses and suppliers. The model allows the probability of the need for each item to depend on both local conditions and the natural–hazard type. For example, the probability that a community affected by an earthquake needs hygiene kits is higher than that of a community affected by a flood. The model estimates the frequency, location and magnitude of potential demand based on historical data; it also optimizes the location of warehouses and inventory allocation, given an up-front investment in the number of warehouses to open and the amount of inventory to hold in each location. The model helped CARE to determine the desired configuration of its network and provided a roadmap of how to achieve that configuration as funds become available.
An innovative aspect was introduced by Campbell and Jones (2011). Their study quantified and localized the stocks together with an evaluation of the related costs. It also assessed the risk incurred by placing warehouses very close to areas with a high probability of experiencing an emergency scenario. The authors are the first to consider both risk and inventory levels without the use of scenarios. Most papers in this area, in fact, propose making location and inventory decisions based on minimizing some objective across a limited set of scenarios. Scenario-based approaches simplify the problem differently by reducing the potential outcomes to a very limited set.
These models were analysed and compared in Table I, according to several criteria, which are as follows: the type of disaster (natural, man-made or both); the territorial dimension considered (worldwide, national or regional); the main purpose of the paper: (1) identification of warehouse number and location, (2) the sizing of warehouse, based on the stocked relief items and (3) the quantification of inventory level for each relief item; the different typologies of goods; the applied optimization criteria: (1) response time and (2) costs; the simulation and reproduction real-time of disaster; and the damage assessment.
Comparative analysis of existing methods in the literature
| Disaster type | Territorial dimension | Warehouse number and location | Warehouse sizing | Inventory levels | Goods | Response time | Costs assessment | Disaster simulation | Damage assessment | |
|---|---|---|---|---|---|---|---|---|---|---|
| Dekle et al. (2005) | Natural or man-made disaster | Regional | YES | NO | NO | – | YES | NO | NO | NO |
| Akkihal (2006) | Natural disaster | Worldwide (airport locations) | YES | NO | NO | Non-consumable items | YES | NO | NO | NO |
| Beamon and Kotleba (2006) | Natural disaster | n.a. | NO | NO | YES | Relief items | NO | YES | NO | NO |
| Balcik and Beamon (2008) | Natural or man-made disaster | Worldwide | YES | NO | YES | Relief items | YES | YES | NO | NO |
| Mete et al. (2010) | Natural disaster | Regional | YES | NO | YES | Medical | YES | YES | NO | NO |
| Rawls and Turnquist (2010) | Natural disaster | Regional | YES | NO | YES | Emergency supplies (prepackaged meals, water and medical kits) | NO | YES | NO | YES |
| Campbell and Jones (2011) | Natural or man-made disaster | Regional | YES | NO | YES | Relief items | NO | YES | NO | YES |
| Gutierrez (2011) | Natural or man-made disaster | Worldwide | YES | NO | YES | Relief items | YES | NO | NO | NO |
| Maharjan and Hanaoka (2017) | Natural disaster | Regional | YES | NO | NO | – | YES | NO | NO | NO |
| Our model | Natural disaster | Regional | YES | YES | YES | Non-consumable goods | YES | YES | YES | YES |
It is evident that several studies have addressed the importance of the preparedness phase and the need for pre-positioned warehouses in humanitarian relief logistics, but only a small number of papers are related to the location and inventory decisions. Furthermore, no one has addressed the issue of warehouse sizing. In the existing models, the relief items to be pre-positioned are considered without evaluating the overall dimensions and technical characteristics. Regarding the criteria used to identify the optimal solution, the methods proposed in the literature aim to reduce both the response times and the costs of warehouses and intervention. However, only Balcik and Beamon (2008) and Mete (2010) considered both these criteria. Furthermore, none of the models incorporates a simulator for the real reproduction of the disaster and the damage caused to the infrastructure and the population. As seen above, most models consider a limited number of scenarios, based on historical data and information.
Finally, only Rawls and Turnquist (2010) and Campbell and Jones (2011) take into account in their models the possible destruction of the warehouses following the disaster and evaluate the damage caused both in terms of costs and lack of relief items available for the homeless.
Thus, it is evident that the evolution of this topic is significant but does not yet present the basis of a mature and consolidated field. It would be beneficial to investigate the implications of considering different problem aspects and objectives and compare the obtained results. Furthermore, tools and models to support the decision-makers in the strategic choices are needed, as well as the development of methods addressing multi-agency coordination (Leif-Magnus, 2016).
For these reasons, in this paper, a numerical approach for inventory pre-positioning in emergency management that aims to improve the existing literature is proposed, as reported in Table I and detailed in the next section.
3. A simulation model for inventory pre-positioning in humanitarian aid management
The present study provides a decision support system for the optimal quantification and location of humanitarian aid, trying to enhance and extend the existing literature on this topic.
The main purpose of this study is to develop a numerical model for defining the optimal location and sizing of warehouses and the optimal quantification of humanitarian aid (non-consumable goods) on a designated area before the occurrence of a natural disaster, in particular, an earthquake. One of the innovative aspects of the model is to consider the possible destruction of warehouses based on the location of the hypocentre and epicentre of the simulated earthquake. The model allows us to identify the best solution to minimize emergency response times and obtain a significant reduction in procurement costs by making essential goods immediately available. The proposed model, which considers the topography of the area and the risk of damage to warehouses, is validated using data obtained from two real-life earthquakes that occurred in Italy.
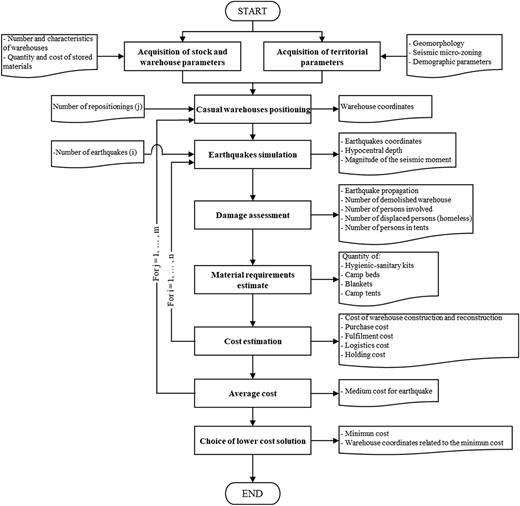
The logic of the model is shown in Figure 1. The model takes as input data the parameters of the geographical area to be analysed, the number and features of warehouses and the quantity and cost of stocks. Based on these data, the model randomly generates coordinates for positioning the warehouse. For each j-th positioning ( j = 1,.….,m), the model creates n-th earthquakes differently located. For each of these, it assesses the resulting damages in terms of people involved, and it calculates costs connected to the warehouses and storage of materials. Finally, the model quantifies the average total cost for the n earthquake for each positioning and selects the positioning with the lowest average cost. Each block of the diagram shown in Figure 1 is described in detail in the following sections.
3.1 Acquisition of territorial parameters
The first step of the numerical model is the acquisition of territorial parameters. This process allows us to assess the geomorphological, seismic and demographic aspects of the territory. The geomorphology includes: square area, and subsoil average characteristics needed to evaluate the earthquake propagation mode.
The propagation of earthquake waves depends on subsoil composition, albeit not exclusively. To simplify the complex process of propagation definition, three possible subsoil compositions—mainly rocky, mainly sandy or mainly clay—that are associated with different wave propagation speeds, Vp, are considered (Table II).
Wave propagation speed in different soil types
| Soil type | Vp [m/s] |
|---|---|
| Saturated clay | 1,500 |
| Fine and medium sand | 300 500 |
| Dense sand | 400 600 |
| Gravel | 500 750 |
| Sandstone | 1500 4500 |
| Marl | 1500 4500 |
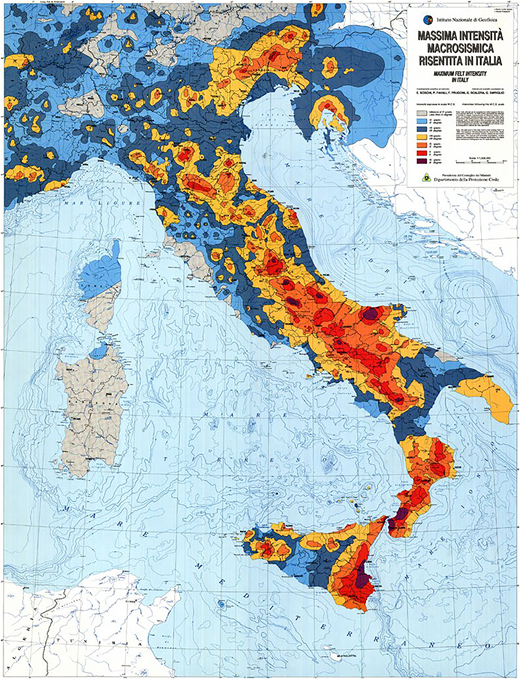
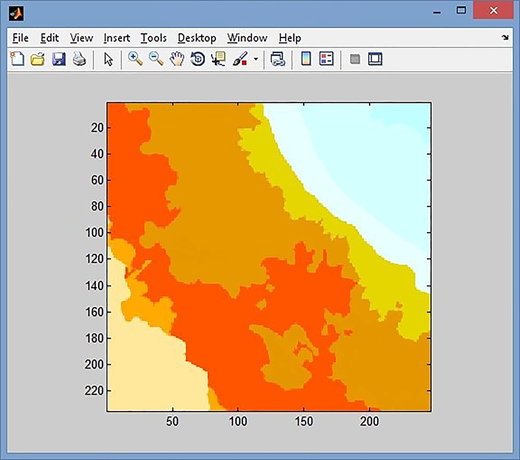
At a seismic level, the model uses micro-zoning maps that allow us to foresee the local effects of an earthquake. Seismic micro-zoning studies are aimed at streamlining knowledge of surface alterations that may be caused by seismic shaking, giving useful information for territory government, emergency design and planning and post-seismic reconstruction. These studies make it possible to highlight soil strength and stability from a seismic perspective and to identify the following different area types: stable areas, stable areas susceptible to local amplification and areas subject to instability such as landslides, surface breakages faults or dynamic soil liquefaction. An example of Italy's seismic micro-zoning map is shown in Figure 2, where the areas most subjected to instability are identified by colours tending to red.
Furthermore, demographic parameters concerning the population density are analysed and expressed as the number of residents. This value is used to estimate a hypothetical amount of people displaced by the earthquake and then to correctly identify the quantity of materials that need to be stocked.
3.2 Acquisition of stock and warehouse parameters
The other set of input data required by the model includes characteristics of warehouses and stores materials. After a careful analysis of the basic needs of the people involved in a natural disaster, the typology of materials to be stored in pre-positioned warehouses was defined. The non-perishable materials considered by the optimization model are as follows:
Hygienic sanitary kit to prevent infections and epidemics that may arise in an area affected by a natural disaster. The kit contains soap, toothbrush, toothpaste, cleaning products, antibacterial soap, sanitary napkins, shampoo, adhesive dressing, nail-clippers, towels and toilet paper. The kit contains different compartments for greater integrity and airtightness of the components.
Camp beds or cots, characterized by a resistant and straightforward structure to ensure rapid placement.
Blankets, necessary for freezing weather.
Camp tents, which contain a minimum number of 18 cap beds and all the materials described above.
For all these materials, the defined input data are the quantity to be preventively allocated in the warehouses, the unitary cost of stored materials and the volume occupied by stored materials (Table III).
Volume occupied by the stored materials
| Product | Dimensions [m] | Volume [m3] |
|---|---|---|
| Hygienic sanitary kit | 1(h) × 0.5(l) × 0.4(s) | 0.2 |
| Camp beds | 2(h) × 1(l) × 0.2(s) | 0.4 |
| Blankets | 0.05(h) × 0.5(l) × 0.5(s) | 0.01 |
| Camp tents | 2(h) × 1.5(l) × 0.5(s) | 1.5 |
It is essential to consider the volume occupied by equipment and shelves. Assuming the use of a manual warehouse with a particular seism safety standard, the estimated percentage of the total volume taken up by these facilities is 22 per cent. Furthermore, warehouse input data to be established before the simulation include the number of warehouses to be placed on the analysed area, the warehouse-size in terms of height, surface area and capacity and the maximum magnitude endurable by the warehouse without damage or demolition, which may lead to the unavailability of materials. This value depends on both construction and the correct implementation of earthquake security standards.
3.3 Casual pre-positioning
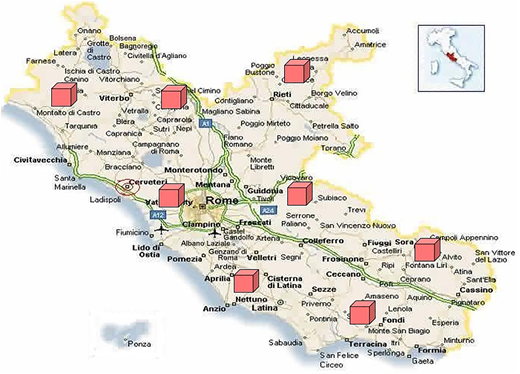
In this step, the model randomly generates coordinates for the positioning of the warehouses and provides a graphics output. To achieve this result, the model first evaluates all the water basins (seas, rivers, and lakes) and any particularly impervious area (such as mountain ranges). These are then ruled out as possible locations for inventory pre-positioning. An example of this graphics output for an area in central Italy is shown in Figure 3.
The process is repeated m times, where j = 1,…, m is the number of different positioning set by the user before the simulation. For each j-th positioning, the model generates specific coordinates to simulate different scenarios and choose the optimal warehouse location.
3.4 Earthquake simulation
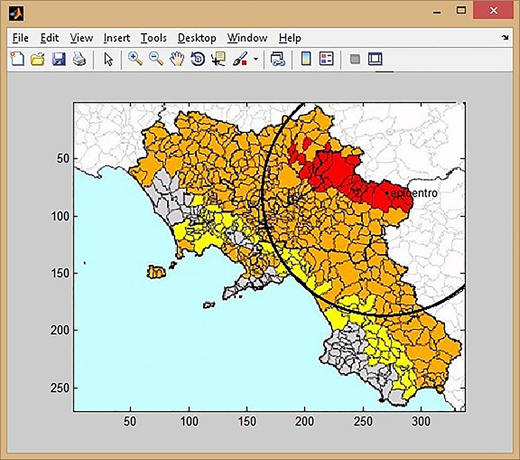
In this step, the model randomly generates the exact position of an earthquake. This includes coordinates for its epicentre and hypocentral depth, as well as an image for its magnitude and the force unleashed by the earthquake. All these values are consistent with the maximum magnitude taken from the seismic micro-zoning map.
The magnitude (M), which is used by the model for damage assessment, is expressed by the following equation:
where is the maximum value that can be perceived in the point; is the random value generated by the model and ranges between 0.1 and 1; is a scaling factor set by the user for each simulation. It represents the multiplication factor needed to adapt the input image of the analysed area to the needs of the model; is the corrective factor of the hypocentral depth. This depth is a crucial value for assessing the surface magnitude, as the two are inversely proportional.
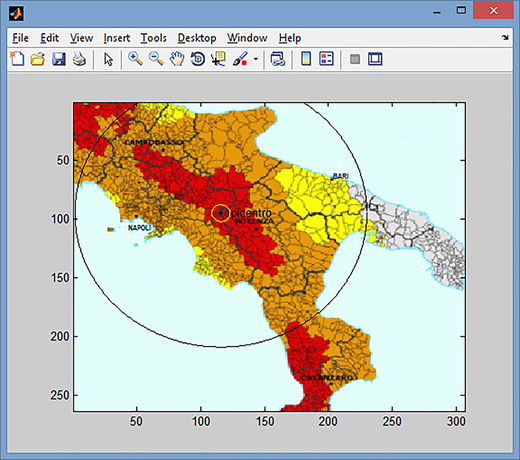
In this step, the model provides another graphic output (see Figure 4 as an example) that allows us to locate the epicentre of the earthquake and its range of propagation (ref. section 3.5).
3.5 Damage assessment
The first step of damage assessment is the evaluation of the area affected by the earthquake, quantified with the following equation:
where is the range of propagation measured in Km2 and given by
where is the propagation range used in the simulation model and it is measured in Km, while is a corrective factor that considers the level of seismic wave propagation for different subsoil types. As shown in the previous section, wave propagation speed is different depending on whether the soil is rocky, sandy or clay.
The definition of the area struck by the earthquake allows us to estimate the number of people affected, which are distinguished as number of people involved; number of displaced people and number of people in tents.
The number of people involved ( represents people that perceive the earthquake and contribute to support the entire community involved
where is the number of inhabitants of the analysed territory; is the percentage of people involved, which varies with the earthquake magnitude.
The number of displaced people ( are those who lost their houses and need accommodation in appropriate locations.
where is the percentage of displaced people.
Finally, the number of people in tents ( represents people who are housed in tents. This number is different from the number of displaced people as not all of them are accommodated in first aid fields. Some are placed in purpose-built hotels or family homes
where is the percentage of people to be accommodated in tents.
In addition to humanitarian damages, the model also calculates material losses in terms of damaged or destroyed warehouses. Destroyed warehouses, from which it is impossible to pick materials, are those who experience a seismic phenomenon of higher magnitude than the tolerable maximum.
The empirical formula used to calculate the approximate magnitude values for each warehouse is
where is the distance, measured in Km, between the warehouse and the epicentre.
3.6 Material requirements estimate
Given the number of people involved in the earthquake, the model calculates the quantity required for each item
Tents
where is the tents' minimum capacity in terms of people that can be hosted.
(2)Hygienic sanitary kit
where each kit can satisfy the needs of four people.
(3)Camp beds
where is the tents' minimum capacity in terms of beds that can be placed inside.
(4)Blankets
where is the minimum number of blankets needed by each person. This figure takes account of possible increases.
3.7 Cost estimation
The cost items used in assessing the total emergency management cost are
Warehouses construction and reconstruction cost: cost incurred to build warehouses or to rebuild them after their destruction.
where is the construction cost per square metre, is the total warehouse area in square metres and is the number of warehouses to build or rebuild.
(2)Purchase cost: cost incurred for the procurement of preventively stored materials.
where is the purchased quantity for the k-th item set as input data and is the unitary price for the k-th item.
(3)Fulfilment cost: in case, the quantity of materials stored in advance is not enough to adequately respond to an emergency, this value estimates the costs of procurement (with all the associated difficulties and without any discount) and transport necessary to restore minimum stocks.
where is the number of intact/non-damaged warehouses; is an increasing parameter for the unitary product cost. This value takes account of the fact that the purchase cost of necessities will increase during emergencies.
(4)Logistics cost: cost related to the transport of materials from the variously located warehouses to the earthquake's epicentre (considered the most affected area).
where is the Quantity transported for the k-th item which is given by
is the unitary transport cost for km; is the total transport distance.
(5)Holding cost: cost related to the storage of materials in the warehouses.
where is the unitary holding cost for the k-th item expressed as a percentage of the purchasing cost.
3.8 Average cost and choosing the lower cost solution
It is clear that each earthquake, being randomly generated and defined by different parameters, will cause different damages and hence generate different costs. For this reason and in order to mitigate the randomness of the seismic events, the model will calculate the average total cost after the simulation of n earthquakes as
This value is essential to analyse the inventory pre-positioning to define the optimal number of warehouses and their location (i.e. their coordinates on the territory) in order to minimize this average total cost.
4. Calibration of parameters and model validation
The Italian peninsula is historically characterized by high seismic and volcanic risk, making it the theatre of several natural disasters. For the last 25 years, data from the Department of Civil Protection estimate about 120,000 victims and an economic loss of 75 billion Euros for post-disaster recovery and reconstruction. Two of the worst Italian earthquakes (November 1980 in the Southern Region of Irpinia and April 2009 in the central City of L'Aquila) were chosen to calibrate the necessary parameters and validate the model.
4.1 Calibration of model parameters-earthquake in Irpinia (1980)
On 23 November 1980, an earthquake measuring 6.9 degrees on the Richter scale struck the region of Irpinia, in particular, the provinces of Avellino, Potenza and Salerno, leading to 2,914 deaths, 8,848 severe injuries and about 280,000 displaced people (CFTI, 1980). This event was taken as the first reference for the calibration of the model, considering the input data reported in Table IV. Furthermore, the following parameters were calibrated:
, a corrective factor of hypocentral depth. As shown in Table V, the model uses different corrective factors to modulate the magnitude experienced on the surface, which is decreasing with the hypocentral depth, up to a maximum depth of 50 Km
, a corrective factor for seismic wave propagation. As shown in Table VI, this propagation speed is different depending on whether the soil is mainly rocky, sandy or clay
, percentage of people involved in the earthquake
, percentage of displaced people
, percentage of people accommodated in tents
Corrective factors adopted for the different hypocentral depths
| Hypocentral depth [km] | |
|---|---|
| 0–7 | 0.99 |
| 8–18 | 0.98 |
| 9–25 | 0.97 |
| 26–33 | 0.95 |
| 34–42 | 0.94 |
| 43–50 | 0.93 |
Corrective factor for seismic wave propagation on varying subsoil characteristics
| Subsoil average characteristics | Propagation corrective factor |
|---|---|
| Mainly rocky | 0.95 |
| Mainly sandy | 0.86 |
| Mainly clay | 0.90 |
Input data for the validation on the Irpinia earthquake
| Input data | Value |
|---|---|
| Square area [km2] | 27,223 |
| Number of residents | 6,602,700 |
| Subsoil average characteristics | Mainly rocky |
| Number of earthquakes | 1 |
The three above-mentioned percentage parameters, , and , were obtained from historical data by examining the relationship between seismic magnitude and the number of affected people (Table VII). While the percentage of involved people exponentially increases with magnitude, the percentage of people to be accommodated in tents remains almost constant. For the number of displaced people, the historical data were updated to take account of the better anti-seismic housing built in recent years, resulting in a lower percentage.
Parameters used to estimate the percentage of involved people
| Magnitude (M) | |||
|---|---|---|---|
| <1.7 | 0 | 0 | 0 |
| 1.8–2.5 | 0 | 0 | 0 |
| 2.6–3 | 0.003 | 0 | 0 |
| 3.1–3.5 | 0.03 | 0.0005 | 0.37 |
| 3.6–3.9 | 0.07 | 0.001 | 0.37 |
| 4.0–4.3 | 0.19 | 0.008 | 0.37 |
| 4.4–5 | 0.29 | 0.012 | 0.37 |
| 5.1–5.3 | 0.35 | 0.018 | 0.37 |
| 5.4–5.7 | 0.47 | 0.028 | 0.37 |
| 5.8–6 | 0.56 | 0.034 | 0.37 |
| 6.1–6.3 | 0.65 | 0.053 | 0.37 |
| 6.4–6.7 | 0.72 | 0.055 | 0.37 |
| 6.8–7 | 0.78 | 0.057 | 0.37 |
| 7.1–7.3 | 0.82 | 0.060 | 0.37 |
| 7.4–8 | 0.88 | 0.065 | 0.37 |
| 8.1–10 | 0.93 | 0.073 | 0.37 |
Our model reproduced this event using this set of parameters, and the graphical display of the superficial extension was obtained (Figure 5).
The comparison between real and simulated data (Table VIII) shows that the simulation model is adherent to the real event since the absolute value of the error is always lower than 7 per cent.
4.2 Validation of the model-earthquake in L'Aquila (2009)
The seismic event in L'Aquila (central Italy) consisted of a series of ongoing earthquakes that began in December 2008. The main quake, measuring 6.3 degrees on the Richter scale, occurred in April 2009, leading to 309 deaths, more than 1,500 injured and over ten billion Euros in estimated damages (Boschi et al., 2009). This real case, using the input data in Table IX, is used to validate the model via the following two steps: check that the model provides data that are sufficiently accurate and representative of the real event, in terms of seismic magnitude and propagation and prove that the costs incurred for the management of the event are considerably higher than those linked to the adoption of a humanitarian inventory pre-positioning plan.
Input data for the validation on the L'Aquila earthquake
| Input data | Value |
|---|---|
| Square Area [km2] | 20,832 |
| Number of residents | 1,732,689 |
| Subsoil average characteristics | Mainly rocky |
| Number of earthquakes | 1 |
In this case, the deviation from the real case is higher (Table X). However, the mean absolute error is still under 10 per cent, confirming the accuracy of the model. Output data from the inventory pre-positioning model are reported in Table XI. Without inventory pre-positioning, the estimated cost of the emergency management, intended as a fulfilment cost, is 5,267,965 €, almost 73 per cent higher than in the previous case.
Comparative table of real case data with simulation output for the L'Aquila earthquake
| Parameter | Real case value | Simulated value | % Error |
|---|---|---|---|
| RRp [km2] | 10,000 | 11613.4 | 16% |
| NPC | 1,000,000 | 1,126,248 | 13% |
| NS | 60,000 | 59,691 | −1% |
| NPT | 21,467 | 22,086 | 6% |
Model output data for the L'Aquila earthquake simulation
| Parameter | Value |
|---|---|
| No. of warehouses | 4 |
| No. of hygienic kits | 1,000 |
| Kits unitary cost | 18 € |
| No. of beds | 2,875 |
| Beds unitary cost | 16 € |
| No. of blankets | 3,125 € |
| Blankets unitary cost | 0.35 € |
| No. of tents | 188 |
| Tents unitary cost | 800 € |
| Max magnitude endurable by the warehouse | 6 |
| Warehouse area | 135 m2 |
| Warehouse cost per unit Area | 150 €/m2 |
| Construction cost CC | 86,400 € |
| Purchase cost CP | 861,975 € |
| Fulfilment cost CF | 1,821,602 € |
| Logistics cost CL | 67,662 € |
| Holding cost CH | 215,494 € |
| Total cost | 3,047,734 € |
5. Simulation results
As previously described, the main aim of the proposed simulation model is to define the optimal number of warehouses to be pre-positioned in the area, their geographic coordinates and the appropriate level of stock to guarantee the lowest average cost of the humanitarian emergency response.
The real case used for the simulation (L'Aquila earthquake in 2009) is the same used for the validation process and is one of the worst natural disasters to have occurred in Italy during the last 10 years. The simulation and optimization process includes 50 seismic events (i = 50) and 10 re-positioning (j = 10). The experimental case was conducted following three steps:
definition of the optimal stock for all items. This allows us to meet the entire collective demand caused by the natural disaster, with no accompanying increase in purchasing and storage costs;
definition of the optimal number of warehouses. On the one hand, fewer warehouses with high capacity involve higher collapse risks, since the inventory is mainly located in a single area; on the other, more warehouses with lower inventory involve higher fixed construction costs;
identification of the optimal inventory pre-positioning, which is associated with the lowest average cost.
5.1 Definition of the optimal stock
Using input data reported in Table IX and the seismic micro-zoning map shown in Figure 6, the experimental plan for the definition of optimal stock levels for all the items described previously was defined.
The experimental plan involves five different warehouse configurations—3, 4, 5, 6 or 7 warehouses located in the area—and five different configurations of stored material, as shown in Table XII. The entire plan entails 55 experiments.
Comparative table of real case data with simulation output for the L'Aquila earthquake
| Pre-stored quantity | |||||
|---|---|---|---|---|---|
| Item | Q1 | Q2 | Q3 | Q4 | Q5 |
| Hygienic sanitary kit | 1,000 | 4000 | 5,000 | 7,150 | 10,000 |
| Camp beds | 2000 | 11,500 | 19,000 | 23,760 | 27,000 |
| Blankets | 3,500 | 12,500 | 20,500 | 26,000 | 30,000 |
| Tents | 200 | 750 | 1,100 | 1,600 | 2,300 |
The quantities reported in Table XII refer to the entire pre-positioned stock. They will hence be equally shared between the warehouses. At this point, given the volume occupied by each item, we can define the dimensions of the warehouses in terms of warehouse area and volumetric occupancy index (Table XIII).
Warehouses characteristics used for the experimental plan
| Pre-stored quantity | Number of warehouse | |||||||||
|---|---|---|---|---|---|---|---|---|---|---|
| 3 | 4 | 5 | 6 | 7 | ||||||
| Aw m2 | VI | Aw m2 | VI | Aw m2 | VI | Aw m2 | VI | Aw m2 | VI | |
| Q1 | 116 | 99% | 88 | 98% | 70 | 98% | 58 | 99% | 50 | 99% |
| Q2 | 580 | 98% | 430 | 99% | 350 | 98% | 390 | 98% | 250 | 98% |
| Q3 | 900 | 99% | 680 | 99% | 550 | 98% | 450 | 99% | 390 | 99% |
| Q4 | 1,200 | 99% | 900 | 98% | 710 | 99% | 600 | 98% | 510 | 98% |
| Q5 | 1,450 | 98% | 1,100 | 97% | 860 | 99% | 720 | 99% | 620 | 98% |
Note(s): Aw = warehouse area; VI = volumetric occupancy index
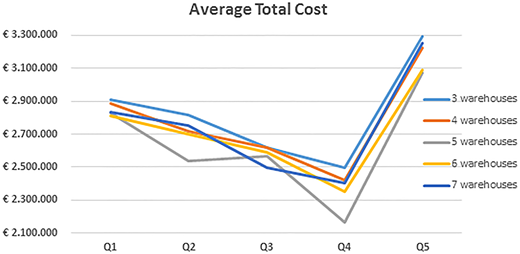
Figure 7 clearly shows that the optimal stock quantity is Q4 for all warehouses configurations. The first three quantities (Q1, Q2 and Q3) are not enough to satisfy the collective needs, so extremely variable and high fulfilment costs will incur. Conversely, stock quantity Q5 is excessive, resulting in high purchasing and holding costs for unnecessary materials.
5.2 Definition of the optimal number of warehouses
Defined Q4 as the optimal stock quantity, the following graph (Figure 8) shows the average total costs for different numbers of warehouses pre-positioned on the territory.
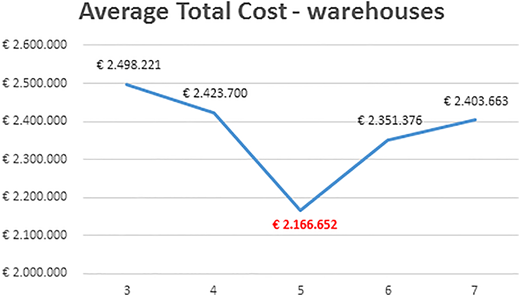
It is evident that the optimal number of warehouses is 5. In other instances, especially with 3 or 7 warehouses, the total costs are considerably higher. The analysis of the phenomenon shows that with few warehouses, the potential destruction of one or more warehouses may cause the unavailability of a large number of materials resulting in high costs for both reconstruction and the external supply required to meet basic needs; whereas with more warehouses, construction costs will obviously be higher.
Moreover, the probability of positioning a warehouse very close to the seism epicentre will increase and with it the probability of demolition. It is also necessary to consider that the selection of materials located in very different areas will significantly delay rescue and assistance operations and will increase logistics costs.
5.3 Definition of the optimal inventory pre-positioning
The last step of the simulation is to find the optimal location of the warehouses. This result is obtained graphically, as shown in Figure 9. It is clear from the graph that warehouses 1 and 3 are located in areas with higher seismic risk. Despite a higher demolition risk, their intervention time and logistics costs will hence be lower. Warehouses 2 and 5, conversely, fully cover the central part of the area providing support for the other two warehouses.
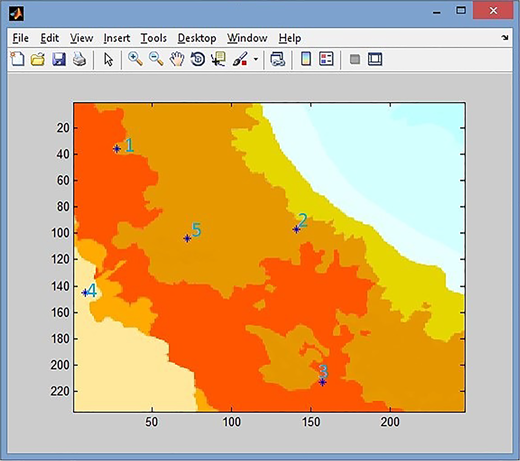
Finally, warehouse number 4 is located in a low seismic risk area. It is almost certain that it will remain intact after the earthquake, meaning the stored material can be used for humanitarian aid.
5.4 Analysis of item costs
Another interesting result concerns the analysis of the item costs, which affect the average total cost of emergency management. Figure 10 underlines that when the stored quantity is not optimized (Q2), i.e. the stored items are not sufficient to meet the population's needs, fulfilment costs constitute the majority of the total cost. In this instance, warehouse costs are less than 30 per cent of the total. The situation is reversed, however, when the optimal condition (Q4) is reached, with logistics and holding costs kept to a minimum.
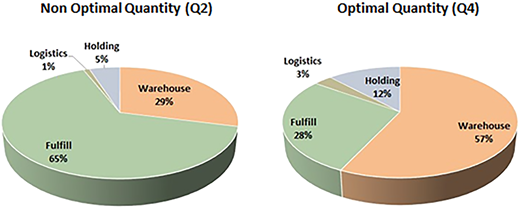
Comparison of incidence percentage on average total cost between optimal and non-optimal quantities
Comparison of incidence percentage on average total cost between optimal and non-optimal quantities
6. Discussions and conclusions
The decision support system presented in this paper involves a numerical model for inventory pre-positioning for seismic events.
By examining the characteristics of the territory and the affected population, the model allows us to define the optimal stock levels for four basic need items—hygienic sanitary kits, beds, blankets and camp tents—to be pre-allocated in the territory. The relief items are not considered as a general class of non-consumable goods but identified individually to consider the dimensional and volumetric characteristics of each in the warehouse sizing. In fact, the pre-positioning decisions taken with the proposed model are the number and location of the facilities and also the optimal sizing of warehouses, innovative aspect compared to existing models. The model is generalizable and allows users to modify the list of emergency items to be stored based on the considered case study.
The proposed model is not based on sets of pre-defined disaster scenarios, as reported in the majority of existing studies, but it reproduces the occurrence and propagation of an earthquake, considering numerous possible epicentres, to simulate the real behaviour of the disaster. For each simulated earthquake, the model calculates and assesses the level of damage inflicted on the population and the warehouses (partial or integral destruction) and quantifies the relative costs, also including the reconstruction costs and the fulfilment costs.
The numerical model, developed using Matlab software, was calibrated and validated using data obtained from two real cases: the earthquakes of Irpinia in 1980 and L'Aquila in 2009. These are considered to be the two worst seismic events that affected Italy in the last 40 years. The calibration was intended to define suitable values for set parameters. The validation process aims to show to what extent the simulated outputs differ from the real case data and to assess the economic benefits of adopting inventory pre-positioning.
L'Aquila case was used for both the model simulation and the optimization of the results. The defined experimental plan was used to define the optimal quantity to be pre-stored in the territory, the optimal number of warehouses and the optimal positioning of these warehouses. The model highlights cost reductions in terms of purchase, storage, transport and fulfilment of requirements.
Therefore, the model aims to increase and improve effectiveness in pre-positioning inventory choices and decisions to provide an adequate level of service and aid for homeless. In the humanitarian logistics, it is necessary to develop models that can represent in the most realistic way the occurrence and spread of a catastrophic event to provide useful and supportive results in decision-making choices, especially in high-risk areas such as Italy. Considering the often limited availability of funds dedicated to pre-disaster interventions, the model allows the governments and institutions to assess quickly and with a limited expenditure of resources the positioning and sizing of warehouses at minimum cost and with the maximum level of help for the population. For example, the model can guide civil protection department in the choice of emergency facility locations in order to quickly intervene at lower cost.
However, the model has some limitations. First of all, it does not allow the assessment of emergency response times as the road network is not integrated into the model. The basic assumption in the choice of optimal locations is made considering the linear distance between the areas affected by the earthquake and the warehouse. Furthermore, in the model, the evaluation of damages in terms of number of people is based on the national average density. To increase the capacity and expand the potential application of the model, future work will include an in-depth analysis of the road network and a better assessment of the injured persons with respect to the population density relative to the specific region. A further limitation is linked to the possibility of including only non-consumable and non-perishable goods in the model. Further development should include consumable items within the model.
The model currently evaluates the distance between the seism epicentre and the warehouses in a straight line. By incorporating the actual road network into the model, it will be possible to identify the shortest path by which to supply the most affected area.
Furthermore, the developed model could be applied for the analysis of other natural disasters. A simple code changes will allow us to use the inventory pre-positioning model for tsunami since they have similar characteristics to earthquakes. This would require that we pay particular attention to the warehouse allocation process, which would exclude areas near to the affected coast. For other natural disasters, more in-depth studies are required.
