


This research was performed with the aim of determining if the emptying of latrines in a flood‐prone urban slum area would be a sustainable and profitable business for private‐sector service providers.
Monte‐Carlo analysis was used to evaluate the economic sustainability of a proposed public‐private waste transportation service. A GIS‐assisted route analysis was also performed, with participation by private and public sector stakeholders.
The analysis also showed that if a low‐cost subscription service is implemented in the area, the commercial service providers will operate at a loss in all cases, unless changes are made in the truck fuel efficiency, the operating hours of discharge sites, and the transportation network.
The research was based on service provider operations costs extrapolated from previous studies and updated through informal interviews. A thorough and transparent review of cost accounting procedures is necessary to validate the results.
This study identified challenges and potential solutions which must be addressed by practitioners in order to ensure success of a subscription‐based service.
This study adds to the existing literature by demonstrating the applicability of an analytic modeling technique based on Monte‐Carlo simulation and provides an example of how academic research can be tightly coupled with practitioner needs in order to have a direct impact on operational humanitarian projects.
1. Introduction
According to the World Health Organization, diseases related to water, sanitation and hygiene (WASH) account for 4 percent of deaths worldwide (Prüss et al., 2002) and to a large extent, the infectious diseases caused by contaminated water and poor sanitation are highly preventable. An issue of particular interest in this paper is the lack of proper sanitation in the informal settlements that surround many large cities in the global south. Since most of these areas lack sewer systems and robust infrastructure, they rely on commercial or government services to remove the sludge accumulated at the bottom of latrine septic tanks. Within this context, several questions arise. How can desludging be optimized and performed in cost‐effective ways? Is it possible for private desludging services to be both affordable to the population as well as profitable for private enterprise? How can public awareness of these sanitation issues be improved in an environment of very limited resources and competing priorities? This paper examines possible answers to these questions in the context of Pikine, Senegal.
1.1 Overview of context
Pikine, a city near Dakar, Senegal in West Africa, is an urban area consisting of both planned areas with modern water and sanitation systems and informal settlements without even basic infrastructure in place. The original communes of Pikine were well planned; however, as Pikine expanded, irregular settlements were built in areas that historically were considered unfit for construction due to the poor sandy soil and the level of the water table, which is very near the surface in some areas. Pikine is subdivided into 16 administrative areas or “Communes d’Arrondissements,” and each has both planned and informal areas which are co‐mingled.
Part of the population growth in Pikine was due to migration of poor rural farmers into the city during the 1980s as Senegal experienced drought (Mbow et al., 2008). However, as rains returned in the late 1990s and early 2000s, the lower lying regions of Pikine began to flood and now the water table is fully saturated (and polluted) and severe annual flooding occurred in both 2009 and 2010.
1.2 Research problem
Following their flood response in 2010, the Bill and Melinda Gates Foundation funded Oxfam America and its local partner Eau, Vie et Environnement (EVE) for a follow‐on recovery and rehabilitation project which included improvements to the household‐level latrines that were the most impacted by the floods of 2010. One of the first steps in the latrine rehabilitation project was the desludging of the latrines to remove the flood water and accumulated solid waste. During this activity, some of the difficulties with the desludging service provision became apparent as both delays and broken contracts with desludging service providers had a significant impact on the project.
Since then, the Gates Foundation has initiated a new sanitation project with the Government of Senegal with the goal of reducing the practice of manual desludging by 90 percent by the end of the three‐year project. Two of the project's financial objectives seemed difficult to achieve in unison: maximum annual household price of the desludging service of 5,000‐10,000 FCFA (approximately US$10‐$20); and profit margin of at least 20 percent realized by the private sector (including revenues from both the desludging service and sludge reuse).
The analysis presented in this paper investigates the potential profitability of a mechanical desludging service in the Pikine communes included in the Oxfam/EVE project and was based on informal interviews and empirical data gathered over several months in Senegal during the 2010 flood response and the 2011 rehabilitation project and subsequent modeling and probabilistic simulation of various desludging operations alternatives that rely on the collected data and interviews.
1.3 Issues with current system
The context in Pikine is complex and several issues were encountered during the Oxfam/EVE latrine rehabilitation project in Pikine that must be addressed as part of any large‐scale project:
- (1)
Technical issues: the household‐level latrines in Pikine have septic tanks that must be emptied one to two times per year during nominal operations, but in areas subject to flooding, the tanks can fill up much quicker and desludging must be performed more frequently. Based on the first “Knowledge, Attitudes and Practices” survey conducted by Oxfam/EVE during the 2010 floods, while 96 percent of households in Pikine had access to latrines, only 39 percent of those were functioning properly (EVE, 2010).
- (2)
Logistical issues: there are many logistical issues which will complicate a desludging program for Pikine:
Many of the targeted neighborhoods are only accessible to small 3‐4 m3 tanker trucks, requiring several trips to fully empty a 9‐10 m3 tank. This creates one of two main problems. If the smaller tanker only visits the house once and takes away 3 m3 of water, no actual “desludging” takes place and the health risk remains. However, if the goal is to empty and desludge the tank entirely, then multiple trips would be required, which could slow the service and increase cost to individual residents.
The three legal waste treatment facilities in the Dakar region are located between 5 and 9 km from Pikine and the fuel requirements are high due to the distance and especially the travel time due to extensive traffic congestion problems in the area. The private‐sector desludging service providers charge by the rotation (round‐trip) between the latrine they are emptying and the discharge site. Due to the access difficulties in Pikine, the time to complete a rotation can be long (45 minutes to two hours, depending on traffic) and this reduces the number of rotations in a day and the associated profitability. In addition, the sites are only open from 9 a.m. to 4 p.m. Monday to Thursday and from 9 a.m. to 1:30 p.m. on Friday and are closed for the weekend (EVE, 2011a).
- (3)
Economic issues: there are two main economic issues that may inhibit successful implementation of a desludging service in Pikine:
First, while the average fee for a single‐use of the larger tankers of approximately $65 is not exceptionally high, it constitutes between 30 and 100 percent of the monthly household income for the residents of Pikine (EVE, 2010). Based on preliminary studies leading up to the 2012 Gates project, the team found that a tariff of between $10 and $20 per year would be the amount that targeted populations would be willing to pay for a subscription desludging service (Bill and Melinda Gates Foundation, 2011).
In Pikine, the total fuel used per rotation is higher than in other areas due to the time and distance required to travel between the houses and the discharge stations and the additional time required to find the houses within the neighborhoods. In addition, due to the poor conditions of the roads and the fact that the latrines often contain trash (e.g. plastic bags) which can damage the pumps, the maintenance and repair costs would likely be higher than in other more “regular” areas. For these and other reasons, during the Oxfam/EVE rehabilitation project, many private‐sector companies would work for one to two days and then cancel the contract, claiming that their costs were higher than the $50‐$60 per rotation rate that they were being paid (EVE, 2011a).
Another socio‐economic factor that must be considered is the role and impact of the informal manual desludgers (called “Baye Pell” in Senegal) in the overall service scheme. The Baye Pell, who manually empty the septic tanks using shovels and buckets and bury the fecal sludge in the concession or in the street, are used extensively in Pikine, and since their price is much less than the formal desludging service providers, they will serve as competition to the mechanical desludging subscription service, unless the government strictly limits this practice.
- (4)
Cultural issues: cultural preference with regards to latrine placement, convenience, privacy, and appearance dictate the design of the latrine and can make the logistics of desludging much more difficult. In addition, many desludging service providers refuse to use the official discharge sites even when they could afford it and some routinely empty the latrine contents into the rain water network instead of the sewage network (Massaga, 2011).
2. Methodology
After gaining insight into the issues, stakeholders and economic conditions in the Pikine area, a literature review was performed to understand what type of research and projects had been done previously to address the sanitation problem. Several organizations have performed previous studies in this area, most notably the “Centre Régional pour l’Eau Potable et l’Assainissement (CREPA),” ENDA GRAF Sahel, and the SANDEC group of EAWAG (Swiss Federal Institute of Aquatic Science and Technology). In addition to the publicly available reports, two unpublished reports from EVE were used extensively in the research, and many informal interviews were conducted with stakeholders. Following this, analysis was performed to understand the Pikine desludging service network, to determine service provider operating procedures and costs, to create an analysis tool to calculate the profitability of the current desludging service and to determine ways to increase the profitability while decreasing the subscription price.
2.1 Desludging service network map
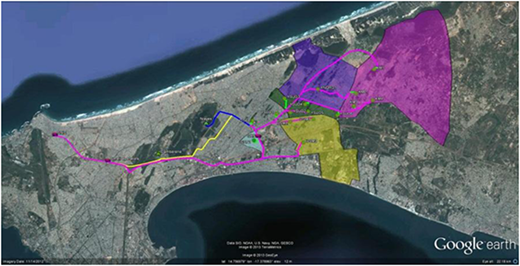
In order to calculate the relative distances between the targeted households, the discharge sites and the desludging service providers, a detailed service network map was developed. Since the road network for the Pikine area is not well defined and most operators use secondary roads to get to the discharge sites and into the informal settlement areas, Google Earth was used to determine the route distances with help from the truck operators. First, the GPS coordinates for the households were recorded on a handheld Garmin unit and imported and then the key landmarks, roads and facilities were identified visually and the routes between them identified by the truck drivers.
As shown in Plate 1, the key elements of the desludging service network map are the administrative commune borders, coordinates of the households, service provider truck depot locations, discharge station locations, and the routes between all these points.
Five of the 16 administrative communes in the City of Pikine were used for this study and they include Keur Massar (KM), Guinaw Rails Nord (GRN), Yeumbeul Nord (YNORD), Yeumbeul Sud (YSUD), and Dimaguène‐Sicap Mbao (DSM). The communes were chosen due to the availability of the commune‐level demographic data that was gathered during the response and rehabilitation phases (EVE, 2010, 2011b).
In order to identify routes to be used in the analysis, 150 household GPS coordinates were recorded and then grouped into clusters based on their location and then the geographic midpoint of each cluster was calculated. This became the “representative household” coordinate that was used to calculate the distance between key points. A total of 16 representative households were identified using this method.
For the purposes of this analysis, the locations of three representative desludging service providers were chosen. These three providers represent the three main types of organizations active in the Pikine desludging market: the larger formal private sector companies that generally work on the larger government contracts (the location of the Société de Nettoiement Industriel et Chimique (SNIC) which was used as an example in this analysis); the small informal one‐truck operators that congregate at the main highway intersection near Dakar's Stadium; and the municipal government operators that provide service in their locality at a reduced price (the location of the Mayor's office in GRN was used as a reference location).
Currently, there are three legal waste discharge stations in Dakar: Cambérène, Niayes, and Rufisque. While all three locations are open for waste discharge, most service providers use the station at Niayes to avoid major congestion near the Rufisque site. Therefore, for this analysis, only the Niayes station was used.
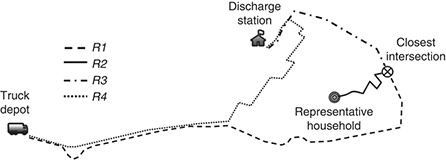
Once all of the key points were identified in the Pikine desludging service network map, the routes between the points were identified through conversations with service managers and truck drivers and then the path lengths (in km) were automatically calculated in Google Earth. For the simulation model presented in Section 2.2, four key routes were found, as illustrated in Figure 1.
2.2 Desludging service simulation model
Given the high degree of variability in the travel times between the various locations in the Pikine desludging service network map and the desire to understand the average profitability for the commercial desludgers as well as the variance in profit margin, a Monte Carlo method was chosen for the analysis. A Monte Carlo simulation uses a set of randomly generated numbers as input variables into a deterministic model, and then records the outcome for all iterations as the model cycles through 1,000+ runs, or sets of random inputs. This method was also easy to implement in Microsoft Excel, which was seen as beneficial for stakeholder acceptance in Pikine since they already use Excel in their daily business and there would be no additional cost for software.
During the simulation, the desludging service simulation model begins by randomly choosing a representative household from the available list and then schedules a single truck to travel to that household, pump the contents of the latrine, travel to the discharging station, discharge the tanker contents, and then return back to the same household or neighborhood, depending on whether the goal is to either partially or fully empty the latrine tank. The location of the household, the volume of the latrine pit, the time to fill or empty the tanker, the waiting time at the household and discharge station and the road travel time for each segment are chosen randomly based on a range of expected values gathered from empirical research and expert opinion from interviews with stakeholders in Pikine. For the purposes of the analysis, it was assumed that all of the input distributions were uniform and calculated through the use of the randbetween function in Excel, based on minimum and maximum expected values.
Based on this output, the model calculates the amount of time it takes to do a single rotation, how much sludge is pumped, the distance traveled, the time of the last discharge, the average tank volume, and the total job time. These values are recorded for each run (representing one working day) and the model is run to obtain averages based on 100 runs of 260 working days per year (26,000 runs in total). Once these runs are complete, the data are imported into a separate spreadsheet and the model calculates the net profit and profit margin and builds data tables and charts for average values and the range of values over a five‐year sample.
Input data for the desludging service simulation model came from a variety of sources including published reports, internal Oxfam/EVE reports, empirical data gathered in the field in November 2010 and July 2011, and informal interviews with stakeholders. When data were not available assumptions were made on the minimum and maximum expected values and random numbers were generated in the Monte Carlo simulation between these two values.
The required parameters and model formulation are as follows:
Parameters
R1=distance of route between closest intersection to representative household and depot (km);
R2=distance of route between closest intersection and representative household (km);
R3=distance of route between closest intersection and discharge station (km);
R4=distance of route between depot and discharge station (km);
MaxSpeedHwy=maximum speed of desludging trucks on highway (km/hour);
MinSpeedHwy=maximum speed of desludging trucks on highway (km/hour);
MaxSpeedHH=maximum speed of desludging trucks on highway (km/hour);
MinSpeedHH=maximum speed of desludging trucks on highway (km/hour);
TruckSize=size of desludging truck (m3);
PitSize=size of latrine pit=randbetween (5, 14) m3;
PumpRate=rate at which sludge is pumped from latrine pit (m3/hour); and
DischargeRate=rate at which sludge is emptied from desludging truck (m3/hour).
Model formulation
The rotation time Ttotal (in minutes) is calculated as follows:
where TR1 is the randbetween (R1/MaxSpeedHwy, R1/MinSpeedHwy); TR2a is the randbetween (R2/MaxSpeedHH, R2/MinSpeedHH); Tprep is the randbetween (5, 30) for the first visit, and is the randbetween (5, 15) for subsequent visits; Tpump is the minimum (TruckSize, PitSize)/PumpRate; TR2b is the randbetween (R2/MaxSpeedHH, R2/MinSpeedHH); TR3a is the randbetween (R3/MaxSpeedHwy, R3/MinSpeedHwy); Twait is the randbetween (5, 15); Tdischarge is the round (TruckSize/DischargeRate); TR3b is the randbetween (R3/MaxSpeedHwy, R3/MinSpeedHwy); TR4 is the randbetween (R4/MaxSpeedHwy, R4/MinSpeedHwy). Note that TR3b the 0 for the last rotation; TR4 the 0 for all rotations except the last rotation.
2.3 Case studies
In order to understand how the Pikine desludging service system behaves over a range of possible scenarios, three case studies with two variants were created. There were two main differentiators in the cases: first, whether the tank was only emptied to the capacity of the single tanker or whether it was completely emptied, potentially requiring multiple trips; and second, whether the operator was a small informal enterprise, a larger formal enterprise, or a municipal government/commune. This yields six primary cases, as shown in Table I.
3. Results
3.1 Case 1
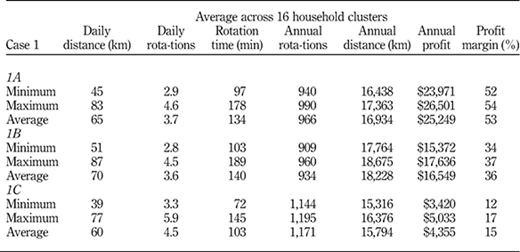
In Case 1, each operator is assumed to fill up their tanker truck to its capacity (or to the volume of the tank in the event that the tank is smaller than the tanker) and then drive to the discharge site (Niayes) to discharge the contents. When the operator returns to Pikine, they go back to the same neighborhood, but choose a different house. Therefore, each customer gets one rotation regardless of the size of their latrine tank, and revenues are accumulated based on a fixed price per rotation (e.g. $50 for a 6 m3 tanker). This assumption matches the current modus operandi in Pikine, and has significant impacts on the quality of service since the average latrine tank size in Pikine is 9.5 m3 and the largest tanker truck size is limited to 6 m3 due to access constraints. Table II shows the tabularized results for Case 1 for the three variants.
Case 1A represents the most common form of service provision in Pikine where small independent operators pump out a truckload of sludge/effluent for individual households on a service‐on‐demand basis. A 6 m3 truck size was assumed in the analysis since many of the Pikine neighborhoods are not accessible by larger trucks.
For Case 1A, an average of 3.7 rotations was completed each day, which is consistent with previous studies (CREPA, 2002). This average is across all 16 of the household clusters identified in the Pikine desludging network map (see Section 2.1), and since some communes are further away from the depot and Niayes station than others, fewer rotations can be done for those areas. The impact of household distance from the depot and discharge station is also evident in the daily distance and rotation time result. Since the “desludging” service in Case 1 only empties the tank to the capacity of the truck, only 63.2 percent of the tank volume was pumped out on average. This could cause significant public health concerns, especially during flooding.
On average, the profit margin obtained by the small operators was 53 percent assuming a standard price of 25,000 FCFA ($25) per rotation for a 6 m3 truck and one driver plus two additional manual laborers on every truck. The profit margin percentage is calculated as ((Revenues−Costs)/Revenues×100). The main reason why this profit margin is so high is that the informal operators pay no taxes on revenue, have no office or office staff to drive up their overhead costs, and they operate with older used trucks, so their monthly payments on equipment is relatively low.
In Case 1B, the operator is assumed to be a medium size enterprise that is located near the Yoff airport in Dakar. For the medium formal operator, it was assumed that they had operations costs much larger than informal operators (CREPA, 2002). The distance between the truck depot and the Pikine neighborhoods is also greater; however, this was not a major factor in the results as it only affected the first segment of the day.
As shown in Table II, the averages for total distance, number of rotations, and rotation time for Case 1B are not significantly different than in Case 1A. However, the profit margin for the larger formal operator is significantly less than that of the informal operator due to the higher operating costs.
In Case 1C, the location of the truck depot was changed to the Mayor's office in GRN, which owns a 3 m3 truck that was used extensively in the Oxfam/EVE latrine rehabilitation project. Since the Mayor's office is publicly owned, some of the office costs are covered separately, and truck amortization is not added.
The Case 1C results shown in Table I are as expected. Due to the closer distance between the depot and the representative households, the average total distance traveled in a day is 60 km and since it takes less time to complete a rotation, more rotations can be done in a day on average. In the model, the tanker only removes 3 m3 of scum/effluent from each latrine per rotation so the total sludge pumped is only 31.6 percent of the total tank volume on average, so it may be necessary to increase the frequency of desludging. Based on the assumptions used for the operating expenses of the GRN service, the average profit margin is 15.1 percent, which is sufficient for the public model.
3.2 Case 2
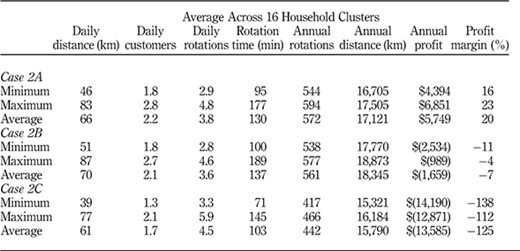
The main difference between Case 1 and Case 2 is the degree to which the desludging service providers actually empty the septic tank. In Case 1, one truckload of sludge/effluent was pumped, even if the volume of the latrine tank was larger than the truck volume. In Case 2, the desludging service provider is forced to empty the entire pit, regardless of whether the job takes one rotation or four, and they are paid the same amount regardless of the number of trips. Obviously, this has a significant impact on the profitability of the service as shown in Table III.
Case 2A models a small informal operator that is based in the truck depot near the Dakar Stadium. As shown in Table III, the total distance traveled and the average number of rotations completed in a day is close to the result in Case 1A, but the number of customers, which is the basis upon which the revenues are based, is much lower than the number of rotations. The number of customers served in a day depends on the size of the tank, the size of the truck, and on the traffic conditions between the nodes in the network map.
When the average annual profit margin is computed for Case 2A, the results show a decrease in profits by more than half as compared to Case 1A. This is due primarily to the fact that, in Case 1A, one trip per household is completed and in Case 2A, multiple trips may be required to fully empty the latrine. In both cases, the price paid per household remains the same, but the operator's costs change significantly.
The results of Case 2B (medium size formal operator) are similar to Case 2A in many parameters and show a modest increase in the distance traveled and the rotations per day. However, the average profit margin shows a loss of 7 percent, which is due to the high cost of operations coupled with the payment based on the number customers. During the Oxfam/EVE rehabilitation project, several desludging service providers stopped their service claiming that they were not making a sufficient profit to cover costs. The analysis in Case 2B appears to agree with this position.
As shown in Table III, the results in Case 2C show some very interesting trends. First, because the GRN truck volume is only 3 m3, many trips are required in order to empty out the septic tank completely. This leads to a high number of rotations per day (4.5 per day on average) but a low number of customers per day (1.7 per day on average). While the rotation time is shorter than the other Case 2 variants due to the closer proximity of the GRN Mayor's office to Niayes, the lower price charged (12,500 FCFA per customer, not rotation) makes the service very unprofitable. The average profit margin in Case 2C is 125 percent. This means that the cost of providing a desludging service that completely empties the latrine tank using a small 3 m3 tanker is not a feasible, or programmatically sustainable, venture.
3.3 Parametric analysis of subscription price
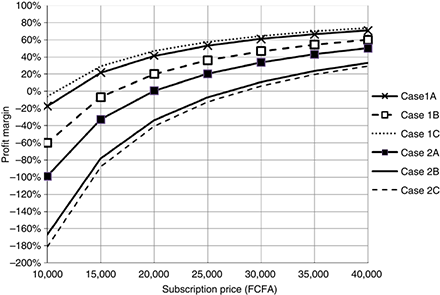
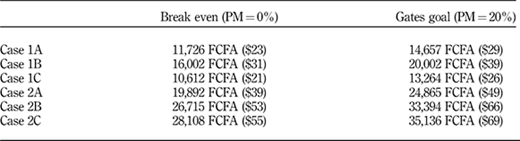
In Case 1 and Case 2, the price of the rotation/customer trip was set at 25,000 FCFA ($50) for Variants A and B and 12,500 FCFA ($25) for Variant C. It is also important to understand how the profitability changes for different subscription prices. As shown in Figure 2, all operators are showing a loss at subscription prices below 10,000 FCFA, which is the upper limit of the target price set by the Gates project. It is also possible to solve for the “break even” point where there is a 0 percent profit margin and for the subscription price that yields a 20 percent profit margin, as shown in Table IV.
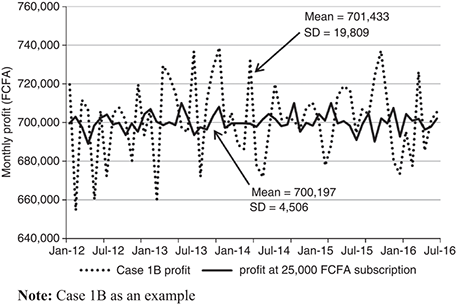
When there is a fixed subscription price that is collected on a monthly basis, the net profit is less variable than in the pay‐per‐service case, as shown in Figure 3. Currently, the model does not take seasonal variations in demand into consideration, which can be substantial. A subscription service will allow the operators to get through the low demand months assuming the revenues are managed well, but could also create problems if the operators spend the larger profits in low demand months and then realize lower profits or losses when the demand (and associated costs) is high. Since the management of the subscription service schedule and financial aspects will require a higher skill level in fleet management than the smaller private operators and municipal providers are accustomed to, training in these areas should be provided as part of the larger project.
3.4 Sensitivity analysis
Based on the results of Case 1 and Case 2 and the parametric analysis, several key drivers to profitability were identified. First, the cost of fuel constitutes 46 percent of the total operating costs and changes in the price per liter of fuel and/or truck fuel efficiency could have a significant impact on the profitability. Second, the limited operating hours at the Niayes discharge site was an important driver, since it limited the number of rotations that could be completed in a day. In order to meet the project's goal of a 20 percent profit margin at a subscription price of no more than 10,000 FCFA ($20), changes in both fuel efficiency and operating hours at Niayes may be necessary, and improvements in traffic congestion, especially along the route to the Rufisque discharge station, may also be beneficial.
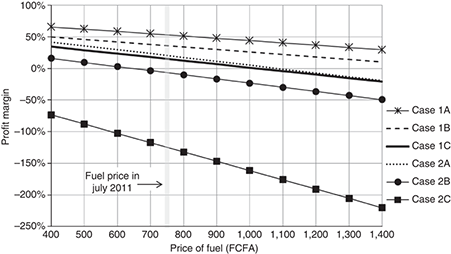
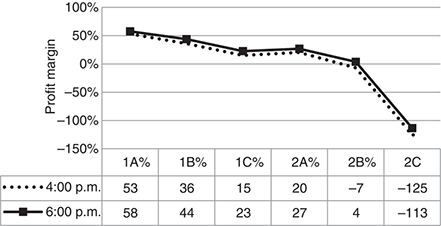
As shown in Figure 4, there is a linear relationship between the fuel price and profit margin and the magnitude of the decline in profitability with increasing fuel price is higher for those cases where more rotations are required in order to empty the latrine tank (e.g. Case 2). This is expected since the driving distance and volume of waste pumped drives the fuel consumption, which in turns drives the profitability. A potential increase in price of fuel should be considered a risk factor when deciding upon a fixed subscription price that leads to the 20 percent profit margin goal.
Since the cost of fuel plays an important role in the overall profitability, it is also important to consider the fuel efficiency of the desludging trucks. In the model, the fuel efficiency was set at 6 miles per gallon (39.2 l/100 km), which is typical for older vehicles driving in difficult terrain. If newer, more fuel‐efficient vehicles were bought, the increase to the profit margin would be from 10 to 42 percent.
The operating hours of the discharge site is also a factor in profitability. In the simulation model, the desludging service providers start work between 8:30 and 9:30 a.m. and continue doing rotations until they get to within one hour of the Niayes closing time (3:00 p.m.). If the previous rotation finishes shortly before 3:00 p.m., they return to the neighborhood to try to complete another one; otherwise, they return to the truck depot and end work for the day. Based on this logic, in the baseline cases, the operators arrived after closing 23‐29 percent of the time, in which case they were assumed to dump the truck contents into a drainage ditch or open field, which is the current practice. However, if the closing were extended to 6:00 p.m., the profit margin would be increased by 5‐12 percent, as shown in Figure 5, and the public health outcomes would also be higher.
4. Summary and conclusions
Based on the current desludging system in Pikine, it is not likely that the private sector providers will be able to achieve a 20 percent profit margin at a subscription price of 10,000 FCFA ($20/year) or below. Several changes could be implemented that would improve the Profit Margin, including increasing the fuel efficiency of the trucks and extending the operating hours of the discharge sites. In addition, since the price of fuel is highly variable, the subscription price should be re‐evaluated on an annual basis to make sure that the business case for the private sector operators still closes; otherwise the program will not be sustainable.
From a sanitation perspective it is highly desirable that latrines and associated tanks be completely emptied as reflected in Case 2. In order to be profitable under such a scenario, the service price must either be made proportional to the tank size, which could make the service too expensive for many households in Pikine, or the tanker truck would have to be larger, which could cause access problems in many areas. A semi‐collective system placed in an easily accessible area directly adjacent to a main road may be a possible solution to this problem, but needs to be examined more fully in future studies.
In conclusion, the current sanitation system in Pikine does not meet the needs of its residents and recent flooding has made a long‐standing developmental crisis even more acute. While a mechanical desludging service subscription plan will help, it must be part of a larger scale effort to modernize the sanitation infrastructure. Flood risk reduction projects in Pikine, such as canalization of waterways, construction of new raised latrines and voluntary relocation of the worst affected residents should be put at the forefront of government policy. If new infrastructure projects are required to make the subscription service more profitable, they should be included early in the project planning so that their associated maintenance costs can be in including in the life‐cycle modeling.
Future research should include: a comprehensive survey of the desludging service providers to add more precise and updated cost data; an assessment of the impact of traffic congestion; a study of how seasonal variations in demand will impact desludging operations; and a cost‐benefit analysis of adding communal latrines in the Pikine neighborhoods.


Jennifer L. Green performed this research while employed by Oxfam America as a Humanitarian Logistics Specialist and while completing a Master of Advanced Studies in Humanitarian Logistics and Management at the University of Lugano (USI) in Switzerland. The study formed the basis for her Master's dissertation at USI and also has been previously published in the Proceedings of the POMS 23rd Annual Conference, April 20‐23, 2011. The authors would like to thank the staff at Oxfam and EVE in Senegal for their significant contributions to this study and for the great work they are doing to help improve the lives of vulnerable people in Pikine.
References
Further reading
About the authors
Jennifer L. Green is a Research Scientist at the Massachusetts Institute of Technology and is the Deputy Director of the Center for Complex Engineering Systems at MIT (with Saudi Arabia) and the Project Manager for Sustainability with the Comprehensive Initiative for Technology Evaluation (with USAID). She holds degrees in Aerospace Engineering (Virginia Tech, ’86) and Humanitarian Logistics and Management (USI, ’11) and is currently pursuing a part‐time PhD at WEDC/Loughborough University. Her research interests include: sustainability; WASH; humanitarian logistics; and space mission supportability. Prior to joining MIT, Jennifer was a Humanitarian Logistics Specialist at Oxfam America, where she was responsible for global logistics and supply. Jennifer also worked for five years as the Supportability lead for NASA's Lunar Surface Systems program, two years with Peace Corps in West Africa, and 12 years at Boeing, where she provided systems engineering support to numerous space programs. Jennifer L. Green is the corresponding author and can be contacted at: jlgreen@mit.edu
Olivier L. de Weck is an Associate Professor of Engineering Systems in the Engineering Systems Division, Massachusetts Institute of Technology, Cambridge, Massachusetts, USA.
Pablo Suarez is based at the Frederick S. Pardee Center for the Study of the Longer‐Range Future, Boston University, Boston, Massachusetts, USA.

