


– Complementing the importance of adequate relief supplies and transportation capacity in the first two weeks of post-disaster logistics, efficient communication, information sharing, and informed decision making play a crucial yet often underestimated role in reducing wasted material resources and loss of human life. The purpose of this paper is to provide a method of quantifying these effects.
– A mathematical discrete dynamical system is used to model transportation of different commodities from multiple relief suppliers to disaster sites across a network of limited capacity. The physical network is overlaid with the communication network to model information delays and communication breakdowns between agents. The cost in human lives and the monetary cost are measured separately.
– Simulations results highlight quantitatively how communication deficiencies and indiscriminate shipping of resources result in material convergence and shortage of urgent supplies observed in actual emergencies.
– The model provides an example of a simple, objective, quantitative tool for decision making and training volunteer managers in the importance of a smart response protocol.
1. Introduction
Communication issues are of critical importance in emergency disaster response logistics. In the immediate aftermath of a sudden disaster, the necessity to act quickly is crucial, but a large number of uncoordinated and untrained relief workers with little information can just as quickly result in terrible inefficiencies, duplicated efforts and delays which ultimately waste material resources and, more importantly, increase the number of fatalities. In the last 30 years, communication networks have evolved considerably, yet the lack of information remains the basic factor limiting the efficiency of a disaster response. Information transmission by precarious telephone land lines, radio, and telex has now been replaced by wireless and satellite phones, mobile e-mail devices, and the internet. This explosion in information sharing and communication capacity, if used within a smart disaster response protocol, can greatly improve the quality and performance of the response.
The effects of communication in emergency disaster logistics are difficult to quantify and usually underestimated. Relief workers have a qualitative understanding of their importance, yet are often tempted to delay or forgo the transmission of vital information, opting instead to dedicate time and effort toward tasks that seem to produce more immediate and visible results. Similarly, the media often underestimate the immense impact of their reports on the humanitarian community’s efforts to accurately estimate the demand. Several other inefficiencies across the supply chain, including assessment of demand, fulfillment, prioritization, distribution, and redistribution of relief supplies across the supply chain can be improved by better communication, coordination, and collaboration between the parties involved.
This paper presents a discrete mathematical system dynamics (SD) model to study the role of communication and logistical coordination between actors in an emergency disaster response operation, and to measure their impact on the number of lives saved and dollars spent. Although these effects have been studied qualitatively, this original model provides a first attempt to quantify them. The SD methodology consists in breaking down a complex problem into a set of variables and parameters, assigning mathematical rules to determine the interactions between them. Although the number of variables and parameters may be large, the process is straightforward and intuitive, and most of the equations are relatively simple to construct. The resulting model, although large, is by no means intractable and can be readily solved in seconds with a standard computer and minimal training.
This model’s intrinsic value should become apparent to disaster management. The input parameters (number of suppliers, number of disaster sites, transport delay, etc.) are adaptable to a wide variety of real disaster scenarios. Using specified inputs, the model then assesses the effect of improved response protocols (increased communication of in-transit supplies, better prioritization of goods at bottlenecks, timely replenishment rate of high-priority items, etc.) in terms of dollars saved and loss of life reduced. Relief workers and volunteers, often forced to make decisions based on intuition or prior experience under extreme time and emotional pressure, will also find this model helpful to understand quantitative implications of inadvisable courses of action including missing or inaccurate information reporting. Since mathematical models can be continually improved to more accurately reflect reality, model details have been included for constructive critique by those with mathematical backgrounds.
The paper layout is as follows: Section 2 provides background and previous work leading to this study; Section 3 presents the mathematical model, including the rationale for assumptions and choice of variables and parameters; Section 4 demonstrates the performance and validity of the model through numerical simulations; Section 5 offers practical suggestions and managerial implications; Section 6 concludes the paper with limitations of the model and suggestions for extensions of this work.
2. Background
The field of natural disaster management and humanitarian logistics is broad, due to the different challenges posed by different types of disasters across different time scales. Whether the onset of a natural disaster is sudden (earthquakes, tsunamis, volcanic eruptions, landslides), slow or cyclical (floods, epidemics, hurricanes, typhoons, droughts, famine), relief operations can be divided into four phases: mitigation, preparation, response, and recovery, collectively known as the disaster operations life cycle. The response phase, which involves the emergency procedures deployed in the immediate aftermath of a disaster, is the shortest, but most critical phase, as it is during this phase that most lives are lost. Speed is of the essence, and the first 72 hours are crucial (Tomasini and Van Wassenhove, 2009).
Several case studies have analyzed the quality and timeliness of the relief provided to victims (Comfort et al., 2004; Schulz and Blecken, 2010), and most of the issues encountered in the first few days are the result of a lack of communication and logistical coordination (Balcik et al., 2010), as relief efforts are mobilized without any central coordination or oversight at a time when communication networks are disrupted. Even with proper communication infrastructure and technology, the flow of information is impeded by unreliable and inconsistent data collection procedures, low priority (LP) and unwillingness to cooperate (Day and Silva, 2009).
Besides the challenge of shipping urgent, vital supplies to a disaster-stricken area, material convergence, defined as the influx of useless and unsolicited donations, has been identified by field professionals as the most serious consequence of poor coordination, to the point of calling the phenomenon a “second tier disaster” (Balcik et al., 2010; Holguín-Veras et al., 2014). Immense quantities of useless clothing, expired medicine, and other inappropriate items, accounting in some cases for more than 70 percent of shipments converge to a disaster area, creating congestion and impeding the flow of vital items at a time when demand for them is highest and transportation networks are crippled. Material convergence wastes money, personnel and facilities which could be used for more essential tasks, thereby increasing the number of victims. Most unsolicited goods are ultimately destroyed, adding to the monetary cost (Holguín-Veras et al., 2014). The powerful information transmission capabilities of the media also play a large role in post-disaster logistics; even a small error in a television report can be amplified and be the source of material convergence (Balcik et al., 2010). Finally the lack of documentation and/or labels accompanying relief shipments often make their identification and prioritization impossible, causing delays in customs and last-mile delivery operations; delivery trucks, lacking guidance, wander through the disaster area seeking a willing recipient, creating congestion and using up transportation capacity, often only to dump their cargoes in any open area (Holguín-Veras et al., 2014).
The condition of the transportation infrastructure in and out of, and within, the disaster area is often severely reduced (Sumalee and Kurauchi, 2006), with damaged roads and bridges severely restricting or completely cutting traffic flow. Vehicles re-routed via detours and secondary roads unequipped for the sudden increase in traffic must fight bottlenecks in the crippled road network, dramatically increasing travel times and congestion, often remaining for several weeks until authorities are mobilized to regulate the new traffic patterns and repair the damaged links. Customs clearance creates another bottleneck affecting international shipments, which may be delayed for weeks for lack of personnel to process customs formalities.
Post-disaster humanitarian logistics has been identified as a “wicked problem,” a term coined by social planners to define multi-faceted problems involving a large number of interdependent stakeholders, with incomplete, contradictory, and changing requirements, making the formulation of an “optimal solution” to such social problems impossible (Rittel and Webber, 1973). Strategies for coping with wicked problems have been applied to post-disaster humanitarian logistics, specifically to address the large number of disparate, quasi-autonomous agents (400 organizations in Indonesia in the aftermath of the 2004 tsunami, and 900 NGOs registered by the UN as being present in Haiti), and the breakdown in the rule of law leading to looting and criminal behavior (Tatham and Houghton, 2011).
Recent studies in management and organizational theory have focussed on network approaches to policy for the administration of nonroutine, nonstandardized, wicked problems, moving from vertical management in a hierarchical structure to lateral, collaborative leadership relying on network communication (Chisolm, 1992; Ferlie et al., 2011; O’Toole, 1997). In humanitarian logistics, network governance is considered the most promising strategy to deal with the complexity of the problem, generating shared ownership, and enlisting the entire community in the humanitarian effort (Raab and Milward, 2003). Complex principal-agent problems may arise, as agents may be motivated to act in their best interests rather than those of the principal or community, and moral hazards may lead to the commitment dilemma (Rauchhaus, 2009) and unwillingness because of the costs associated with building an effective communication network (Stephenson, 2005). However case studies show that despite these dilemmas, overall the aid usually goes in the direction of greatest benefit for the victims (Benini et al., 2009).
The operations research (OR) methodology used for decision making in commercial logistics has been adapted to humanitarian supply chains (Stilianakis and Consoli, 2013; Van Wassenhove and Pedraza Martinez, 2012), leading to several successful attempts to model a disaster response as a multi-objective, multi-commodity stochastic nonlinear optimization problem. These models have been used for vehicle management, scheduling, shipment prioritization (Afshar and Haghani, 2012; Khorsi et al., 2013; Lin et al., 2011; Özdamar and Demir, 2012; Sheu, 2007; Zhang et al., 2012; Zheng and Ling, 2013), and for prepositioning facility location and inventory management (Balcik and Beamon, 2008; Beamon and Kotleba, 2006; Campbell and Jones, 2011; Rawls and Turnquist, 2010; Salmeron and Apte, 2010; Van Wyk et al., 2011). However considerable differences between commercial and humanitarian logistics make the adaptation of OR tools difficult, requiring, for example, the careful formulation of an objective function that takes into account the different components of the social cost, which includes the logistics cost as well as human suffering and lives lost (Holguín-Veras et al., 2013). Furthermore, commercial supply chain models assume a well-functioning infrastructure, precise knowledge of the nature and quantities of shipments, and a small number of highly trained professionals making decisions based on standard procedures. In humanitarian logistics, decisions often emanate from hundreds of poorly coordinated organizations and are made by untrained volunteer workers dealing with never-encountered situations under extreme emotional pressure, time constraints, and high levels of uncertainty (Beamon and Balcik, 2008; Holguín-Veras et al., 2012; Thomas and Kopczak, 2005).
SD methodology is an alternative approach that consists in modeling a rapidly evolving system using a system of coupled difference or differential equations. This method has been used to study disaster operations and visualize multiple variables unfolding over time under various external influences (Besiou et al., 2011; Peng et al., 2014).
3. Methods
3.1. Overview
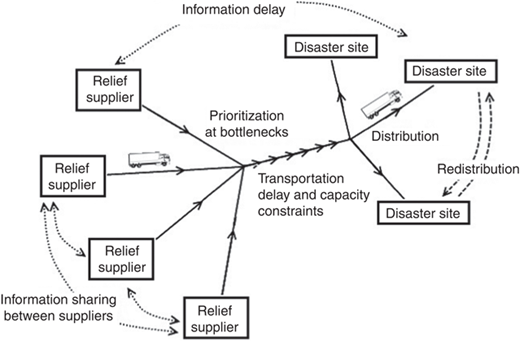
Our model superimposes two networks: The transportation network of material supplies flowing from collection warehouses managed by NGOs and their vendors to disaster sites; and the communication network between the relief community and the disaster sites. Both networks are further divided into two subnetworks: the intra-relief community (supplier) subnetwork; and, the intra-disaster area (field) subnetwork. The model simulates the flow of material resources and information while tracking the number of lives lost and the monetary cost within the first two weeks of the post-disaster response. We use a signal-supply-demand SD approach which translates both networks into a system of coupled difference equations. State variables representing the location of supplies are updated by discrete time steps of four hours as a function of communication parameters. Figure 1 shows the conceptual compartment diagram of the model.
3.2. Commodities
Relief supplies are measured in cubic feet (ft3) and divided into the three commodity classes used by the Pan American Health Organization (2001) (Holguín-Veras et al., 2012):
high priority (HP): urgent and required for immediate consumption;
low priority (LP): not immediately needed, but will be useful later on; and
non-priority (NP): not needed.
A specific item may be classified differently depending on the nature of the disaster and environmental conditions, for example blankets may be considered HP in a cold climate, but NP in a hot and humid climate. Although a disaster only creates a demand for HP and LP items, recent studies estimate that relief shipments often contain over 50 percent of NP items commingled with HP and LP items (Holguín-Veras et al., 2014). In our model, an item’s classification as HP or LP determines its deprivation cost.
3.3. Physical network parameters
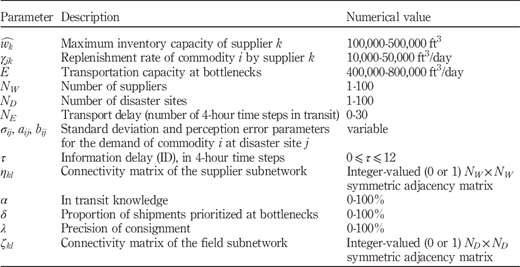
The physical network parameters listed in Table I allow for a variety of geographical and transport capacity constraints. The disaster area is divided into N D disaster sites with different demands. The relief community is divided into N W suppliers, each one having its own inventory of HP, LP, and NP items. Inventory management strategies studied elsewhere have been found to have an impact in the long run (Peng et al., 2014), but during the two-week planning horizon we assume constant replenishment rates γ ik, up to the maximum warehouse capacities (Equation 1) (represented as matrices γ and (Equation 2), respectively). Capacity constraints caused by damaged roads, bridges, or congestion are modeled by imposing a restricted bottleneck capacity (Equation 3) (in ft3/day) on traffic into and within the disaster area, causing an upstream shipment backup (Besiou et al., 2011). Although the capacity increases as road conditions improve and additional vehicles are mobilized, we assume it remains constant during the two-week planning horizon. Since in a post-disaster situation, transportation often functions close to its full capacity, we also assume a constant transport delay N E.
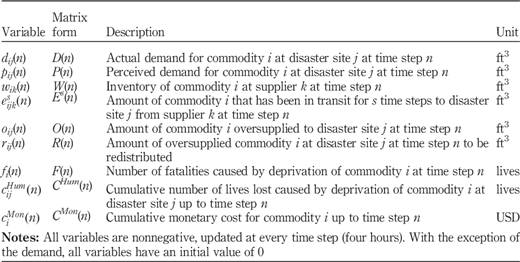
3.4. Variables
All variables listed in Table II are constrained to be nonnegative. The indices refer to the commodity (i=1, 2, 3 for HP, LP, or NP), the disaster site (j=1, …, N D), the supplier (k=1, …, N W), the delay step (s=1, …, N E), and the time step (n0). The large number of variables is represented in matrix notation for ease of computation. A disaster striking at the initial time step (n=0) creates an instantaneous demand D(0) for HP and LP commodities at disaster sites. Initial inventory levels W(0) can be nonzero to account for prepositioned supplies (Balcik and Beamon, 2008; Beamon and Kotleba, 2006; Campbell and Jones, 2011). All other variables have an initial value of 0.
3.5. The perceived demand
The perceived demand P may differ considerably from the actual demand D. To assess demand, relief agencies rely on field reports, the media, or survivor self-reports (who may knowingly exaggerate the need). The media is often criticized for broadcasting misleading or erroneous data regarding disaster-related needs, resulting in a flood of unnecessary donations (Besiou et al., 2011; Holguín-Veras et al., 2014). But the media effect also generates funding, speeds up assistance and increases in-transit knowledge. Experienced relief agents use statistical tools to complete and correct scarce or erroneous data using census records and their knowledge of the local population, terrain type, and damage level (Benini et al., 2009; Costa et al., 2012). There may be an information delay (ID) τ (τ0) between when the demand is generated and the relief community is made aware of it (Peng et al., 2014). In our model, the perceived demand combines these effects using a lognormally distributed random variable L with mean μ ij(n) and standard deviation σ ij(n), the mean being a linear function of the actual demand with delay d ij(n−τ). That is:
3.6. The cost functions
Two cost functions measure the performance of the response: the cost in human life, i.e. the number of survivor lives lost; and the monetary cost, which includes the procurement, transportation, and communication costs. We track these costs separately to avoid the subjective and controversial practice of assigning a dollar amount to human life. This separation between monetary cost and shortage cost is also used in multi-objective programming approaches (Van Wyk et al., 2011).
While the onset of a sudden disaster is always accompanied by a death toll, in the immediate aftermath, survivors may still face death caused by deprivation of water, food, shelter, or medical attention. Several attempts have been made to measure the effect of deprivation of vital supplies as a function of the deprivation time (Holguín-Veras et al., 2013). Here we determine the number of fatalities by building a probability function for death a given time step in a process similar to building an actuarial life table (see Table III). We first assume that the probability of death by deprivation of commodity i at time n follows a sigmoid function of the form:
where M i, N i, and K i are shape parameters (i=1, 2). We estimate M 1, N 1, and K 1 at 0.1, five, and ten days, respectively for deprivation of HP supplies, and M 2=0.05, N 2=4, and K 2=20 days for deprivation of LP supplies. These parameters are chosen to replicate the shape of deprivation functions consistent with data on the effects of deprivation in (Holguín-Veras et al., 2013). NP items being by definition unnecessary do not contribute to the deprivation cost. Thus the number of fatalities at each time step is:
where D PC1 and D PC2 are the per capita demands for HP and LP items, respectively. The cumulative cost in human lives is:
The monetary cost function is measured in US dollars (USD). It includes the costs for procurement (β m), transportation (β t), and communication (β c). Procurement costs can be estimated using the comprehensive Emergency Items Catalogue of the International Federation of Red Cross and Red Crescent Societies (procurement.ifrc.org/catalog), or the UNICEF Supply Catalogue (www.unicef.org/supply), which include costs, weights and volumes of basic supplies, medical kits, and communication equipment such as cell phones, tablets, and two-way radios.
Excess supplies at destination may be redistributed to another site (as determined by the field connectivity matrix ζ), incurring an additional transportation cost β t. Non-redistributed excess items are discarded, incurring a disposal fee β 0. The cumulative monetary cost is the sum of the elements of the matrix:
to which is added the communication cost β c.
3.7. Communication network parameters
Communication parameters model the upstream and downstream information flow between field and suppliers, as well as within the subnetworks (Table I).
A humanitarian communication network falls under the category of a bright network in management and organizational theory, meaning the subnetworks are assumed to be working toward the same goal despite problems arising from communication breakdown between them (Raab and Milward, 2003). In our model, we employ the classification from the Information and Communication Technology sector, where information sharing is the first and weakest form of working together, merely involving the transmission of messages and data. With time, information sharing may evolve into coordination, then cooperation, and ultimately collaboration, where strategies and solutions are created through the synergistic interaction of all parties (Denning and Yaholkovsky, 2008), but unless there is a prior relationship between agents, it is unlikely that communication will evolve beyond the first stage of information sharing during our initial two-week horizon.
3.7.1. The supplier and field communication subnetworks
The supplier and field subnetworks are modeled as undirected graphs whose connectivity are given by their respective adjacency matrices η and ζ. Connected suppliers operate out of a common inventory, thus offering greater flexibility in meeting the demand while minimizing the risk of oversupplying. Connected disaster sites can redistribute excess supplies to each other, although the volume of redistributed supplies counts against the limited road capacity (Equation 9) and incurs a transportation cost βt and delay NE. Connectivity carries a monetary cost βc (η, ζ) proportional to the number of edges in the graphs.
3.7.2. Communication between subnetworks
Parameters aij, bij, σij, and τ described in Section 3.5 model the upstream information flow and ability of decision makers in the relief community to accurately assess disaster-related needs.
Once shipments are mobilized, parameters α, δ, and λ model the downstream information flow and accuracy in delivering supplies to victims in need. The coefficient of in-transit knowledge α represents the proportion of shipments whose location in the supply chain in known. Because the compounding of information and transportation delays can cause a convergence of supplies well after the demand is met, many NGOs employ third-party logistics providers to transmit updated in-transit information, thereby increasing transparency of the supply chain and reducing the costly “black box effect” (Balcik et al., 2010). The prioritization coefficient δ represents the proportion of shipments that are prioritized when delayed upstream of a bottleneck, with HP items shipped first, followed by LP and ultimately NP items, up to the maximum capacity. Prioritization requires identification of the contents of each shipment by standardized labels (as required by many NGOs) and proper documentation (packing list and pro forma invoice) to expedite customs clearance and delivery. The consignment coefficient λ models the effectiveness in delivering supplies to the correct disaster site upon arrival to the disaster area.
Monetary costs associated with the technology and logistics required to improve the upstream and downstream information flows are modeled by βc(a,b,σ,τ) and βc(α,δ,λ).
3.8. Model equations
Shipments departing the supplier warehouses enter the in transit compartment, where they are delayed for a total of N E time steps (Equation (9)), before they are delivered to the disaster sites. At every time step, the demand D(n) decreases by the quantity E NE(n−1) released out of the in transit compartment after the final delay step N E, fulfilling the demand. The demand also decreases due to the fatalities of the previous time step g 1(F(n−1)) (Equation (6)). The demand is constrained to be nonnegative (as are all variables), so any overage is applied to the oversupply O(n) (Equation (7)), while the field subnetwork connectivity matrix ζ determines which supplies are redistributed (Equation (8)). The quantities shipped out from each supplier’s inventory and into the in transit compartment E0(n) are determined by a function g 3 (Equation (10)) as follows. Each supplier or group of information-sharing suppliers attempts to ship out supplies according to the perceived demand at the previous time step P(n−1). The total quantity entering the in route compartment cannot exceed the sum of the supplies in inventory W(n−1) and redistributed supplies R(n−1). If the total quantity available to be shipped out by all suppliers exceeds the transportation capacity (Equation 19), the prioritization parameter δ determines which commodities are shipped out. Finally, the consignment parameter λ determines which shipments are routed to destinations according to their perceived demand. The quantities in inventory are updated at every time step (Equation (11)), decreased by the quantities shipped out and increased by the replenishment rates. The perceived demand (Equation (12)) is sampled from log-normally distributed random variable L (Equation (1)) and reduced by the quantities already in transit, if there is advance knowledge of them (as determined by parameter α). The cumulative cost in human lives (Equation (13)) and monetary cost (Equation (14)) accrue at each time step, adding the number of fatalities (see Equation (3)) and money spent at each time step.
4. Model performance
A large number of scenarios can be simulated by the cross-combination of the network and communication parameters, providing the costs incurred in a particular policy and quantitative insights into what constitutes a smart disaster response. To demonstrate the validity of the model, we simulate a realistic situation to verify that numerical results demonstrate material convergence, shortage of urgent supplies, and other phenomena caused by communication challenges observed in real emergencies. Our test scenario is a hurricane striking the southeastern coast of the USA, leaving 20,000 survivors in need of emergency supplies. Parameters are determined from data taken from a similar example used in (Afshar and Haghani, 2012), using demand estimates collected after Hurricane Katrina (Holguín-Veras et al., 2012).
4.1. Parameters
The demand is estimated at 300 ft3 of supplies per person over the first two weeks (60 percent HP, 40 percent LP), to be fulfilled by 20 suppliers located outside the disaster area, each with a maximum capacity of 300,000 ft3. Supplies are replenished at a rate of 10,000-50,000 ft3/day, depending on each warehouse’s receiving and inventory allocation policy for the three commodity classes (HP, LP, NP). Capacity at bottlenecks is limited to 800,000 ft3/day, which corresponds to approximately 300-400 trucks (53 ft trailers) filled at 60 percent capacity. Although this figure may seem low, it is realistic in a situation where damaged or destroyed roads and bridges cause severe traffic congestion.
Using the IFRC Emergency Items Catalog, we estimate the HP procurement cost for water and food at 15 USD/ft3, and the LP cost for medical supplies, shelter, and blankets at 25 USD/ft3. For transportation and logistics, costs are estimated on the basis of US-based third-party logistics provider AIT Worldwide Logistics (www.aitworldwide.com), with a domestic less-than-truckload rate of 80 USD/ft3, including real-time tracking and tracing.
Simulations are run for two weeks or until both cost functions have reached their maximum values.
4.2. Numerical results
As a first example, we consider the case of 20 suppliers with 100 percent information sharing, each one replenishing supplies at a rate of 30,000/10,000/48,000 ft3/day (HP/LP/NP). Upstream communication error is given by a standard deviation of 200,000 ft3 with no ID. Downstream, there is no in-transit knowledge, shipments contain 20 percent of NP items and are not prioritized at bottlenecks. Time-course results (Figure 2) show that the demand for HP and LP items is fulfilled after ten and 12 days, respectively. The transportation capacity bottleneck causes a backup of supplies at the suppliers’ warehouses. After 12 days, 3,078 lives have been lost and the monetary cost reaches 902 million USD.
The costly effects of material convergence can be seen when there is a large number of suppliers and no information sharing (modeled by setting η=0). With no transportation capacity restriction, USD1 billion is sufficient to save 99 percent of the 20,000 survivors, but the monetary cost may rise much higher (Figure 3(A)). A reduced transportation capacity mitigates the cost increase with a minimal impact on the number of lives lost as long as it does not drop below 600,000 ft3/day (Figure 4).
In-transit knowledge (modeled by parameter α) helps anticipate deliveries to better adjust supply and demand, reducing monetary cost, especially when the transportation delay is long (Figure 3(B)).
Inventory replenishment policies improve the overall performance; the HP to LP ratio has a direct impact on the number of lives saved, even when outgoing shipments contain a substantial proportion of commingled NP items (Figure 3(C)-(D)). Replenishing inventory at the optimum rate of 42,000 ft3/day for HP items and 18,000 ft3/day for LP items achieves a minimum number of lives lost (less than 400). This figure rises to over 600 if the replenishment rate of LP items increases to 36,000 ft3/day, as the HP/LP ratio falls out of proportion with demand ratio. Prioritizing outgoing shipments (as modeled by parameter δ) further reduces the number of fatalities.
Besides information sharing and collaborative procurement observed between certain NGOs (Balcik et al., 2010), the effects of prioritizing goods according to their urgency (shipping HP goods first, then LP) greatly reduces the number of fatalities (Figure 4). Preprocessing shipments before departure allows for a more efficient use of the limited transportation capacity and faster deliveries, relieving field workers from the need for additional distribution and redistribution logistics. An increase in transportation capacity raises the monetary cost but also the number of lives saved, as evidenced by comparing panels A and B.
Figure 4(C) shows the effect of material convergence of NP items on the number of fatalities. Despite 100 percent information sharing between suppliers and no ID (ηkl=1; τ=0), the difference between 0 and 70 percent NP items alone increases the death count fourfold. Prioritization, even partial, greatly reduces the number to less than 2,000. Figure 4(D) shows the impact of ID. The number of lives lost rises quickly with ID, with a 24-hour ID alone responsible for almost 100 additional deaths.
The scenario in Figure 5 shows an unequally distributed demand: 60 percent of disaster sites require 300 ft3/person of HP items only, and 40 percent of sites require 300 ft3/person of LP items. Knowing which sites require which items (modeled by parameter λ) allows for more precise deliveries, reducing the death toll (from 5,000 to 1,000) and the monetary cost. The connectivity of the destination network (modeled by parameter ζ) further reduces the monetary cost by allowing the local redistribution of excess items.
5. Applications in disaster management
5.1. Budget allocation
A practical use of the model is to determine the optimal allocation of funds between procurement, transportation, and communication, and specifically where to focus communication efforts for the greatest benefit of the survivors. Figure 6 is a ternary plot showing the number of lives lost in the case of a budget of USD800 million. Using parameters of Section 4.1, allocating 16 million to prioritization procedures and eight million to information sharing achieves a minimum number of lives lost (less than 400).
5.2. Ex post facto disaster analysis
Determining parameter values for the physical and communication networks is the main requirement for effective use of the model. In Section 4, we used data from a well-documented past disaster to estimate the number of suppliers, transportation capacity, and other parameters. This type of analysis of past disasters is a valuable exercise to determine what could have been done differently. Estimating parameters for a new disaster situation requires comparing and extrapolating data from similar disasters, making necessary corrections based on experience and knowledge of the field.
5.3. Educational tool
Important disaster response failures cannot be linked to a single cause, rather result from a combination of factors (Schulz and Blecken, 2010). As illustrated in the test scenario above, the explosive combination of a reduced transportation capacity, no information sharing and high proportion of NP items creates a “perfect storm” with particularly devastating consequences. By a cross-combination of parameters, our model allows the identification of possible deadly pitfalls caused by inconsistent management of interdependent sectors. Thus the model provides a bird’s-eye view of the managerial landscape of a multi-sector operation, a useful educational tool for managers who may be experienced in one sector, but lacking in insight about the extent of the amplified ramifications of their decisions.
5.4. Long-term communication development
Increasing communication and information sharing in a network carries a monetary cost, as incorporated in our model, but there are other barriers causing difficulty and reluctance to communicate: political interests, military forces, donor requirements, geographical dispersion, and different styles of management and administrative structures that undermine the effectiveness of an integrated response (Stephenson, 2005). Organizational development studies have determined that a humanitarian response operation is dealt more effectively with a lateral network form of governance (as opposed to a hierarchical model), but that the level of communication required for this form of coordination without a central authority develops slowly. Independent and rival humanitarian organizations form temporary networks, and with time and across multiple disasters, can build trust and learn the need for coordinated action above immediate demands for organizational salience (Stephenson, 2006; Costa et al., 2012). The model is a guiding tool for long-term humanitarian network communication policies.
5.5. Communication network information sharing (CNIS) integrated disaster management systems
The model effectively simulates for a wide variety of scenarios the importance of the communication network in logistical disaster response management. Its applicability to real situations is via standards for enhanced design of existing mobile/web-based disaster management systems. In particular, such systems should effectively integrate CNIS. To our knowledge, existing systems lack clear and/or simple CNIS integration. Basic questions guiding the design of CNIS integrated disaster management systems appear in Table IV. A primitive CNIS integrated demo system is available as a proof of concept at http://summerresearch14.wix.com/cnis. Expert developers are encouraged to develop much more sophisticated, automated CNIS integrated disaster management systems.
5.6. Equity in resource distribution
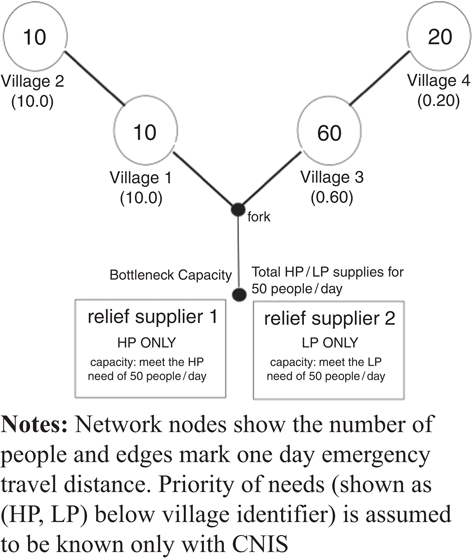
Whereas basic standards for CNIS integrated disaster websites may address the importance of wide scale communication, our model framework can also illustrate the imperative need for information sharing on a much simpler scale. Figure 7 shows a geographic network of four small disaster prone villages. Network nodes show the number of people and edges mark one day emergency travel distances.
We consider now a disaster occurrence after which each village has either a need for HP or LP care. All those needing HP care will die after three days and 10 percent of those needing LP care will perish after six days. The need priority is indicated as an ordered pair (HP, LP) associated with each village. We assume complete (HP, LP) information is only known at the initial time step n=0 if CNIS exists. (Trucks, upon arrival, can communicate a village’s needs back to suppliers).
Two agencies are prepared to assist with relief in this area. One agency can only supply HP care with a capacity to meet the needs of 50 people/day. The other provides LP care only, also with a 50 person/day capacity. The bottleneck capacity allows LP and/or HP supplies for 50 people/day. The goal is to save as many lives as possible.
In the absence of CNIS, since 80 percent of the people live on the two right fork villages, a reasonable shipment strategy to save lives from an equity viewpoint is to ship 80 HP items to the right fork villages. However, in so doing, ten lives are lost on day 3, and a 50 HP, 40 LP material convergence occurs on days 4-5. An efficient and effective strategy guided by CNIS shows in six days the complete need can be met by two trucks and no lives are lost.
On the field, communication based procedures can generally be implemented much faster than changes in the structure of the physical network, especially in at-risk communities who have preventive measures and/or contingency plans already in place when a disaster hits. Though simple, our case scenario indicates the real impact of the inclusion of information sharing. The necessary communication network can often be set up, but is not utilized at full potential (Day and Silva, 2009), possibly resulting in avoidable tragic loss of life.
6. Conclusion
The paper presents a discrete mathematical SD model to measure the performance of a disaster response subject to variable constraints in the physical (geographic and transportation) and communication networks. The model uses dynamic variables to track the demand and transportation of HP, LP, and NP relief supplies from multiple suppliers to disaster sites across a network of limited capacity. Response performance is measured by two cost functions measuring the number of lives lost and monetary cost. The methodology systematically breaks down a complex problem into a set of variables and parameters where the mathematical equations used to model the interactions between them can be easily modified as needed.
We demonstrate the model’s capacity to replicate the qualitative effects observed in actual emergencies within the first two weeks of a disaster response, and provide a method for comparing the effects of different communication breakdowns across a disaster supply chain. The results give quantitative insights into a large number of factors involved in a response protocol. In particular, the importance of effective communication and decision making is highlighted to the benefit of those involved in training volunteer managers.
Despite the large number of variables and parameters, the model is still a crude simplification of reality. In every possible context, it is possible to imagine unpredictable, and hence unmodeled, facts that would act as disturbances on the system. Future enhancements to the model can include adding a greater variety of commodities beyond the basic emergency survival supplies and extending the simulation horizon to include the long-term recovery phases of disaster relief by converting constant or linear parameters to more complex time-dependent functions, for example to model the gradual implementation of communication and logistics procedures and the increase in transportation capacity observed in long-term relief operations (Liberatore et al., 2014). As regular supply chains are established, the model can be used to test different inventory management strategies such as those proposed in (Peng et al., 2014; Beamon and Kotleba, 2006), identifying those that would perform better and avoid dynamic instabilities observed in the highly volatile disaster relief environment, such as the bullwhip effect (Lee et al., 1997; Chen et al., 2000; Peng et al., 2014). The structure of the underlying network can be enhanced to model geographical and socio-economic heterogeneity in the disaster area. Such extensions should serve to improve the model’s ability to accurately quantify the overall costs in lives and money associated with a particular response policy. In conjunction with these theoretical advances, practical implementation by IT specialists is envisioned to create a user-friendly mobile interface allowing response managers to easily input estimated disaster conditions and obtain instant decision-support including comprehensive feedback on the ramifications of any course of action under consideration.
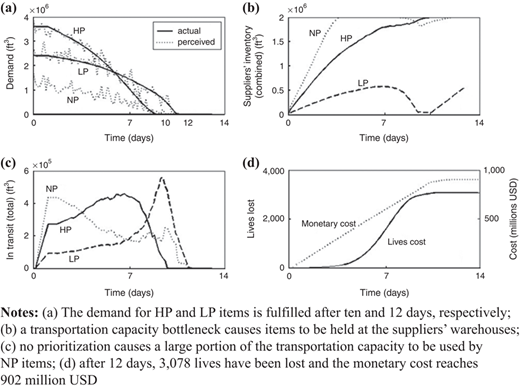
Time-course simulation for 20,000 survivors generating a demand of 6,000,000 ftof relief supplies
Time-course simulation for 20,000 survivors generating a demand of 6,000,000 ftof relief supplies
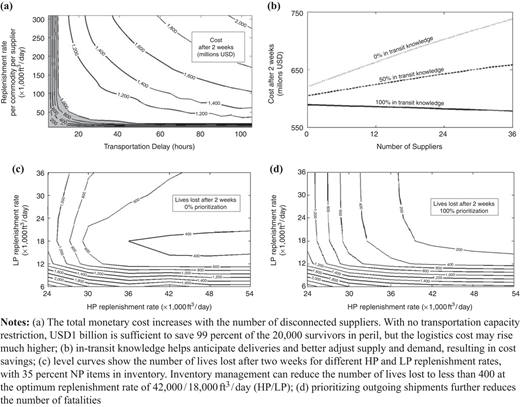
The cost of lack of information sharing and in transit knowledge, and the benefit of replenishment policies and inventory management to reduce the number of lives lost
The cost of lack of information sharing and in transit knowledge, and the benefit of replenishment policies and inventory management to reduce the number of lives lost
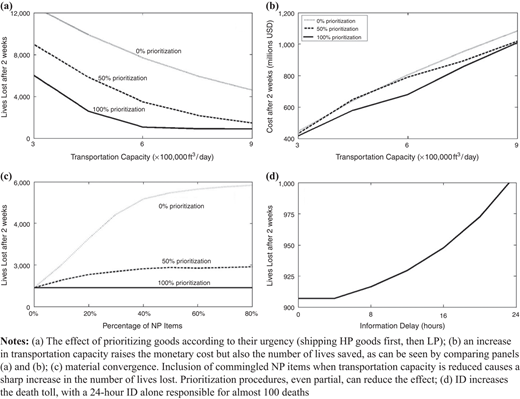
The benefit of preprocessing and prioritizing shipments, and the costly consequences of material convergence and information delay on the number of lives lost
The benefit of preprocessing and prioritizing shipments, and the costly consequences of material convergence and information delay on the number of lives lost
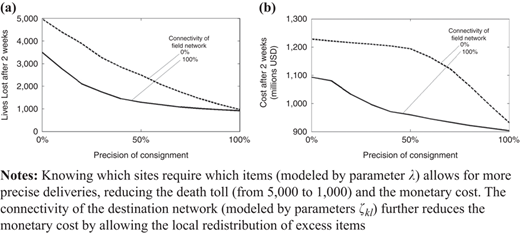
Non-uniform demand (60 percent of disaster sites require 300 ft/person HP items only, 40 percent require 300 ft/person LP items)
Non-uniform demand (60 percent of disaster sites require 300 ft/person HP items only, 40 percent require 300 ft/person LP items)
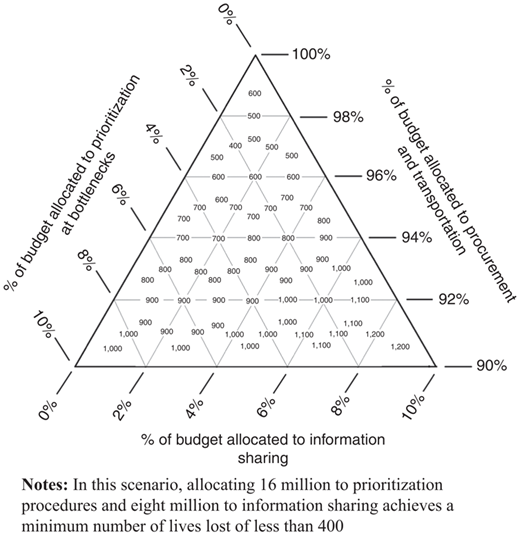
Ternary plot showing the number of lives lost in the case of a budget of USD800 million
Ternary plot showing the number of lives lost in the case of a budget of USD800 million
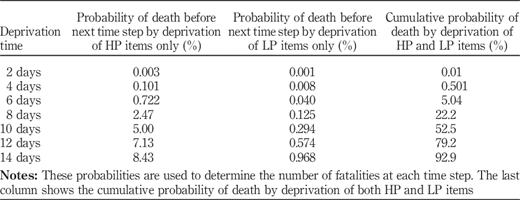
Probabilities of death before the next time step (of four hours) by deprivation of HP and/or LP items given by sigmoid functions
Probabilities of death before the next time step (of four hours) by deprivation of HP and/or LP items given by sigmoid functions
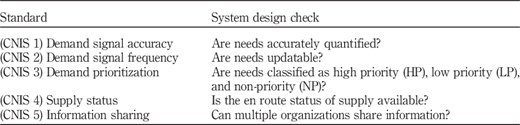
Basic communication network information-sharing integration standards for disaster management systems
Basic communication network information-sharing integration standards for disaster management systems


















References
Further reading
About the authors
Danilo R. Diedrichs completed his PhD in Applied Mathematical and Computational Sciences at the University of Iowa in 2012 and is now an Assistant Professor of Mathematics at Wheaton College in Wheaton, Illinois. His research focusses on mathematical modeling of dynamical systems for the analysis, design, and control of complex networks. Dr Diedrichs also holds an EPF Diploma in Civil Engineering from the Swiss Federal Institute of Technology and has over ten years’ professional experience in the International Supply Chain Logistics Industry, where he worked as a Customs Broker and Intermodal Operations Specialist. Danilo R. Diedrichs is the corresponding author and can be contacted at: danilo.diedrichs@wheaton.edu
Kaile Phelps is an Undergraduate Student at the Wheaton College in Wheaton, Illinois, majoring in Applied Mathematics and Economics.
Paul A. Isihara completed his PhD in 1987 at the SUNY Buffalo on a Dynamical Systems Model from Neurobiology. He has published papers in various fields of mathematical modeling and is currently involved as a Wheaton College Professor with the Humanitarian Disaster Institute in their work to build information-sharing capacity within collaborative church networks formed post-tsunami in Japan and post-Haiyan in the Philippines.
The authors wish to thank Michael Kietzman and Philip Stanton, as well as Joe Zeno at CaroTrans International and James Lagreca at AZ Midwest, Inc. for their professional assistance. This work was supported by the Wheaton College Summer Science Research Program and the Wheaton Alumni Association.

