


The purpose of this paper is to improve disaster management models, have an optimal distribution of assets, reduce human suffering in a crisis and find a good solution for warehouse locations, distribution points, inventory levels and costs, considering the uncertainty of a wide range of variables, to serve as a support model for decision making in real situations.
A model is developed based on the recent models. It includes structured and non-structured data (historical knowledge) from a humanitarian perspective. This model considers the uncertainty in a landslide and flood area and it is applied in a representative Peruvian city.
The proposed model can be used to determine humanitarian aid supply and its distribution with uncertainty, regarding the affected population and its resilience. This model presents a different point of view from the efficiency of the logistics perspective, to identify the level of trust between all the stakeholders (public, private and academic). The finding provides a new insight in disaster management to cover the gap between applied research and human behavior in crisis.
In this study the access of reliable information is limited.
This paper provides an operation model with uncertainty in a humanitarian crisis and a decision-making tool with some recommendation for further public policies.
This study presents a model for decision makers in a low-income zone and highlights the importance of preparedness in the humanitarian system. This paper expands the discussion of how the mathematical models and human behaviors interact with different perspectives in a humanitarian crisis.
1. Introduction
This paper discusses the consequences of natural disasters, such as damage to infrastructure and loss of human life. Unfortunately, when roads and other infrastructure are in poor condition, it hinders immediate aid and provision of necessary resources to victims of sudden disasters.
The tsunami that struck Indonesia in 2007 is an example of this. Former United Nations Secretary General Kofi Annan emphasized that, while the quantity of resources sent and the generosity of the international community were important, it was even more important to manage these resources effectively. In this context, one European ambassador observed the lack of professionalism in the management of logistics in this case (Thomas and Kopczak, 2007; Shane and Jan, 2005). He emphasized that, if all the aid and resources were sent at once, it would be impossible to manage and monitor them effectively. A spokesperson for Doctors Without Borders also stressed the need to enlist supply chain managers in order to sort donations, identify priorities, track deliveries and direct the logistics of a relief effort in full gear (The Economist, 2005). With this aim in mind, humanitarian logistics seeks to manage the storage of goods and materials with the purpose of alleviating the suffering of vulnerable people in an efficient, coordinated and accountable way (Thomas and Kopczak, 2007). When disasters occur, the allocation of points of distribution (PODs) is critical on bringing a helping hand. However, this is not an easy task, due to the fact that the lack of precise data and uncertainty regarding demand during a crisis can generate enormous changes in the design of the supply chain (Tayal and Singh, 2017). As consequence, for each phase of the disaster’s life cycle, the role of PODs must be established: mitigation, preparedness, response and rehabilitation (Leiras et al., 2014; Van Wassenhove, 2006, Tomasini and Van Wassenhove, 2009).
The mitigation phase includes activities which could help to significantly reduce the effects of the future disasters and, if possible, prevent those disasters altogether. However, if communities cannot prevent disasters, they can at least reduce the damage (Beresford and Pettit, 2009; Tomasini and Van Wassenhove, 2009). The preparedness phase involves planning how to respond when an emergency or disaster occurs (Tomasini and Van Wassenhove, 2009). Despite the importance of communication with the community in this phase, there are gaps in the official documentation and dissemination of the operation plan for the disaster. (Hale and Moberg, 2005).
The next phase, the response phase, is the one that aims to relieve the suffering of the community (Brito et al., 2015) in a rapid onset disaster by using POD strategies and the community’s first response resources (Holguín-Veras et al., 2016; Van Wassenhove, 2006). In this context, the decision maker needs to prioritize five constraints which are focused on the drivers of supply chain performance (facilities, inventory, transportation, information and sourcing), while cost becomes a secondary priority (Azim et al., 2018). At the same time, medical supplies and food are the most important resources to get to the victims, especially in the first 72 h after the disaster ( Roh et al., 2013; Kiefer and Novack, 1999). Furthermore, it is important to note that victim support is affected when the only access roads are damaged. As a way to reduce the response time and be prepared in case roads become blocked, existing warehouses can be adapted to become a base for humanitarian activities (Choi and Hanaoka, 2017). In the response and recovery phases, the humanitarian logistics PODs provide first response resources, maintain inventory efficiently and control different flows (products, emergency workers and victims) with effective transportation, providing real-time information and coordinating stakeholder requirements (Azim et al., 2018). However, in the response phase, space and resources are limited due to the crisis environment. Also, the response time will be affected according to whether there is a proactive or reactive approach to the crisis (Elluru et al., 2017). Product flow in emergency situations must be managed by disposing of irrational donations and coordinating the stakeholders’ interests (Destro and Holguín-Veras, 2010). Finally, the rehabilitation phase of the emergency management cycle continues until all systems return to normal or near normal operation (Leiras et al., 2014; Tomasini and Van Wassenhove, 2009).
This paper proposes an improved disaster response model for Chosica, Peru, a city prone to landslides and flooding. The model determines the areas and facilities necessary for humanitarian logistics in a sudden disaster response situation. To achieve the goals of this model, the constraints are centered on facilities, catastrophe probability and uncertainty regarding the victims. The supply chain’s basic elements are used in a flow chart (Chopra and Meindl, 2013) to support the coordination of the related stakeholders in response to a natural disaster (Choi and Hanaoka, 2017). In this proposal, the segmentation of PODs should be prepared in advance for a rapid response and flexible operations, to ensure an agile humanitarian model. The use of public and private facilities is recommendable in order to coordinate in an emergency environment (Balcik et al., 2010), so that in a humanitarian crisis there is a maximum walking distance of only 500 m (Young and Harvey, 2004; Gostelow, 1999). The main contribution of this work is the development of a model that takes into consideration the uncertainty of a disaster in an area of risk. Its application is based on immediate response operations and on the levels of the execution of the strategies in each phase in a disaster cycle.
This paper is composed of seven sections. Section 2 reviews the relevant literature. Section 3 covers the model design, and Section 4 presents the case of Chosica in Peru. Section 5 contains the results and discussion. Section 6 deals with the implications for management and future research, and the final section is comprised of the conclusions and recommendations for future research.
2. Literature review
The number of disasters, along with their impact on the global population, has increased, and they are causing growing alarm throughout the world. The causes of this increase include factors such as global warming, an increase in the world’s population, a higher concentration of people living in urban areas and globalization. Indicators show that if a crisis occurs, the negative impact is greater in cities with a high concentration of inhabitants due to the greater number of affected people. This impact has been growing over time. Disaster events that have occurred since the beginning of the twenty-first century have made it easy to identify this pattern. There tragedies include the tsunami in the Indian Ocean in 2004, Hurricane Katrina in 2005, the earthquake in Haiti in early 2010, the tsunami in Japan in 2011, the Ebola virus outbreaks in 2014 and the earthquake in Nepal in 2015. These events gave rise to the need for humanitarian logistics for vulnerable populations in order to provide efficient and effective care for the victims to cut down on the suffering of these communities.
The humanitarian logistics literature presents different approaches using development programs and policies as a reference, under the integration of the private and public sectors (Van Wassenhove, 2006), their relationship with humanitarian-focused logistics and transportation (Thomas and Kopczak, 2005) and the application of production planning in a business environment in crisis situations (Kovács and Spens, 2007). Additionally, applied cases present the concepts of risk in the supply chain from a humanitarian perspective (Christopher and Tatham, 2011). Some authors solve problems focused on the victims’ needs in a crisis situation (Holguín-Veras et al., 2014), taking the resilience cases of organizations into account, as well as the emphasis on visibility and communication (Sheffi, 2015). Recent work is looking for ways to solve humanitarian problems under uncertainty based on push and pull strategies, using, among other methods, operations research techniques, system dynamics and computational intelligence (Buzogany et al., 2016; Brito et al., 2015; Rawls and Turnquist, 2010), comparing diverse humanitarian crisis cases from around the world.
2.1 Disasters
A natural or anthropogenic disaster is defined as an adverse or unexpected event with a series of complex disruptions in a very volatile environment (Van der Merwe, 2010). Natural disasters can be thought of as frequent events in a continually changing system (Kovács and Spens, 2007; Tomasini and Van Wassenhove, 2009). Among these events are floods, earthquakes and diverse atmospheric phenomena. In 2016 alone, 315 events caused more than $210bn in losses and affected more than 200m people around the world (Aon plc, 2016). Keeping in mind the averages over the previous 15-year period, these annual scenes show an estimated 20 percent increase in damages. Anthropogenic disasters are accidents, intentional disruptions and destruction caused by humans. The magnitude of these disasters is quantified by people’s impact on their surroundings and the consequences this impact brings (Pindyck and Wang, 2013).
One of the difficult issues surrounding disaster management is its unique pattern, with causes, processes and effects which are multitudinous and exclusive at the same time. The life cycle of crisis management is unique in its four phases: response, rehabilitation, mitigation and preparedness (Blecken, 2010; Tomasini and Van Wassenhove, 2009). In these phases, communities aim to mitigate the disaster’s impact, mainly on the affected people, infrastructure, economy and businesses. The response phase seeks to respond immediately to the needs of the affected population in order to save lives, provide medical aid, ensure affected people’s well-being and discover the affected people’s basic needs. The actions are focused on the deployment of humanitarian resources (Naor and Bernardes, 2016). They are also focused on proposing follow-up actions regarding the efficient management of warehouses and the reduction of the delivery time of goods to affected areas (De Leeuw and Mok, 2016). The rehabilitation phase aims to return the system to normality, with activities focused on obtaining and updating data, in order to start the process of rehabilitating the affected environment (Sokat et al., 2016), as well as planning out how to sustain the system (Cuervo et al., 2010).
The mitigation phase is focused on reducing the impact of a possible disaster. Some proposals are presented in order to lessen the negative impact on aid organizations (Fontainha et al., 2016), and other proposals aid emergency decision-making processes (Peres et al., 2012). The last phase, the preparedness phase, focuses on planning and preparing communities for a possible emergency or disaster through information dissemination and communication activities, the review of action plans, simulations, stakeholder meetings, etc. The aim of this phase is to save as many lives as possible and to minimize damage by preparing communities to know how to respond appropriately to an emergency (Buzogany et al., 2016; Gonçalves and Castañeda, 2013).
2.2 The resilience of cities
Resilience is the capacity to adapt to a crisis and effectively recover through processes, to manage events by being open to different options and being flexible, generally at a low cost (Sheffi, 2015). This resilience has three pillars: persistence, adaptation and transformation (Meerow et al., 2016; Jabareen, 2013; Keck and Sakdapolrak, 2013). Persistence is defined as the degree of disturbance that a system can accept and still be able to overcome adversities (Chan et al., 2014; Jabareen, 2013). Adaptation is the ability for the community to learn from experience, to build up knowledge about the environment in order to face future challenges and to transform itself in order to promote its well-being in a sustainable manner (Jabareen, 2013; Keck and Sakdapolrak, 2013).
A city’s resilience is also its capacity to adapt itself to a disaster and continue with its urban development. A resilient city should have homes with basic services and adequate infrastructure in safe areas, as well as sustainable communities, communication channels and the ability to forecast disasters in order to minimize physical and social losses; a resilient city should also have development strategies (United Nations Office for Disasters Risk Reduction, 2017). An example of a resilient city is San Francisco, which has a Resilience Wheel based on three stakeholders: the individual, the organization and the community; and seven functional areas – environmental, economy, infrastructure, health, social, cultural and education – as well as a “disasters” area (United Nations Office for Disasters Risk Reduction, 2017).
2.3 Humanitarian logistics
When disasters occur, the victims need humanitarian and emergency supplies as soon as possible. The importance of managing these requirements is vital within the first 72 h after the disaster (Van Kempen et al., 2017; Roh et al., 2013). Managing the pull and push strategies of this requirement is a difficult task and depends on the flow of products and information (Balcik et al., 2010) with different levels of integration, coordination, communication and trust between actors (Gralla et al., 2015, 2016); this can generate the bullwhip effect in the increased demand for products (Lee, 2002).
The field of humanitarian logistics is wide (Apte, 2009), its main application is supply chain management (Christopher and Tatham, 2011). One of the models focused on the actors in the field of crisis management is the stakeholders’ model (Fontainha et al., 2016; Ackermann and Eden, 2011), which shows interaction between private companies and the public sector and society as a whole, establishing a principal role for the state when disasters occur because of the fragility of the relations among all actors involved in the crisis situation. The flow of products and information is focused on the victims, and the flow of money comes second. Other authors propose models based on urban logistics, like a humanitarian maturity model (Morana, 2015) with its five levels: initial; organized; defined; managed and controlling the processes, practices and supply management tools. This adaptation establishes the levels and metrics in the event of a disaster, pre-positioning the materials in the prevention phase, activating donations and purchases in the response phase, preparing development plans in the rehabilitation phase and delineating development policies in the mitigation phase.
Several authors write about the concentration on disaster preparation and response, given the level of uncertainty (Christopher and Tatham, 2011) and its relation with supply chain strategies. Some authors propose that communities mitigate this disaster effect with a push strategy, using emergency supplies in high-risk areas (Brito et al., 2015; Noyan, 2012; Rawls and Turnquist, 2010). The importance of this strategy is documented by different authors (Buzogany et al., 2016; Apte, 2009; Chang et al., 2007) and others have analyzed the PODs’ role with regard to coordination during disasters (Brito et al., 2015) in order to prepare an effective crisis management plan.
Other proposals are the emergency models that aim to model the objectives, parameters, variables, constraints and priorities related to operations research (Winston, 2004; Bertrand and Fransoo, 2002). The parameters and variables have multidimensional relations, with a primary and derivate structure (Schrage, 1981), aligning with the five principal drivers of the supply chain (Chopra and Meindl, 2013). The purpose of the above models is to cut down the victims’ suffering by pre-positioning emergency supplies in PODs by using the models which have proven their efficiency in recent humanitarian processes (Gralla et al., 2016; Brito et al., 2015; Noyan, 2012; Rawls and Turnquist, 2010).
Duhamel et al. (2016) have developed a mathematical and heuristic model that takes into account the impact of the distribution of relief supplies on the population in order to solve the problem of the allocation of facilities over the course of multiple disaster events, taking into consideration the logistical limitations of financial and human resources. Also, Choi and Hanaoka (2017) have developed a method to design the spaces prepared for emergency workers and the preparation area to carry out the classification, storage, loading and unloading of relief items in a humanitarian base airport; this model was applied at Shizuoka Airport to cover the maximum number of estimated emergency workers and the affected population, providing operational information for the disaster response planning efforts of the local and central governments and also international humanitarian organizations.
Maharjan and Hanaoka (2018) delineate a multi-actor multi-objective optimization approach for locating temporary logistics hubs during disaster response and optimize the humanitarian logistics PODs. This model proposes minimizing two objectives: the cost and the breach of demand. It uses a method based on fuzzy numbers in order to define the weight and importance of each objective as a part of the optimization process by considering perceptions of the objectives of a group of decision makers. In this study, no variable regarding uncertainty was taken into consideration, and Nepal’s earthquake data were used to apply the model. Fahimnia and Jabbarzadeh (2016) propose a multi-objective model to optimize the characteristics of the sustainability performance scoring method and stochastic fuzzy goal programming approach in order to perform a dynamic analysis of sustainable equilibrium and design a supply chain that is resilient and sustainable. Burkart et al. (2017) use multi-objective modeling to solve the location and routing problem. Elluru et al. (2017) present a distribution model based on the location-routing model with windows of time using a proactive and a reactive focus. In their work, the proactive model takes into consideration the risk associated with each installation (the proactive preparation of the humanitarian infrastructure and materials to be distributed) before the occurrence of a disaster, incorporating the interruptions caused, and recalculates the route and the optimal facilities to satisfy the maximum demand and minimize cost. On the other hand, the reactive model incorporates interrupted routes and recalculates the distribution to minimize the negative effects caused by the delays. Additionally, Kaur and Singh (2016) use a model to minimize the carbon footprint in the humanitarian logistics process by using the cap-and-trade method.
Tayal and Singh (2017) use stochastic functions to represent demand fluctuations over multiple periods to design optimal layout locations for disaster relief using a multi-objective model, and their paper demonstrates that demand fluctuations can be handled through efficient layout design for post-disaster relief. The review of optimization models for large-scale networks (Bayram, 2016) proposes future research be done regarding models for traffic assignment, evacuation (deterministic and stochastic), the location of shelters and multi-modal transport. Additional recent research has focused on developing a framework to understand effective risk management strategies, taking into consideration the cause and source of supply chain disruption (DuHadway et al., 2017) and a framework model for aid allocation (Coles et al., 2017). Laguna-Salvadó et al. (2018) propose a master planning model of decision support systems (DSS) with multiple objectives for managing the sustainability of humanitarian supply chains (HSCs) and define metrics to measure performance. The optimization algorithm integrates the knowledge of the prioritization of planning performance objectives and the experience of the decision makers in the sustainable management of the HSC.
2.4 The Peruvian context
Peru is a country with significant environmental vulnerabilities and a high incidence of natural disasters. Between 1970 and 2009, it had 105 events with 18m people affected. In recent years (1982, 1997 and 2017), the El Niño Phenomenon has had an extremely intense impact on the Peruvian coast, causing a financial loss of $8bn each time (Superintendencia de Administración Tributaria, 2017). The earthquake in Pisco in 2007 generated damages of $2bn (BID, 2011). Lima, the capital of Peru, ranks 30th among the world’s most populous cities (United Nations Department of Economic and Social Affairs, 2014) and is facing steady growth caused by the city’s natural birth rate and a high rate of internal migration.
Peru has a disaster management plan which starts with the preparedness model to prevent vulnerability to natural disasters. This model focuses on the citizens and generates well-being in a humanitarian crisis through preventative measures. The model also increases the visibility of humanitarian crises, manages disasters in an effective and efficient manner, reduces the impact of the disasters, takes into consideration uncertainty, coordinates between different public stakeholders and protects society against vulnerability in a high-risk scenario. This model has five strategic organizations: National Institute of Civil Defense (INDECI), National System for Risk and Disaster Management (SINAGERD), Operational Center of National Emergencies (COEN), Damage Assessment and Needs Analysis (EDAN) and National Information System for Response and Rehabilitation (SINPAD).
The National Institute of Civil Defense (INDECI) is a technical organization in charge of coordinating, facilitating and controlling the National Disaster Plan (Presidencia del Consejo de Ministros (PCM), 2011a), whereas the National System for Risk and Disaster Management (SINAGERD) sets a prospective risk estimation of the disasters (Presidencia del Consejo de Ministros, 2011b). On the other hand, the Operational Center of National Emergencies (COEN) is a reactive management organization; its functions are monitoring (hazards, emergencies and disasters) and managing official information (Presidencia del Consejo de Ministros, 2015). Damage Assessment and Needs Analysis (EDAN) collects information (quantitative, qualitative, structured and unstructured) for the disaster database and establishes the real situation for the response phase (Presidencia del Consejo de Ministros, 2016), and the National Information System for Response and Rehabilitation (SINPAD), when disasters occur, presents the consolidated information which comes from all the different governmental institutions (Presidencia del Consejo de Ministros, 2011b).
3. Methodology
The modeling of the system has its fundamental basis in vehicle routing research (Balcik et al., 2010; Tzeng et al., 2007), materials flow (Vitoriano et al., 2011) and the pre-positioning of emergency warehouses (Brito et al., 2015; Noyan, 2012; Rawls and Turnquist, 2010). These models look for deterministic solutions; also, some of them take into consideration uncertainty regarding demand and resource availability at the time of a crisis and its influence on cost (Rennemo et al., 2014). The value of perfect information and the value of the stochastic solution are used in order to identify decisions applied in different places, contexts or geographic areas, such as São Luiz do Paraitinga (Buzogany et al., 2016), el Vale do Pariba Paulista (Brito et al., 2015), the Southeast of USA (Noyan, 2012; Rawls and Turnquist, 2011) and Turkey (Barbarosoǧlu and Arda, 2004).
This paper proposes goal programming which takes into account previous models’ uncertainty about demand and resource availability and adds uncertainty variables such as how the selected warehouses are affected by emergencies, the level of donations and the number of affected people. These are important factors to establish demand. Uncertainty is reflected in the objective function, and, at the time of finding an optimal solution, the following goals are taken into consideration: the number of warehouses, the satisfaction of demand, secure inventory compliance level and the budget. The soft constraints are modeled in the constraints section.
The constraints have taken into account the coverage of demand, inventory, transport and warehouse capacity, in addition to the influence of random variables. This model includes additional elements to provide a more realistic approach to a crisis event. In particular, the problem of determining warehouse location to be installed is address, taking the variables’ randomization and the uncertainty inherent in a crisis situation into account.
3.1 Formulation of the model
3.1.1 Area characterization model
The area characterization model is generated from three layers of the area being studied: the geographical layer, the urban layer and the risk layer. The three layers and their data are obtained from official sources, such as the Red Cross Manual, the UN’s Sphere Project and in the case of Peru, other official sources (Agencia de Cooperación Internacional del Japón, 1988, 2013; Instituto Nacional de Defensa Civil (INDECI), 2010; Young and Harvey, 2004).
The three-layer characterization starts with geographical layer, which focuses on recognizing features of the terrain, such as rivers; intermittent streams; hilly or mountainous terrain; the natural phenomena of the area, such as landslides, rock falls and riverbank erosion (due to floods and overflows); hydrography and seismicity. The urban layer focuses on describing the city, such as the number of inhabitants and population density, building location, construction type, land use distribution (commercial, residential and rural), overall coverage of basic services (water, electricity and telephone) and the road system (roads, railroad tracks and highways). The risk layer uses two sources to identify critical areas. The first source is the type of hazards in an area: geological, hydrological, meteorological or geotechnical, as well as the environmental conditions. The second source includes factors related to the vulnerability of an area, such as the vulnerability of public services and economic activities and the population density at risk. The relationship between hazards and vulnerability generates the identification of critical areas. These layers allow for the characterization of the study areas as well as the identification of warehouses and PODs. Geographical Information System was the tool used to view and present the layer data, so that the distribution area was within a distance of 500 m from the centroid of each area (Young and Harvey, 2004). In this way, it was possible to build a risk map that identified areas of medium and high risk (landslides, rock falls, riverbank erosion, seismicity and hydrography). Two criteria were established for the delivery of humanitarian aid to the victims: first, who must make the transfer to and from the PODs and second, the maximum travel distance between a POD and the victims. One of this paper’s suppositions is that the victims must move from their homes to the PODs to receive humanitarian aid, and 500 m has been defined as the greatest distance a person must travel to obtain humanitarian aid. This is how PODs were defined. After the characterization, the study area can be determined with greater accuracy, using a model that supports impactful decision making.
3.1.2 Definition of the variables and parameters of the optimization model
The variables and parameters of the model are grouped according to their features: materials, warehouses, PODs, scenarios and periods (Schrage, 1989; Winston, 2004).
Materials are composed of humanitarian assistance goods set aside for affected people. These goods and their features depend on the type of disaster; in this paper’s case study, landslides and floods are the most frequent, and the main sources for determining necessary materials include the Sphere Project (Gostelow, 1999; The Sphere Project, 2011), the Logistical Plan for Emergency or Disaster Humanitarian Assistance (Instituto Nacional de Defensa Civil, 2014) and the Program to Protect the River Basins and Rural and Susceptible Populations from Floods in Peru (Agencia de Cooperación Internacional del Japón, 2013). Three sources of materials were included: the pre-existing inventory of the affected people (safety stock), purchases and donations. The last source can be subdivided into monetary donations, non-monetary donations and donations of services. The following are the materials’ parameters: e represents the available amount of each material measured in kilograms, fv is the volume of each material measured in cubic meters, media the average of donations measured in kilograms, dst is the standard deviation of donations measured in kilograms, peso is the weight of each material measured in kilograms, req is the amount of material needed per person measured in units per cycle and costo represents the cost per kilogram for materials measured in US dollars.
Warehouses aim to consolidate the materials and distribute them to the PODs as soon as possible. The warehouses are used for the storage, consolidation and processing of emergency packages, which include materials such as a change of clothes, food and water, for delivery to the PODs. The warehouses have the following parameters: g is the installation fixed cost measured in US dollars; capKg is the capacity of each warehouse measured in kilograms. The warehouse variables are the following: X is a binary variable which represents if a warehouse is open or not, and AC is a random variable which indicates if the warehouse is available or not, depending on whether the warehouse has been seriously impacted by a disaster. The uncertainty of AC will be expressed with a probability distribution obtained from data provided by official agencies (for this case study, a binomial probability distribution was used) based on Brito et al. (2015).
The PODs are places in the study areas which possess a random variable afectados, which stands for the number of people affected by a disaster, according to the type of disaster. It is based on data obtained from official agencies.
The scenarios are analyzed according to their risk category: high, medium or low. The first scenario-related variable is li, which indicates the increase of warehousing capacity by percentage points. The next variable is prob, which is the probability of the occurrence of a high, medium and low risk event, where the risk event is defined by the product of the hazard and vulnerability (defined in the risk layer). The last variable is idx, which is the index of the scenario type. Periods have crecimiento as a parameter.
The combination of the elements presented above, materials, warehouses, PODs, scenarios and periods, brings new variables and parameters together, according to their features: D × M, M × P, D × P, D × M × P, P × M × P and D × P × M × P.
D × M is comprised of warehouses and materials. It indicates how many materials will be sent to the warehouses. Its parameters are the warehouse’s capacity measured in kilograms with the variable l; the variable ne is the expected level of inventory for each warehouse. M × P is comprised of materials and period, with a random variable of donations called DN_Total distributed normally, with a mean and standard deviation established by donations in prior periods. D × P is composed of warehouses and distribution points; it represents the flow from warehouses to the PODs. Its parameters are a, cp, cv and distancia, where a is a binary parameter which indicates if the supplies from each warehouse can reach each distribution area, cp is the transport capacity measured in kilograms, cv is the transport capacity measured in cubic meters; and distancia is measured as the distance from each warehouse to each POD in kilometers.
D × M × P is composed of warehouses, materials and periods. Its variables are S and CO, where S, which is measured in kilograms, is the inventory that was assigned, and CO the purchases measured in kilograms; the variables Dne and Ene are the excesses or defects of the assigned safety inventory. Dn represents donations assigned to each warehouse for each period. P × M × P is composed of PODs, materials and period. This group indicates the demand for the materials that will be transferred to different PODs in order to be delivered to the affected people. This process must ensure that no inventory is lost and assure the traceability of materials, reporting arrivals, transfers and final delivery to the affected people. The variable F indicates the amount of materials which are not delivered, D is the demand for material in each area, Dmin the minimum amount for each area.
D × P × M × P is comprised of warehouses, PODs, materials and period. It has T as a variable measured in kilograms. The variable T represents the amount of materials to be sent from each warehouse and to different PODs in order to help the affected people access humanitarian aid as soon as possible, prioritizing the demand of the at-risk population and also taking into account potential restraints on access, both constraints on reception from the central warehouse and constraints on the transit of the affected population to the PODs.
3.1.3 The objective function
To solve the objective function, goal programming will be used. The purpose of this programming is to minimize the unwanted deviation variables and seek a sufficient and satisfactory solution. The objective function meets four goals: the number of open warehouses, demand, safety stock fulfillment and total cost. The fulfillment of each goal has a weight factor related to the relative importance of the fulfillment of that objective. This research seeks to generalize the pre-positioning models in order to obtain a response in case of disasters by using a goal modeling to determine the number of open warehouses, fulfillment of demand, fulfillment of safety inventory and total cost. The following equation shows the function objective, which seeks to minimize the penalty for exceeding the number of open warehouses for not meeting the demand, and also for exceeding the desired safety stock and budget:
3.1.4 Constraints
The first group of constraints is the goal constraints; they measure excess or defect in meeting the desired goal. In some cases, they could be called soft or flexible if they may not be strictly enforced:
The goal number of warehouses, the constant M_despósitos is established by the areas’ characterization, and the variables Ddep and Edep indicate the deviation (defect or excess) when M_depósitos is constant, according to the following equation:
where is the total of open warehouses.(2)The demand goal is the constant M_faltante, which indicates the missing quantity to be dealt within the model. It is measured in kilograms. The variables Ddem and Edem represent the deviation corresponding to the value M_faltante, according to the following equation:
where is the total of missing material in the PODs during the periods.(3)For the goal of safety inventory fulfillment, the constant M_inventario indicates the missing inventory level, and the variable Eis indicates the excess of the established missing inventory level, according to the following equation:
where is the inventory level of every single material in the warehouses during the periods.(4)The goal of total cost represents the sum of transport, installation and purchase costs, which should not exceed the assigned budget; total cost is M_presupuesto, according to the following equation:
where Dcosto and Ecosto indicate the deviation (defect or excess), taking the constant M_presupuesto into consideration.
The system’s hard constraints, based on the first and second stage model of Brito et al. (2015), are the following:
The first constraint (Equation (6)) represents the initial inventory; for each material, it should be less than the amount of material available:
(6)The second Constraint (Equation (7)) indicates the delivery of every single donation to different warehouses:
(7)The third constraint (Equation (8)) indicates that the inventory must be less than the storage capacity of each warehouse:
(8)The fouth constraint (Equation (9)) establishes the balance of the assigned inventory level, taking into consideration an excess Ene or defect Dne at the level expected:
(9)The fifth constraint (Equation (10)) is based on coverage constraint: each point is serviced by at least one warehouse:
(10)The sixth constraint indicates maximum number of warehouses:
(11)The seventh constraint indicates minimum number of warehouses:
(12)The eigth constraint (Equation (13)) considers the delivery of every single material – safety stock, purchase and donations – to each area of distribution:
(13)The ninth constraint (Equation (14)) indicates both the additional capacity and the quantity to be sent to each POD. The variable lid indicates an additional percentage of a temporary inventory, if necessary:
(14)The tenth constraint (Equation (15)) considers the materials that have not been delivered to the PODs:
(15)The 11th constraint (Equation (16)) states that the transport amount measured in kilograms must not exceed the transport capacity of each warehouse in kilograms, to each POD:
(16)The last constraint (Equation (17)) indicates that the amount of transported volume must not exceed the transport capacity measured in cubic meters, for each warehouse to each point of distribution:
The first step of the procedure is a deterministic analysis which does not take into account uncertainties. With these deterministic values for all the variables of the problem, the optimization algorithm will determine the location of distribution warehouses, taking into account the number of goals for the warehouses (Equation (2)), and installation cost, the initial inventory constraints (Equation (6)), warehouse coverage (Equation (10)), the maximum quantity of warehouses (Equation (11)) and the minimum quantity of warehouses to be installed (Equation (12)). The result obtained will be compared to the optimization result, taking uncertainty into account.
The second step takes into consideration the uncertainty of the variables. Then the procedure will determine stochastic phases with the random variables per period for the total donations for the affected people, capacity increase, the probability of having the venue available and the type of disaster. The values of the variables will be determined according to the generated stochastic values; these are the donations that go to each distribution warehouse, the inventory of material per warehouse and the purchase of materials per warehouse. The levels of deviation will be measured (excess or defect) with the level of safety inventory, the amount of missing material in each area and the demand for materials for each area. Each stochastic stage represents a period of time that will be resolved, finding a solution that best meets the goals before finding the solution for the following period. Each stochastic stage complies with the goals: the number of warehouses to be installed (Equation (2)), the fulfillment of the demand (Equation (3)), the compliance of safety inventory (Equation (4)) and the total cost (Equation (5)). The procedure will take all the constraints of the model into consideration.
The optimization process starts with the random sampling of values from the probability distributions, which shape the random variables included. The optimization is performed, and an optimum value is obtained with these values for the random variables, the parameters and the variables of the problem. This procedure is executed interactively 10,000 times so that a sample of random variables is taken for each phase and the optimization process is repeated. As a final result, it is possible to obtain the distribution of the optimal values obtained for each simulation of uncertainty (random variables). With these distributions, the expected value represents the optimal decision for the problem.
4. Findings and analysis
In this section, the application of the proposed model is presented. The city of Chosica is located in Lurigancho district. It is 25 km from the center of Lima, the capital of Peru. The selection of Chosica was based on the preferred method, preference ranking organization method for enrichment evaluation (PROMETHEE), as a tool to evaluate criteria to select the study area (Brans et al., 1986). The selected study area was the city of Chosica, one of the areas with the most landslides in Peru, especially during the summer (from December to March) (Municipalidad de Lurigancho, 2005). Each year, the disaster management cycle can be documented: response, rehabilitation, mitigation and preparedness. The city of Chosica is in a state of constant rehabilitation, which has an impact on its regional stability. It also reduces the community’s opportunities to grow, as well as increases the possibility that Chosica could become an unsustainable region and disappear in the future (Presidencia del Consejo de Ministros, 2017; Muñoz, 2016; Municipalidad de Lurigancho, 2005).
In this section, the proposed methodology will be carried out in order to implement a resilience plan in the city of Chosica (Organización de las Naciones Unidas, 2012).
4.1 Selection of the case study
The selection of the site for the case study applied the PROMETHEE (Timperio et al., 2015). This multi-criteria method enables decision making by taking into consideration multiple scenarios, actors and criteria (Saaty, 2008; Brans et al., 1986). The first step was the selection of the capital of Peru, Lima. This capital is located in the Pacific Ring of Fire, a sector with a high level of seismic activity and with many natural hazards, such as the warming of ocean waters known as the El Niño Effect. Lima has an estimated population of almost 10 millions of people living in 43 districts and with a mean density of 3,690 people per km2 (The World Bank Group, 2017). This city is prone to crisis situations due to its high concentration of inhabitants in urban areas and its geographic location (United Nations Office for Disaster Risk Reduction, 2017). The second step was to collect the number of vulnerable housing units for all 43 districts. In the case of Peru, statistical data were extracted from the National Institute of Statistics (INEI, its acronym in Spanish), the amount of monthly rainfall from the Meteorological and Hydrography Service (SENAMHI, its acronym in Spanish), the number of people at risk, according to reports from the Institute of Civil Defense (INDECI, its acronym in Spanish) and an analysis of vulnerable agricultural areas, identified by the Agriculture Ministry (MINAG, its acronym in Spanish). The data from each district were processed using the PROMEHTHEE method and a ranking by priority was obtained. The main results of the method were Lurigancho (+0.75), Chaclacayo (+0.71), San Martín de Porras (+0.54), San Juan de Lurigancho (+0.50), Ate (+0.46) and Rímac (+0.17); subsequently, the most vulnerable city in Lurigancho, Chosica, was selected.
The city of Chosica is highly vulnerable and at risk to disasters due to its uncontrolled urban sprawl toward gullies, intermittent river channels and flood zones (Municipalidad de Lurigancho, 2005; Presidencia del Consejo de Ministros, 2017).
4.2 Model of the characterization of the area
The characterization of the area of Chosica was carried out in three layers: geographic, urban and risk, in order to design and develop the model of the city by identifying critical areas as well as proposing public disaster prevention policies.
The River Rímac is the most influential element in the geographic layer of Chosica. The city is located in the river basin on both the north and south bank of the river at an altitude of 861 m above sea level and has a total area of 236.47 km2. The city has nine intermittent streams: Quirio, Pedregal, La Libertad, Carosio, Corral, California, La Cantuta, Santo Domingo and La Ronda (Instituto Nacional de Defensa Civil, 2014; Municipalidad de Lurigancho, 2005; Presidencia del Consejo de Ministros, 2017). These intermittent streams are an important risk factor due to the landslides, locally known as huaicos, which they cause. Rock falls are common on steep hills, and the erosion of riverbanks occurs during the rainy season of the Peruvian highlands, between December and March (Municipalidad de Lurigancho, 2005: Agencia de Cooperación Internacional del Japón, 1988, 2013).
Chosica’s urban layer covers 7.83 km2. It has 92,209 inhabitants, with a density of 389.93 inhabitants per km2 (Compañia Peruana de Estudio de Mercados y Opinion Pública (CPI), 2017; Municipalidad de Lurigancho-Chosica, 2015). Fully 52.2 percent of Chosica’s inhabitants are economically active, and most people work in the service sector (64 percent) (Municipalidad de Lurigancho, 2005). Most economic activity is concentrated along Lima Avenue, the main street: hotels, restaurants, educational institutions, shops and factories can be found there. Regarding land distribution in Chosica, 42.6 percent is zoned residential, and another 12.8 percent is covered in urban infrastructure, such as schools, hospitals, recreation centers, etc. The other 44.6 percent of land is for agricultural use or is unused, such as streams, hills and riverbeds. Almost all of the buildings are habitable (Municipalidad de Lurigancho, 2005). Drinking water and sewage services reach 69.70 percent of urbanized areas, and public lighting coverage is 85 percent.
The risk layer deals with the potential hazards and the vulnerability of an area. Hazards are related to the probability of a natural or anthropogenic disaster affecting the population. Highly hazardous areas are found along the intermittent rivers and on the banks of the Rímac, as well as on the slopes of the hills (where there could be rock falls) and in areas of urban development (where the potential danger comes from floods). The peripheral areas of the city are located in the danger zone (Agencia de Cooperación Internacional del Japón, 1988, 2013; Municipalidad de Lurigancho, 2005). Vulnerability is related to the probability of an effect on services and human activities. The highly vulnerable areas are located in San Antonio de Pedregal, Nicolás de Piérola, the commercial area around the suspension bridge, as well as the Santo Domingo and Chacracoto shantytowns, which are located on hillsides (Municipalidad de Lurigancho, 2005; Presidencia del Consejo de Ministros, 2017). The flood season of 2017 was the strongest it has been in the past 40 years. Heavy rains in the Peruvian highlands led to an activation of intermittent streams and an increase in the flow of the River Rímac. The subsequent crisis situation affected 7,058 people, 949 homes and 36 schools and destroyed 243 homes, 3 bridges and 126 km of roads and waterways, and it also led to the restriction of electric services for several weeks (Presidencia del Consejo de Ministros, 2017).
Multiple areas were selected from the risk areas identified on the risk maps and from urban information provided by Instituto Nacional de Defensa Civil (2005), and areas were joined or divided until the distance from the centroid of the selected areas to the POD was reasonable. After defining the three layers of the characterization model (geographic, urban and risk), it was possible to identify 19 critical points of Chosica: Corrales, Carossio, La Libertad, Zona Central, Arequipa, El Pedregal, Quirio, Sierra, Yanacoto, Área Recreativa, Cañaverales, Santo Domingo, La Cantuta, Mariscal Castilla, La Ronda and La Florida. A humanitarian aid POD should cover the needs of each critical point, so that the coverage area of the POD was defined as “within a distance of 500 meters from the centroid” so that victims could access it (Young and Harvey, 2004) to receive humanitarian aid according to the criteria presented in Section 3.1.1. Of the 19 PODs (parish churches, schools and stadiums), 13 are located to the north of the River Rímac and 6 to the south. The level of risk and POD distance are the factors which were used to perform network optimization to identify the possible locations of the warehouses, taking into consideration lower risk areas. Five warehouses were identified as possible locations in areas with the greatest number of projected victims; three of them were located to the north of the River Rímac and two of them to the south. They were mostly located between intermittent streams. The first one was located between Santa María and the intermittent Quirio stream; the second was between Quirio and Pedregal streams; the third was between Pedregal and La Libertad streams; the fourth was between La Cantuta and Santo Domingo streams and finally the fifth was between Santo Domingo and La Ronda streams.
4.3 Definition of parameters and variables of the optimization model for Chosica
The characterization of Chosica led to the identification of the parameters for the model groups: materials, warehouses, PODs and scenarios.
The materials to be distributed for humanitarian aid in Chosica have to match its temperate climate of 18.0°C, with dry air and low humidity, and respond to the most common types of natural disasters it faces, which are mainly landslides, floods and rock falls. The humanitarian aid materials are the following: a family sized tent, a blanket, a change of clothes, a kit of utensils (plate, cup and spoon), food rations for ten days (rice, noodles, oatmeal, Panamito beans, lentils, sugar, vegetable oil and canned tuna), as well as water (2.5–3 liters per day). The volume (fv in m3), the unit weight (peso in kilograms) and the requirements per person (req in unit/person) were established according to the humanitarian aid manual of OCHA (Naciones Unidas Oficina de Coordinación de Asuntos Humanitarios, 2017). The cost of each set of materials (costo in American Dollars), the available quantity (e in Kilograms) and the level of donations (media and dst in Kilograms) were obtained from official sources and in response to the year 2017 (Presidencia del Consejo de Ministros, 2017) (Table I).
Materials
| Materials | Cost ($/kg) | media (kg) | SD (kg) | Volume m3/und (fv) | Weight kg/und (peso) | Material needed per cycle (req) | Available amount kg (e) | Cycle |
|---|---|---|---|---|---|---|---|---|
| Family sized tent | 15.00 | 18,000.00 | 3,600.00 | 0.1800 | 8.0000 | 0.2000 | 2,000.00 | 30.0000 |
| Blanket | 10.00 | 2,000.00 | 400.00 | 0.0060 | 4.0000 | 1.0000 | 1,500.00 | 30.0000 |
| Change of clothes | 3.50 | 5,000.00 | 1,000.00 | 0.0060 | 4.0000 | 1.0000 | 1,500.00 | 30.0000 |
| Utensils kit (dish, glass and spoon) | 2.00 | 3,000.00 | 600.00 | 0.1130 | 2.0000 | 0.2000 | 485.69 | 30.0000 |
| Rice | 1.00 | 1,000.00 | 200.00 | 0.0010 | 1.0000 | 2.0000 | 5,654.62 | 10.0000 |
| Noodles | 0.60 | 1,000.00 | 200.00 | 0.0005 | 0.5000 | 1.0000 | 19,542.10 | 10.0000 |
| Oatmeal | 1.00 | 1,000.00 | 200.00 | 0.0002 | 0.2000 | 1.0000 | 20.00 | 10.0000 |
| Panamito bean | 1.00 | 1,000.00 | 200.00 | 0.0005 | 0.5000 | 1.0000 | 394.50 | 10.0000 |
| Lentil | 1.00 | 1,000.00 | 200.00 | 0.0005 | 0.5000 | 1.0000 | 891.07 | 10.0000 |
| Split peas | 1.00 | 1,000.00 | 200.00 | 0.0005 | 0.5000 | 1.0000 | 3,762.03 | 10.0000 |
| Sugar | 1.10 | 1,000.00 | 200.00 | 0.0010 | 1.0000 | 0.4000 | 898.99 | 10.0000 |
| Vegetable oil | 10.00 | 1,000.00 | 200.00 | 0.0002 | 0.2000 | 2.0000 | 6,160.71 | 10.0000 |
| Water | 1.00 | 1,000.00 | 200.00 | 0.0010 | 1.0000 | 2.5000 | 1,000.00 | 10.0000 |
| Canned tuna | 5.00 | 1,000.00 | 200.00 | 0.0002 | 0.1800 | 3.5290 | 1,960.00 | 10.0000 |
The characteristics of the five warehouses which were identified in the characterization model are as follows: an influence area of 7.83 km2, a capacity of 20 tons (capKg in kilograms), an annual fixed cost (g is the fixed cost of installations in American dollars) and an area of 200 m2. The aim was to be able to consolidate the materials and distribute them to the POD as soon as possible. The warehouses should have a minimum height of 2.5 m and an additional 40 percent so that materials can be handled and transferred (Naciones Unidas Oficina de Coordinación de Asuntos Humanitarios, 2017). The aperture of binary variables (X) and the availability of random variables (AC) of the model.
The 19 geo-positioned PODs are found in Table II, which indicates the area, urban characteristics, present use and the latitude and longitude. Column 1 shows the codification of the distribution point; Column 2 shows the present use or category; Column 3 indicates the name; and finally, the last two columns show the latitude and longitude. These are public places with enough space to meet victims’ needs: schools, churches and stadiums.
Location of points of distribution
| Area | Category | Name | Latitude | Longitude |
|---|---|---|---|---|
| 1 | Parish Church | Don Bosco housing | −11.9213 | −76.6759 |
| 2 | Parish Church | San Juan Bosco | −11.9254 | −76.6849 |
| 3 | School | Ricardo Palma de Chosica | −11.9294 | −76.6912 |
| 4 | Parish Church | Santo Toribio de Mogrovejo | −11.9362 | −76.6975 |
| 5 | School | Colegio 103 | −11.9277 | −76.7021 |
| 6 | School | Un niño un amanecer | −11.9360 | −76.7039 |
| 7 | Stadium | San Miguel | −11.9391 | −76.7015 |
| 8 | Church | Iglesia de Dios | −11.9353 | −76.7158 |
| 9 | Parish Church | San Nicolás de Tolentino | −11.9400 | −76.7121 |
| 10 | Parish Church | San José de Cluny Chapel | −11.9434 | −76.7085 |
| 11 | Parish Church | Cristo Rey Chapel | −11.9478 | −76.7167 |
| 12 | New | Santa Rosa Yanacocha Church | −11.9456 | −76.7274 |
| 13 | New | Adertel Club | −11.9499 | −76.7235 |
| 14 | New | Adventista Sinaí Church | −11.9248 | −76.6786 |
| 15 | School | Pablo Patrón | −11.9276 | −76.6854 |
| 16 | Church | San Fernando | −11.9333 | −76.6895 |
| 17 | Coliseum | Carmela Estella | −11.9376 | −76.6933 |
| 18 | Stadium | Municipal Solías García | −11.9416 | −76.6960 |
| 19 | University | Nacional de Educación Enrique Guzmán | −11.9467 | −76.7060 |
The configuration of the supply chain took into account the relocation of warehouses to safe areas in order to enable their operation in a crisis situation. The data that were used for the execution of the goal programming optimization model were estimated, adapted or projected according to the proposed methodology.
The objective function of the model has four goals. The proposed solution sought compliance with these goals through the minimization of the deviation variables. First, the number of future warehouses, through the constant M_depósitos, was established as three. Second, it was also established that the target of demand satisfaction, with its constant M_faltante, has a tolerance limit for missing materials equivalent to the capacity of a 13,500 kg truck, which could carry the enough food for 1,000 people to eat for a day. That is to say, the goal is to meet the affected people’s needs with a margin of error that can be corrected promptly, transporting the missing material with a cargo vehicle. The third goal is to reach total compliance with the safety stock requirements; the constant M_inventario indicates the missing material to cover the missing safety stock, with a target of zero. Finally, the fourth goal established the total budget, with the constant M_presupuesto, of $3,000,000, in order to meet the needs of the PODs.
The probability levels of low, medium and high risk which were used in the scenarios were 0.27, 0.33 and 0.40 and were estimated using historical information from Instituto Nacional de Defensa Civil (2017). The configuration of the warehouses took into consideration the warehouse capacity and the material required to handle emergencies. The capacity (l) was 480,000 kilos, estimated from the total material needed to assist the affected people in case of a low-intensity event. The minimum inventory taken into consideration is 20 percent of the capacity level of each warehouse distributed according to the expected amount of each material (ne). Each POD must be supplied by one or more warehouses, established through the binary variable (a), calculated from the matrix distancias. It was determined that 3.5 km is the distance which allows the coverage requirements of each point to be met. Also, the transport capacity in kilograms (cp) was 30,000 kg (30 tons) and 60 m3 in volume (cv). The transportation cost per kilogram was 0.001 American dollars.
The parameters which were used for the simulation of random variables are shown in Table III. These variables are included in the model to represent uncertainty, where M is the mean and S is the standard deviation.
Random variables
| Variable | Distribution | Parameters |
|---|---|---|
| AC | Binomial | p=0.59 |
| afectados | Discrete | Matrix of 19 × 3 |
| Dn_Total(Family sized tent, p) | Normal | M=18,000, SD=3,600 |
| Dn_Total(Blanket, p) | Normal | M=2,000, SD=400 |
| Dn_Total(Change of clothes, p) | Normal | M=5,000, SD=1,000 |
| Dn_Total(Utensils kit, p) | Normal | M=3,000, SD=600 |
| Dn_Total(Rice, p) | Normal | M=1,000, SD=200 |
| Dn_Total(Noodles, p) | Normal | M=1,000, SD=200 |
| Dn_Total(Oatmeal, p) | Normal | M=1,000, SD=200 |
| Dn_Total(Panamito bean, p) | Normal | M=1,000, SD=200 |
| Dn_Total(Lentil, p) | Normal | M=1,000, SD=200 |
| Dn_Total(Split peas, p) | Normal | M=1,000, SD=200 |
| Dn_Total(Sugar, p) | Normal | M=1,000, SD=200 |
| Dn_Total(Vegetable oil, p) | Normal | M=1,000, SD=200 |
| Dn_Total(Water, p) | Normal | M=1,000, SD=200 |
| Dn_Total(Canned tuna, p) | Normal | M=1,000, SD=200 |
| lid | Discrete | {0.27, 0.33, 0.40} |
The population was estimated in each POD through an exponential smoothing projection based on historical values. The number of affected people (afectados) takes into consideration the number of inhabitants at each POD and the level of danger and vulnerability, according to the information given for the risk scenario (high, medium, and low risk). The required levels (req) of materials (Table I) take into consideration the number of affected people in each risk scenario, as well as the inventory that was assigned to each warehouse (s) and the amount of purchases (co) of each material.
4.4 Chosica results
The solution for the Chosica case study model was carried out in Lingo 17 solver and modeler using structured language and ole functionality to extract and write data from Excel 2016. Lingo had four runs with 2,500 iterations each, 10,000 iterations in total. Each iteration started with the random sampling of variables and continued with the solution in stages. Thus, in each stage, the values generated from the random variables were taken and the optimization was repeated in order to find the best solution for each stage.
First, the location of the PODs was established, taking into consideration the target established in the number of warehouses (Equation (2)), installation costs and the respective restrictions. The other modeled variables were gradually established in the following stages, one for each period included in the model, considering the solution found in the previous stage, attempting to fulfill the goals formulated, until the solution of the scenario in the last stage is found. The results of the obtained goals are shown in Table IV.
Achievement of goals
| Constant | Target value | ||||
|---|---|---|---|---|---|
| Target | Name | Value | Mean | SD | Units |
| M1 (Equation (2)) | M_depósitos | 3 | 4.99 | 7.88×10⁻⁸ | Units |
| M2 (Equation (3)) | M_faltante | 13,500 | 208,465.49 | 305,745.88 | Kilograms |
| M3 (Equation (4)) | M_inventario | 0 | 1.92 × 10⁻¹¹ | 1.47 × 10⁻¹¹ | Kilograms |
| M4 (Equation (5)) | M_presupuesto | 3,000,000 | 4,639,769.81 | 1,432,967.17 | Dollars |
The results show more warehouses must be installed in addition to those mentioned in the first goal. The warehouses are to be installed in the five proposed areas. Furthermore, demand (Equation (3)) was not satisfied, as the values in the variable Edem did not comply with unmet demand: on average, unmet demand was 194,965.49 kg. Regarding materials which are assigned to the crisis area, the results of the stochastic model show that the variable s associated with the assigned inventory per area and per material type corresponds to 100 percent of the minimum inventory established per area. Consequently, the deviations for the goal for having enough safety stock (Equation (4)) show that there is enough of each of the materials for each distribution center.
In relation to the budget goal (Equation (5)), the variable Ecosto reaches an average of $1,639,769.81, which determines the insufficiency of goal and the need for a larger budget in order to meet people’s needs during natural disasters in the Chosica area.
The result of the goal programming model found an expected value (EV) of 21.65, considering all the scenarios. The result of the wait and see is 16.95. The expected value of perfect information (EVPI) is 4.70. This corresponds to the expected improvement of perfect information at 22 percent of the objective function value. This significant percentage makes it possible to affirm that obtaining information generates savings in the budget and better ability to meet demand. These results allowed the needs of 38,647.20 people on average to be met, with a standard deviation of 4,809.31 people.
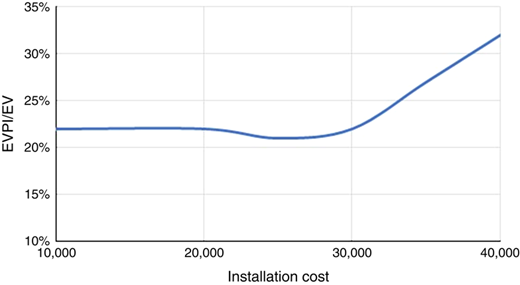
The sensitivity analysis of the values of the deviation variables for the goals when evaluating the EV of the objective function obtained with changes in the warehouses installation costs showed that if the installation cost is higher than the proportion of EVPI with regard to an EV, the sensitivity analysis will be higher, as well. The EVPI values vary from 22 to 32 percent of the EV of the weighted goals. This result can be explained due to the fact that the installation cost is significant, so increasing values will mean the need to install fewer warehouses, as shown in Figure 1.
5. Results and discussion
Humanitarian crises are unique events which generate a number of victims and ever-increasing economic effects. In this paper, a model of the characterization of critical areas has been proposed, using a goal programming optimization model that seeks to indicate the warehouses and PODs, taking into consideration both public and private spaces in order to meet demand, as well as diverse uncertainties in the face of a disaster and regarding the disaster preparedness of communities.
As indicated, Chosica is divided by the River Rímac and there are different intermittent streams which run through multiple densely populated areas, this being a high-risk region prone to different types of disasters. The characterization area model was applied to this region, and 19 PODs were suggested (Table II). These PODs are located on both sides of the river (13 on the right bank of the river and 6 on the left bank). In all cases, the PODs covered very populated areas, and most of the PODs are between two intermittent streams, as in the case of points 1, 2, 3, 4, 5, 6, 8, 9, 11, 12, 15, 16, 18 and 19, which are those that will attend to populations in areas classified as being at a high and very high risk for the landslides and floods that frequently happen in urban areas around the River Rímac as a result of heavy rainfall. Other PODs, as in the case of 7, 10, 13, 14, 17 and 19, are in areas with high risk of flooding, mainly due to the overflowing of the River Rímac and due to landslides and floods caused to heavy rainfall. The results verified the efficiency of the model because it took into consideration the concentration of the population and associated risks, especially in PODs 2, 3, 7, 8, 9, 12, 16, 17 and 18, which are characterized as possessing high and uncontrolled population density; PODs 1, 4, 5, 6, 10, 14, 15 and 19, which are characterized as organized urban areas; or areas with a high concentration of recreational facilities, such as PODs 11, 13 and 19.
Chosica had one warehouse in the last humanitarian crisis, and it was not enough to meet the demand for humanitarian relief. The solution discovered by the goal-based programming model shows that with uncertainty, a greater number of warehouses, materials and budget must be managed (Table IV) in order to meet the demand for all the crisis scenarios evaluated, which indicates the difference in modeling with uncertainty and without uncertainty, with the results shown in EV and in the relation between EVPI and EV (Figure 1). The use of stochastic programming makes it possible to determine that there is a great variance in the necessary budget and in the quantity of missing materials due to the vast range of possible scenarios but that there are also stable inventories and a sufficient number of warehouses which are stable and safe.
The effect of disasters on an urban population, the number of victims and the negative economic consequences, are permanent features in the development and sustainability of humanity. In the event of a disaster, the logistics chain must react immediately. It has been proven that coordination and decision making must be focused on providing the best assistance for the affected people. The proposed model in this study is designed to be used in a focused manner at both first level (local governments) and at higher levels, facilitating the coordination with stakeholders (public, private and academic) to be able to define, from the start, the type and amount of donations and purchases required to assist the affected people and to reduce the suffering of the affected population as soon as possible.
The proposed model presents advantages over other recent models published in this area, as it presents a higher number of goals to be considered in the optimization process, including the representation of a higher number of uncertainty variables, thus allowing this model to address crisis situations as close to the reality of the disaster as possible, which has the potential to support decision making concerning diverse scenarios of humanitarian crises. This model can be applied in a disaster’s life cycle at both the preventive and response stages. In the preventive stage, it allows for the characterization of critical areas, defining the possible locations of warehouses, as well as the inventory levels for effective disaster response. In the response stage, it allows for the rapid revision of the optimization before the possibility of any limitations as a result of the disaster. Thus, the PODs would be corrected, as well as the amount of material to assist the affected people.
6. Managerial and research implications
This research proposes a model that improves the distribution of goods during disaster response in high-risk areas.
6.1 Managerial implications
The proposed model takes into account multiple goals in a humanitarian crisis, and one could weigh the goals differently to adjust priorities and importance according to the needs of each single humanitarian logistics case. Including a stochastic approach helps manage victims’ uncertainty in a crisis, allowing for multiple scenarios to obtain results that are better adjusted to reality. The decision makers should have a clear picture of their priorities in the crisis, and they must process historical information to build possible scenarios to evaluate.
The model suggests a quantity of open warehouses to be located according to the goals to be achieved. The demand satisfaction, safety inventory and total cost goals help decision makers to establish an adequate balance between storage capacity, demand, inventory, transportation and costs.
The PODs will be supplied by adequately located warehouses during the disaster. The decision makers could activate these points to reduce the movement of the population (to less than 500 m); this would prevent suffering and unnecessary risks when crossing a disaster area.
In a disaster, the activation of the PODs can be done remotely with the support of the warehouse personnel and the community. These points can contribute to the collection of information about the damage caused by the disaster. Thus, the affected people will be able to express their requirements and the condition of the infrastructure. The results can facilitate the coordination with stakeholders regarding the amount and type of donations and purchases required to assist the affected people and reduce their suffering as soon as possible.
The anticipated model-derived definition of the PODs will not only reduce suffering but also allow for the rapid and easy implementation of facilities for medical care and evaluation. These PODs will also serve as advanced positions or command centers for dispatching machines, equipment and teams to restore access routes so that the population can mobilize and aid can reach the victims.
6.2 Research implications
The main contribution of this research is the proposal of a model that combines the establishment of operational goals with the uncertainty present in a risk area, one which is applicable in immediate response operations and during the execution of the strategy chosen for each phase in the life cycle of a disaster.
This model can be adapted easily to a real situation. It allows for the goal optimization of humanitarian aid. The uncertainty variables can quickly be incorporated into this model and could be adapted to a specific humanitarian context; the results present the warehouses for each point of distribution taking into account an important factor in the reduction of the victims’ suffering: a short walking distance for the victims in this emergency to receive aid.
This model is applicable throughout the life cycle of a disaster. In the preventive stage, it makes it possible to characterize areas, define possible warehouse locations and define inventory levels for effective response to disasters, and in the response stage, it permits optimization to avoid limitations caused by a disaster.
The PODs are chosen taking into consideration the risk and vulnerability characteristics of the areas with the objective of guaranteeing to those in positions of responsibility and authorities that the victims can receive the humanitarian aid in a short time within a distance of 500 m on foot.
7. Conclusions and directions for future research
7.1 Conclusions
The proposed characterization model of critical areas has allowed for area segmentation to help identify PODs to facilitate a quick and flexible response to the victim-aid operations. This would shorten suffering and ensuring short distance displacement in the case of humanitarian crisis. In addition, the model was developed in order to take uncertainty of disasters in a high-risk area into account, to propose places and facilities for humanitarian logistics, to determine the most appropriate number of warehouses and to promote immediate response to a disaster. One of the main contributions of the proposed model is the inclusion of multiple goals using the goal-based programming technique, and it has also included many variables to support the supply chain, some of which allow for the management of event uncertainty.
Another contribution of the proposed model is that it would allow for the design of a decision support system that assesses multiple crisis scenarios, facilitating the work of the stakeholders.
As a case study, the model was applied in the city of Chosica, Peru, resulting in a distribution system superior to the one currently in use. The implementation of this new distribution system would lessen human misfortune. The city of Chosica was selected due to its high geographic vulnerability and uncontrolled population growth, which is concentrated in high-risk areas such as steep hillsides and the riverbeds of intermittent streams near the River Rímac.
Chosica is an area which continually faces crisis situations. The case study shows the optimization model’s viability in a real context, validating the POD location methodology.
The proposed model would help people face humanitarian crises well prepared in each of the preventative stages or during the actual event, in conjunction with the stakeholders.
7.2 Future research
One suggested future development of this model would be to add a geo-referenced database in order to visualize the movement of the population (simulation by agents). Data could be corrected in real time through the use of sensors (positioning, flow, flow volume, etc.). Moreover, the use of drones to collect data which update the variables in a crisis situation could be explored, so that the characterization model of critical areas could be perfected and goal programming could be implemented in real time.

