


The conquest and plunder of major cities is among the most potent symbols of political decline for a defender and vitality — or barbarity — for the aggressor. The Visigothic sack of Rome in 410 CE, for example, is regarded as a milestone moment in the decline of the Western Roman Empire. Likewise, the Mongols put an end to Bagdad’s golden age with a gruesome frenzy of destruction in 1258 CE. These conquerors qualified as “roving bandits” in the most literal sense, but also insofar as they exhibited qualities predicted by Mancur Olson for rulers (and their retinues) with short time horizons. Mainly, that maximizing loot extraction takes priority over prospective long-term economic returns. We test this proposition using a novel dataset of actor-oriented (i.e., not “natural”) episodes of rapacious extraction and urban destruction in Eurasia from 1 to 1799 CE. To construct this dataset, we rely on a combination of existing sources related to premodern urbanization and major battles throughout Europe and Asia. On one hand, we find support for a historical link between mobility and rapacious extraction episodes in which conquerors subjected their new possessions to plunder and even destruction. However, in contrast to stylized models of time horizons and extraction, we identify military force mobility, not the faction’s (and thus ruler’s) mobility as a robust predictor of rapacious extraction tendencies. Accordingly, we propose a modification of Olson’s model in which aggregate regime (polity, faction, etc.) extractive behavior is primarily a function of principal–agent dynamics grounded in elite-level incentives and time horizons — elite mobility counteracted rulers’ stationary bandit tendencies.
On the morning of May 29, 1453, Constantine XI, Autocrat of the Romans, stood atop the Theodosian Walls in Constantinople. Built during the rule of one of his many predecessors, Theodosius II, the walls had been an impenetrable barrier against foreign invaders for more than a millennium. Numerous forces, including Avars, Arabs, Vikings, Bulgars, and Turks, had tried and failed to get over or through those walls to take the Queen of Cities. For centuries, the walls had kept at bay the cavalries from the east that had ravaged the formerly glorious Roman Empire.
But by that late spring day in 1453, the world had changed. Constantine would have looked out at a massive besieging force of Ottoman Turks. Descended from steppe cavalry warriors, the Ottoman army blended the mobility and martial skill of their steppe ancestors with the latest innovations in military technology found in sedentary societies. The combination had proved irresistible, and the Ottoman force arrayed before Theodosius II’s great legacy was about to usher out the medieval period, the Roman state which had existed for more than 2,000 years, and the idea of walls — even the very best of them — as a true barrier to capable forces. The outcome of May 29, 1453 was not in doubt. Indeed, the defenders had held one final Christian service in the Hagia Sofia the night before (an event which would not be repeated until the aftermath of World War I). The real question was what would Sultan Mehmed II and his forces do with Constantinople once they had it?
History informs us of some of the options conquering armies had. They could simply take charge of a city, replacing some or all of the old top strata of elites with their own and take up the process of collecting and spending revenues that already existed. Alternatively, they could seize the movable wealth of the land and move on, taking it back to their own primary holdings. Even a conqueror intending to add the lands permanently to his domain would still be very tempted to immediately extract wealth from newly conquered lands to enrich the more established parts of his empire [1]. Another option was to simply raze the city to the ground [2].
Ultimately, Constantine XI did not survive to see May 30, 1453, and the city fell, becoming the greatest prize in Ottoman history. Sultan Mehmed II, in victory, plotted a middle course between these options. Ottoman soldiers looted, pillaged, and massacred within certain bounds, while the core holdings of the Roman state — the great and ancient buildings and what little remained of its riches — were seized by the Sultan. Yet, in short order, Constantinople became the capital of the Ottoman Empire and would remain so until its own collapse in the twentieth century. The sacking of Constantinople in 1453 was violent and rapacious, but ultimately definitive — the conquerors did not move on; they remained and supplanted the prior rulers.
Mehmed’s choice was one faced by conquerors for thousands of years across the globe. How does one handle a defeated city? We consider this question anew and argue that the nature of the attacking force helps dictate the choice. Highly mobile military forces have the capacity — and develop the tendency — to venture forth for the purpose of violent, total expropriation even in defiance of their regent. The results of sieges in these cases are highly extractive in nature. Even when rulers have the intention of permanently claiming new land, the centrality of raiding and looting behavior for mobile military elites means that permanent conquest is also associated with pillaging. Meanwhile, factions with less mobile military forces develop different strategic and extractive tendencies due to their different “exit” opportunities for military elites. They more often bow to leaders’ less rapacious tendencies and are more likely to collaborate in the establishment of new sedentary political orders with long time-horizons.
We innovate on traditional analyses of mobility and extraction — “roving” banditry — by considering an additional wrinkle: the differences between the mobility of factions, per se, and the mobility of forces they lead. Mobile tribes, ethnicities, and ruling classes had the ability to move around, freeing them from constraints that encouraged stationary rulers and their cliques to extract in a measured fashion over longer timeframes. The elites they led did not always have the option of easy exit from the group and its hierarchy, and were more often subject to the same incentive structures as rulers who presided over mobile or sedentary factions. Affinities and divergences between ruler and elite incentives are crucial to understanding the political economy of conquest rapacity in premodern times. Specifically, we focus on the importance of force mobility above and beyond faction mobility in describing a victor’s behavior after capturing an urban center. The key was not necessarily the disposition of entire factions and their leaders, but rather the ability of military elites to defect from leaders that did not enable rapacious extraction (e.g., pillaging, razing).
In common political-economic parlance, we discuss the different tendencies to act as roving rather than stationary bandits. Mobile groups with relatively immobile military forces — such as the migratory Visigoths and Franks — were liable to engage in rapacious extraction while itinerant, but had a greater tendency to adopt the posture of a stationary bandit, taking up position to extract slowly and in perpetuity over time as the new potentate in conquered domains (Collins, 2008; Heather, 1999; Young, 2016). Conversely, mobile groups with relatively mobile military forces — notably nomadic cavalry forces from the steppe, as well as those with unique and far-ranging naval capacities, such as the Vikings — displayed resilient tendencies to take on the role of roving bandits, being far more likely to treat successful sieges as an opportunity for looting and destruction.
We test our expectations by looking at urban capture events from 1 through 1799 CE, assessing how the mobile nature of the attackers — both factions and their military forces — coincided with the occurrence of rapacious tendencies during conquest. Our period of interest covers a variety of regions — Europe, the Middle East, the Indian Subcontinent, along with Inner, East, and Southeast Asia — between the high-water mark of Eurasian imperial domination c.1 CE and the nineteenth century [3]. During that period, we find a robust relationship in which force mobility is positively associated with rapacious extraction and destruction while faction mobility is not. This indicates that the ability of the bandit himself to move is not as important as the mobility — and thus bargaining leverage — of the appendages that he uses to extract.
This study presents the moment of triumph not simply one of tragedy (which it very often was, to horrifying degrees), but also one of strategy and political economy. Leaders faced a heavy tension between the wealth and success of their new acquisitions as well as the need to compensate military elites. Very often, leaders with highly mobile forces either chose the most destructive and extractive option, or acceded to ravaging by their capricious subordinates who might otherwise abandon the ruler.
The political economy of predation
Oft-cited models of extraction imagine leaders with differing levels of confidence in their future access to local resources. Rulers with a firm, secure, grasp on political control consider different extraction options in light of longer time horizons — taxation is preferable to looting when long-run dividends are a realistic possibility. Mancur Olson (1993, p. 567) advanced this basic premise with his “stationary” versus “roving” bandits framework:
Under anarchy, uncoordinated competitive theft by “roving bandits” destroys the incentive to invest and produce, leaving little for either the population or the bandits. Both can be better off if a bandit sets himself up as a dictator — a “stationary bandit” who monopolizes and rationalizes theft in the form of taxes. A secure autocrat has an encompassing interest in his domain that leads him to provide a peaceful order and other public goods that increase productivity.
Olson’s thesis makes the distinction between devastating “competitive theft” and more favorable yields that accrue to a ruler with “an encompassing interest in his domain”. Accordingly, extraction from local actors is more likely to be tempered by concerns about long-term output, and thus take on an institutionalized, measured form where the ruler expects he, or his line, will exercise control in perpetuity.
This framework is commonly cited in political science and economics research that identifies specific conditions in which rulers maintain (or discard) predatory postures in weak states — for example, present-day Afghanistan and the Eastern DRC (Murtazashvili and Murtazashvili, 2020; Sánchez De La Sierra, 2020). Given its broad historical scope, our argument also intersects with recent work concerning the technological and political constraints on wealth creation over the long span of premodernity. Hendrickson et al. (2018) propose a connection between military technology and economic prosperity in which military assets are critical for defending economic output from predatory actors that behave as roving bandits. Similarly, Geloso and Salter (2020) argue that defensive capabilities — reflected, broadly, by levels of state capacity — account for the oft-cited association between economic prosperity and state capacity. Only those entities that can defend their underlying wealth endowments reap the rewards over a longer timeframe. We offer a complementary extension to this research agenda by highlighting the foundations of predatory behavior among atypically rapacious actors in the classical, medieval, and early modern periods. Moreover, we build on recent work that highlights premodern shifts from roving loot-oriented extraction to institutionalized, limited taxation (Svendsen, 2020; Young, 2016) by examining two types of mobility associated with roving bandit behavior in premodern Eurasia: faction mobility and force mobility.
While these contributions tend to focus on predation by the state, as a coherent actor, or the individual ruler, our account focuses specifically on the distinction between rulers — whose interests encompass the whole faction’s extractive activities — and military elites that are individually and collectively presented with their own choices with respect to expropriation, defection, etc. Our argument resonates with a mature literature on principal-agent dilemmas in which rulers’ interests diverge from those of exploitative subordinates. To wit: elites might preserve their own share of patronage vis-à-vis redistributive states by promoting administrative weakness — low fiscal capacity results in more rents for elites (Acemoglu et al., 2011; Garfias and Sellars, 2022). Recent scholarship finds evidence for a similar dynamic in premodern contexts such as dynastic China, where prohibitive monitoring costs enabled local officials to impose onerous economic burdens on populations within their jurisdictions (Ma and Rubin, 2019; Sng, 2014).
Likewise, we contribute to a voluminous literature on the political economy of “exit”, in its many forms. Perhaps the most influential model within this genre is one in which the exit capabilities associated with productive assets (e.g., human and financial capital) correspond with diminished extraction by the ruler (or regime), as onerous taxation compels asset holders to exit the polity (Boix, 2003; Stasavage, 2011; Winters, 2011). Our account highlights the pernicious effects of exit on economic prosperity where extractive agents can leverage their exit capabilities when negotiating with the principal for a greater share of spoils obtained through rapacious extraction.
Mobility and rapacious extraction
Beyond its abstract connotation, the “roving bandit” metaphor corresponds with the behaviors of discrete historical groups whose predation was consequential to the political and economic trajectories of empires, societies, and entire continents (Bennett, 2022; Ko et al., 2018; Turchin et al., 2013). The leaders of these groups — Mongols, Goths, Huns, Vikings, etc. — were also faced with choices in how to extract, either venturing forth to pillage and extort before moving on, or extracting slowly from their possessions over time, leaving some portion to stimulate growth. In line with Olson’s framework, these groups initially lacked an “encompassing interest” in conquered realms, and behaved as such. They were depicted by their victims (and sometimes themselves) as brutal loot-seekers entitled to the fruits of conquest (Erskine, 1855, p. 107; Preston et al., 1956, p. 70; Subtelny, 2007, p. 14).
The underlying importance of mobility to extractive behavior is straight-forward. It is relatively easy for mobile groups to engage in (literally) roving banditry. Less mobile groups cannot range far and wide to extract and cannot as quickly or fluidly move on to other targets upon a successful raid. Thus, they are encouraged to set up camp and extract from the local population under an assumption of longer time horizons.
Yet this model misses one key point of differentiation: the mobility of groups, per se, as compared to the mobility of their component military forces. A leader may command an entire people or migratory military band, able to move from place to place, not required to stay in one location to preserve and hold power. The ruler’s “court”, extended household, or faction may travel with them, and wherever they go becomes the center of their temporary domains. Most political groupings in premodern (but post-Paleolithic) times were far less mobile, with their power rooted in specific locations and settled populations that must be closely managed in order to maintain power and control. Group-level mobility is often associated with migratory Germanic confederations that bombarded the Late Roman Empire — Goths, Vandals, Alemanni, Franks, Burgundians, etc. The Eastern Roman Empire faced comparable menaces during the medieval period, as Turkic nomad migrations brought new rivals into the Middle East. These factions were all mobile in the sense that they relocated from distant areas en masse.
On the other hand, a mobile group’s military forces might also differ in mobility, with many leaders presiding over plodding infantry retinues. Such an army was not rapidly mobile. Other armies, however, were based heavily on units of quick, lighter cavalry. The most notable of these were the steppe horsemen that inhabited the nightmares of sedentary inhabitants throughout Europe and Asia for more than 2,000 years. Highly mobile, these forces could range over long distances, take loot in raiding activities, and move on. While nomadic steppe forces are most obvious, others attained mobility through other means. The Vikings, for example, were uniquely mobile during their peak years due to the long range of the longboat and their ability to navigate oceans and rivers, reaching distant locations quickly and with little warning.
In combination, these two different categories — faction mobility and force mobility — imply four possibilities, as displayed in Table 1 along with historical examples. First, there were those migratory factions composed of highly mobile cavalry-based militaries. The most obvious such example was the Mongol Empire, which featured itinerant, pastoral-nomadic tribes comprising the most famous steppe army in world history. Another possibility is of a mobile group that relies on less mobile fighting forces. The Germanic “barbarian” forces that initially occupied Northern Europe in the first centuries CE are a classic example. These groups were highly mobile, without large, developed centers of power that needed continuous elite presence. Yet their armies were largely based around warriors on foot. And though they would over time cross great distances, they did this mostly over periods of decades and even centuries.
Historical factions and groupings associated with different mobility combinations
| Immobile faction | Mobile faction | |
|---|---|---|
| Immobile forces | Most Eurasian Polities |
|
| Mobile forces |
|
|
The next possibility is the immobile faction with mobile forces. This is most seen in the settled conquest states formed by hyper-mobile polities in our first category, after they had invested enough in specific realms that war leaders became settled potentates. Archetypal cases include the postconquest Mongol successor states, the Mughals in India, and the early Ottoman Empire. Political power and competition became linked to major power centers, even as their military forces retained much of the ancestral reliance on mobile forces.
The final category is the immobile faction with immobile forces. This is common of most sedentary polities in relatively urbanized parts of the world for their time. Examples include Western European kingdoms in the Middle Ages, the sedentary domains of East Asia, or the Eastern Roman Empire in Late Antiquity, with leadership and political competition largely delineated by persistent territories, capital cities, coupled with armies heavily reliant on foot soldiers and heavily armored cavalry.
Incentives to transition from roving to stationary bandits operated concurrently on rulers and military elites where both the faction as a whole and its forces were relatively immobile. This is primarily a function of two dynamics: First, comparatively immobile military elites — for example, infantry war bands — were less effective against enemy targets and defensive armies, all else equal, compared to mobile forces that can cover large distances and strike with greater surprise. A smaller contingent of highly mobile defectors can extract more plunder than their less mobile foot-soldier counterparts, lowering the opportunity costs of “solo” plundering relative to collaboration with the ruler in measured extraction. Second, this martial advantage, paired with strictly logistical advantages of mobility, ameliorates the collective action problem faced by defectors seeking a new patron — one more amenable to rapacious extraction. The first defector of a low mobility type faced higher opportunity costs as a solo bandit, along with a higher risk of punitive consequences given their low capacity for physically evading loyalist forces. The prospect of this likely outcome was a deterrent in and of itself. Conversely, high mobility elites were better positioned to “exit” their political allegiances and enter the service of a rival leader in need of their distinctive martial qualities (Bosworth, 1968, p. 112, 200; Chaliand, 2004, p. 30; Kradin, 2003, p. 84; Manz, 2015, p. 130, 145; Twitchett, 2000, p. 118). Self-sufficient cavalry bands were simply better suited for evading the consequences of treachery and faced lower opportunity costs associated with private pursuit of loot, with a second-order consequence that defections might cascade until the leader condoned rapacious extraction or was replaced by a usurper who would.
The leaders of tribal cavalry confederations were able to assemble a large, powerful, force in a short period of time. Yet a coalition built on unquenchable avarice went from boon to a burden for rulers who sought to transform their conquests into territorial possessions, even bona fide sedentary polities. Military elites had the motive and means to defect if a leader restricted their predatory drives (Barfield, 2001, p. 10, 85; Bosworth, 1968, p. 15; Kradin, 2003). Elite exit capabilities encouraged permanent ruptures between rulers and their forces.
The political circumstances of Tughril I, founder of the Seljuk Empire, illustrate this tension well. Tughril personally led an invasion of the Near East with Turkic nomad armies, ultimately establishing himself as the ruler of an expansive sedentary realm. His interests were now more consistent with those of Olson’s “stationary bandit” who seeks to cultivate long-run prosperity. This was not the case for his followers, who invoked a “right” to loot captured cities at the cost of their leader’s future tax revenues (Manz, 2021, p. 94, 95). The possibility of defection was ever-present, as rivals abounded. Charismatic kin (and nonkin) stood to gain from the displeasure of powerful chiefs and their mobile retinues. No less than Attila the Hun was beholden to rapacious underlings for political survival. As DeVries (2017, p. 11) states:
The defeat and loss of men in 451 brought Attila’s leadership into question. A tribal chief’s power, the assurance that his commands will be obeyed, rests upon his success in serving the interests of his tribesmen. Even before 451 Attila had worried about rivals within the tribe; his secretaries kept a list of those of them who had fled to the Romans … In 452, after he had led the tribe to defeat in Gaul, Attila had to deliver a victory (and its accompanying booty) so that his continued leadership might be assured. The Italian campaign is best understood as the result of such tribal politics.
In this model, military elites have a greater incentive to collaborate with their erstwhile ruler in governing conquered sedentary realms to the extent that defection is costly. Rulers of infantry war bands were better positioned to enjoy collaborative relationships with low mobility elites compared to their counterparts reliant on highly mobile forces. In the following section we describe a novel data-collection effort focused on urban conquests and present empirical evidence for our claims.
Describing the data
In total, we evaluate 820 instances of successful urban capture based on entries in Miller and Shuvo Bakar’s (2023) Historical Conflict Event Dataset (HCED), which includes historical and contemporary battles covered by popular compendiums on the subject. We exclude all failed attempts at capture since they, by definition, did not present the circumstance we are focused on: the choice made by victors after capturing a city. In Figure 1, we present a histogram of the number of observations in our dataset by decade.
 Vertical bars vary in height to reflect the number of successful captures for each decade, with decades labelled at regular intervals along the X-axis. The data flows from left to right across decades and from bottom to top across capture counts. The graph shows variation across decades, with noticeable increases and decreases in successful capture counts over time.
Count of successful urban capture events by decade: 1–1799 CE
Vertical bars vary in height to reflect the number of successful captures for each decade, with decades labelled at regular intervals along the X-axis. The data flows from left to right across decades and from bottom to top across capture counts. The graph shows variation across decades, with noticeable increases and decreases in successful capture counts over time.Count of successful urban capture events by decade: 1–1799 CE
We should note that European history is overrepresented in the extant English-language literature. In addition to Europe, regions that had more interactions with European powers are more likely to be described in detail in ways that increase their likelihood of being in our data. As a result, about 46% of all observations concern a city in Europe. A further 31% and 8% of observations took place in the Middle East and the Indian Subcontinent, respectively. This leaves only 7%, 6%, and 3% each for East Asia, Inner Asia, and Southeast Asia, respectively. Undoubtedly, this is an overrepresentation of Europe and the Middle East in our data. Future iterations of this project will make further efforts to expand some of the existing data sources to offer more balance and completeness. Figure 2 shows the locations of successful urban capture attempts and indicates whether the victor engaged in rapacious extraction up to, and including, urban destruction.
 Open circles represent none, orange circles represent rapacious extraction only, and red circles represent rapacious extraction and urban destruction. The dots are distributed across different regions of the world, forming clusters of varying density that indicate geographical patterns. The data is organised spatially across the map from west to east and north to south, with a legend explaining the colour coding used to distinguish the categories.
Location of rapacious extraction and urban destruction events: 1–1799 CE
Open circles represent none, orange circles represent rapacious extraction only, and red circles represent rapacious extraction and urban destruction. The dots are distributed across different regions of the world, forming clusters of varying density that indicate geographical patterns. The data is organised spatially across the map from west to east and north to south, with a legend explaining the colour coding used to distinguish the categories.Location of rapacious extraction and urban destruction events: 1–1799 CE
In any endeavor such as ours, a great helping of humility is required. Even in the best of situations, we rely on the information that is extant, surviving as much as a thousand years or more. It is ultimately through a great deal of luck that complete accounts survive to tell us about any but the most significant battles and sieges. Even after considering the ravages of time on the survival of centuries-old texts, there are additional barriers to useful information making it into the English language and making its way into the rather incomplete datasets that we begin our analysis with.
As a result, while we attempt to stretch our research beyond the well-trod ground of Western Europe, we can do so only incompletely. This must necessarily raise our uncertainty in our results, at least insofar as they generalize to a set of conditions for which our data are incomplete at describing. We proceed through the rest of the paper attempting to make the most of what is available and to make our work as complete as possible, but we recognize that this is a goal we will not perfectly succeed at. All research on historical topics should be approached in this way, and our paper is no exception.
Defining key measures
Our main question is whether the conquering factions engaged in rapacious extraction upon their victory. This proves to be somewhat more challenging to define than may be initially apparent. Extant historical descriptions of postvictory consequences are often imprecise and focus on other details without explicitly mentioning whether widespread wealth extraction occurred. Some historical documents pursue a more literary style, and focus on individual stories or use well-worn historical tropes to describe events generically. Many tears were shed and shouts made to deities that had forsaken their people. But that does not necessarily lead to clear evidence of the level of looting and extraction done after the battle.
We define Rapacious Extraction as occurring when the sources positively identify that it occurred with explicit language and detail as well as in cases for which the sources strongly imply rapacious extraction without explicitly stating it. This comes through the discussion of the way the population were treated, abused, etc. In these cases, it is unlikely that significant abuse would be delivered on a population without also expropriating their wealth. In total, about half of successful urban capture episodes meet this definition. Our second outcome variable, Urban Destruction, takes a value of 1 if sources indicate physical destruction of an urban center, at scale (e.g., “partially destroyed”, “left in ruins”). These comprise about 35% of urban capture episodes. In line with our inclusion criteria, all urban destruction episodes also qualify as rapacious extraction events.
Our main explanatory variables are measures of attacking faction mobility and the mobility of the attacking faction’s military forces. Faction Mobility is defined as the extent to which a politico-military faction can relocate beyond its erstwhile territorial bounds intact. The movement of entire tribes and confederations altered the incentive structure of conquest for Germanic, Arab, Nordic, and Turkic groups over the long course of our timeframe. These factions might dwell in a particular area for decades, but maintained a detached — if not downright predatory — relationship with more permanent fixtures of the economic and political landscape (e.g., urban settlements). This variable takes a value of 2 if historical sources indicate that the faction was engaged in mass migrations and there were no indications of intent to establish a permanent presence (e.g., designating a capital) at a given point in time. Of course, factions and military elites did not qualify as “stationary” immediately upon arrival. We assign a value of 1 if fewer than 30 years had passed since the first indication of attempts to establish durable political control over an area. A faction that has been in a location for more than 30 years after initial signs of permanent political control takes a value of 0. Moreover, successors to stationary entities are also coded as 0 unless sources highlight a migratory tendency.
Our Force Mobility variable indicates the extent to which military elites are physically and logistically mobile. Mobile forces empowered military elites — for example, tribal chiefs, unit commanders — in terms of intrinsic offensive capabilities and bargaining power vis-à-vis the ruler. The most notorious mobile forces were cavalry-based armies from the Eurasian steppe, which were used by various peoples for thousands of years, attacking from the steppe lands to plunder and, on occasion, establish a more permanent political presence. Notable examples include the various Mongol polities that dominated Eurasia in the thirteenth and fourteenth centuries and Turkic polities that swept across the Eastern Mediterranean and Middle East from the tenth century onwards, culminating in the Ottoman Empire.
Steppe-originating factions tended to follow a common trajectory outside the confines of Inner Asia. They had nomadic origins, though many would develop broadly sedentary polities in conquered domains after ousting erstwhile hegemons. Yet their militaries still relied on highly mobile cavalry forces that could raid, harry, and quickly penetrate enemy territory. Moreover, they frequently engaged in extractive military campaigns in which movable wealth rather than land was the purpose of the aggression despite emanating from a geopolitically rooted entity with sedentary governance structures (urban taxation, regulation, etc.). Similarly, maritime plundering persisted among settled Viking kingdoms given the mobility of military elites relative to the land-based infantry default. Though, of course, a littoral or riverine mode of conveyance limited the striking capabilities of Norse warriors in a distinctive way.
We assign a value of 2 if military forces are both swift (compared to infantry forces) and self-sufficient — thus, mobile in a more comprehensive sense (e.g., pastoral-nomadic tribes, Viking war parties). By self-sufficient we mean that sustenance and raiding capabilities are weakly predicated on sustained control over a particular territorial base for supplies, recruitment, weaponry, etc. Alternatively, this variable takes a value of 1 if military forces are swift but less self-sufficient (e.g., nonnomadic, long-distance cavalry forces). These forces still have an advantage over sluggish infantry units in terms of offensive and exit capabilities, but face higher exit costs than, e.g., pastoral-nomadic tribes. Finally, infantry-based (or infantry-paced) forces take a value of 0.
Rapacity serves expressive and symbolic functions beyond immediate instrumental considerations associate with extractive behavior, per se. The Crusades, along with conflicts between Muslim and Hindu states throughout the Indian Subcontinent, involved brutal massacres and episodes of urban destruction that might indicate nonmaterial incentives at work. We include a Different Religion dummy that takes a value of 1 if the offense and defense factions are affiliated with distinct religious traditions — Christian, Buddhist, Muslim, Hindu, etc. [4].
Another possibility is that estimated associations between mobility and extractive behavior are confounded by the unique power projection capabilities of European states after 1500 CE. European interventions in the Middle East, Indian Subcontinent, and Southeast Asia were enabled by a combination of maritime domination and, from the eighteenth century, military expansion into continental interiors. The distinctive attributes of European maritime expansion merits nuanced treatment in our analysis. Thus, we include a European Overseas dummy variable that takes a value of 1 for observations where the offensive actor is a European polity (or polity-aligned organization) operating in noncontiguous territories outside of Europe (i.e., overseas) [5].
Given that mobility and striking distance went hand-in-hand, it’s plausible that mobile actors are more likely to capture urban areas that are further from their core territorial holdings. Any actor, regardless of mobility is more likely to engage in rapacious extraction if they do not believe the target is a viable addition to their governed domains. Accordingly, we include a Boundary Distance variable that measures the distance between a captured city and the offensive actor’s boundaries at the first year of that century. For example, the boundary distance value associated with the Mongol sack of Baghdad in 1258 is equal to the distance between Baghdad and the domains of Genghis Khan’s tribe c.1200.
We also include several geographic covariates that potentially confound the relationship between faction mobility, or reliance on mobile forces, and tendencies toward rapacious extraction and destructiveness. First, we include a measure of logged River Distance, as such features are attractive to migratory groups and facilitate mobility. Second, we include two measures of location accessibility, the presence of Unforested Terrain and Terrain Ruggedness. Armies in unforested climatic zones and topographically flat areas are plausibly both more exposed to roving bandits and easier prey for rapacious invaders of any kind. Conversely, we include dummy variables for situation on an Island or Peninsula given that states in either have both a defensive advantage, broadly speaking, and less exposure to Inner Asian threats, specifically.
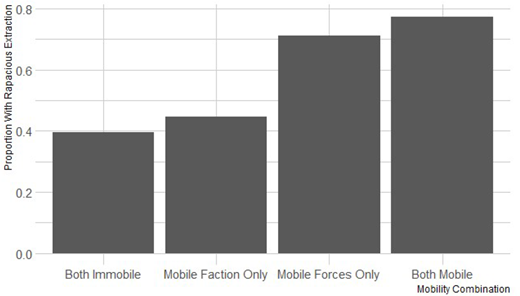
We report some basic descriptives that highlight the relationship between mobility and rapacious extraction. Figure 3 shows the proportion of successful urban captures associated with rapacious extraction for each combination of the two mobility measures. At first glance, the figure supports our hypothesis that mobile military forces predict a greater aggregate tendency toward rapacious extraction. Immobile factions with mobile forces are, in relative terms, only slightly less likely to engage in predatory postcapture extraction compared to mobile factions with mobile forces. Curiously, mobile factions with immobile forces are conspicuously less prone to rapacious extraction than immobile factions with immobile forces.
We also describe the distribution of rapacious extraction episodes in terms of broad factional groupings (i.e., milieu) that are easy to situate historically. Figure 4 aggregates each offensive actor coded as having one or more > 0 mobility score (on either measure) into the historical milieux referenced in Table 1. Not surprisingly, groupings characterized by high force mobility feature the highest proportion of capture episodes coded as rapacious extraction — Inner Asian nomads, nonnomadic factions that relied on Inner Asian cavalry, and the ship-borne Viking raiders. Several groupings associated with mobile factions composed of relatively immobile forces (e.g., the Islamic Caliphates, Crusaders, and Normans) had fewer rapacious extraction episodes than even “fully” immobile factions, in-line with the results displayed in Figure 4. These preliminary patterns are fully consistent with our force-oriented account of rapacious extraction. Of course, they might owe to the operation of confounding factors, which we address with several statistical models below.
 The vertical axis lists categories including Inner Asian nomads, Inner Asian cavalry other, Vikings, Germanic Slavic tribes, Islamic caliphates, Crusaders, Normans, and Both immobile. The horizontal X-axis indicates the proportion with rapacious extraction, ranging from 0.0 to 0.8. The bars are arranged in descending order based on proportion, with longer bars indicating higher involvement. The data flows from top to bottom across categories and from left to right across proportions, allowing direct comparison between groups.
Proportion of rapacious extraction episodes by actor milieu
The vertical axis lists categories including Inner Asian nomads, Inner Asian cavalry other, Vikings, Germanic Slavic tribes, Islamic caliphates, Crusaders, Normans, and Both immobile. The horizontal X-axis indicates the proportion with rapacious extraction, ranging from 0.0 to 0.8. The bars are arranged in descending order based on proportion, with longer bars indicating higher involvement. The data flows from top to bottom across categories and from left to right across proportions, allowing direct comparison between groups.Proportion of rapacious extraction episodes by actor milieu
Table 2 reports the results for several linear probability models testing the proposed relationship between mobility and postcapture behavior, revealing a substantively and statistically significant relationship between force mobility, but not group mobility, and rapacious extraction. A one unit increase in the victorious besiegers’ force mobility score corresponds with an approximately 10% higher rapacious extraction likelihood. We also test for a relationship between mobility and urban destruction and display the results in Table 3. As expected, force mobility, but not faction mobility, is a robust predictor of urban destruction. A one unit increase in the offensive actor’s force mobility score predicts a 15% increase in the likelihood of wholesale destruction after successfully capturing an urban area. These results also indicate that the effect of faction mobility is not statistically significant in any model specification, in line with our hypothesis that force mobility and associated principal–agent dynamics drive aggregate levels of rapacity.
Only reliance on mobile forces predicts rapacious extraction episodes
| Rapacious extraction | |||||
|---|---|---|---|---|---|
| Variable | Model 1 | Model 2 | Model 3 | Model 4 | Model 5 |
| Faction mobility | 0.02 (0.04) | 0.005 (0.04) | –0.05 (0.04) | ||
| Force mobility | 0.11** (0.03) | 0.10** (0.03) | 0.12** (0.04) | ||
| Different religion | 0.05 (0.04) | 0.04 (0.04) | 0.05 (0.04) | ||
| European overseas | –0.23* (0.11) | –0.19^ (0.11) | –0.18^ (0.11) | ||
| Boundary dist. (log) | –0.002 (0.01) | –0.004 (0.01) | –0.004 (0.01) | ||
| River dist. (log) | –0.01 (0.01) | –0.001 (0.01) | –0.002 (0.01) | ||
| Unforested (log) | –0.02 (0.05) | –0.03 (0.05) | –0.03 (0.05) | ||
| Ruggedness (log) | 0.02 (0.01) | 0.02 (0.01) | 0.02 (0.01) | ||
| Island | –0.01 (0.06) | –0.01 (0.06) | –0.005 (0.06) | ||
| Peninsula | –0.09 (0.05) | –0.07 (0.05) | –0.07 (0.05) | ||
| N | 819 | 819 | 745 | 745 | 745 |
| Region FE | Yes | Yes | Yes | Yes | Yes |
| Century FE | Yes | Yes | Yes | Yes | Yes |
| R-squared | 0.21 | 0.23 | 0.24 | 0.25 | 0.25 |
| Adj. R-squared | 0.19 | 0.2 | 0.2 | 0.21 | 0.21 |
Numbers in cells are OLS regression coefficients with standard errors in parentheses. ^p < 0.10; *p < 0.05; **p < 0.01
Only reliance on mobile forces predicts urban destruction episodes
| Urban destruction | |||||
|---|---|---|---|---|---|
| Variable | Model 1 | Model 2 | Model 3 | Model 4 | Model 5 |
| Faction mobility | 0.05 (0.04) | 0.04 (0.04) | –0.04 (0.04) | ||
| Force mobility | 0.14** (0.03) | 0.15** (0.03) | 0.16** (0.04) | ||
| Different religion | 0.003 (0.04) | –0.002 (0.04) | 0.001 (0.04) | ||
| European overseas | –0.0091 | –0.08 (0.08) | –0.07 (0.08) | ||
| Boundary dist. (log) | –0.01 (0.01) | –0.01^ (0.01) | –0.01^ (0.01) | ||
| River dist. (log) | –0.01 (0.01) | –0.002 (0.01) | –0.002 (0.01) | ||
| Unforested (log) | –0.08 (0.05) | –0.09^ (0.05) | –0.09^ (0.05) | ||
| Ruggedness (log) | 0.03* (0.01) | 0.03* (0.01) | 0.03* (0.01) | ||
| Island | –0.06 (0.06) | –0.05 (0.06) | –0.05 (0.06) | ||
| Peninsula | –0.12** (0.05) | –0.11* (0.05) | –0.11* (0.05) | ||
| N | 819 | 819 | 745 | 745 | 745 |
| Region FE | Yes | Yes | Yes | Yes | Yes |
| Century FE | Yes | Yes | Yes | Yes | Yes |
| R-squared | 0.14 | 0.16 | 0.17 | 0.2 | 0.2 |
| Adj. R-squared | 0.12 | 0.14 | 0.14 | 0.16 | 0.16 |
Numbers in cells are OLS regression coefficients with standard errors in parentheses. ^p < 0.10; *p < 0.05; **p < 0.01
We offer further evidence in the form of two robustness checks. First, Appendix Table A1 reports the results of fixed effects models that focus on variation within individual cities over multiple siege episodes. The coefficients for faction mobility and force mobility are similar to those of our baseline models in terms of both magnitude and statistical significance. We also account for possible spatial autocorrelation of error terms by estimating models using Conley standard errors with a 2,000 km distance cutoff. These estimates — reported in Table A2 — rely on the latitude/longitude coordinates included in the original HCED data. The coefficients and significance levels are essentially identical to those for the baseline models.
Concluding remarks
These results are, in aggregate, both rich and unevenly consistent with both prominent theoretical assumptions and historiographic tropes. On one hand, mobility does bear on extractive behavior as Olson’s model predicts. Yet our account highlights the centrality of principal-agent dynamics that counteract, and often override, a stationary ruler’s incentives when agents gain more from serial plundering and can exit with relative ease should a ruler not accede to their demands. First, we find evidence for greater rapaciousness among factions (mobile or not) with highly mobile military forces. Moreover, we find that rapaciousness often manifests in wholesale destruction of productive urban centers. A penchant for destruction following rapacious extraction — the former almost certainly preceded the latter — is consistent with the expectations of a roving bandit framework. Specifically, competitive pillagers rationally deny access to their rivals.
Our findings also have implications for research into the deep determinants of inter-regional wealth disparities (i.e., “The Great Divergence”) leading up to the onset of industrialization and European imperialism. Roving bandits that took on the Western Roman Empire were, at minimum, no more rapacious than typical sedentary actors during the period under investigation. It is possible that the relatively tame nature of high faction mobility/low force mobility groups that seeded early medieval Western European states spared that region a (more) prolonged economic nadir. Groups such as Vikings were exceptions that proved the rule. They were more destructive than, say, the Visigoths over the long run but were ultimately restricted to shores, navigable rivers, and eventually land-bound assets. Roving inertia waned; Northmen turned into Normans with fields to tend and estates to manage. Conversely, the predatory bands emanating from Inner Asia ensured that persistent rapacity would hamper long-run economic prosperity throughout large swathes of the Middle East, East Asia, and the Indian Subcontinent.
Appendix
City FE: Only reliance on mobile forces predicts rapacious extraction and urban destruction episodes
| Rapacious extraction | Urban destruction | |||||
|---|---|---|---|---|---|---|
| Variable | Model 1 | Model 2 | Model 3 | Model 4 | Model 5 | Model 6 |
| Faction mobility | –0.03 (0.05) | –0.11* (0.05) | 0.03 (0.05) | –0.06 (0.05) | ||
| Force mobility | 0.16** (0.05) | 0.2** (0.05) | 0.23** (0.05) | 0.25** (0.05) | ||
| Different religion | 0.01 (0.06) | –0.02 (0.06) | 0.01 (0.06) | –0.11^ (0.07) | –0.12* (0.06) | –0.1 (0.06) |
| European overseas | –0.05 (0.12) | –0.04 (0.13) | –0.05 (0.13) | –0.05 (0.12) | –0.04 (0.14) | –0.04 (0.13) |
| Boundary dist. (log) | 0.00 (0.01) | 0.00 (0.01) | 0.00 (0.01) | –0.00 (0.01) | –0.00 (0.01) | –0.00 (0.01) |
| N | 760 | 760 | 760 | 760 | 760 | 760 |
| City FE | Yes | Yes | Yes | Yes | Yes | Yes |
| Century FE | Yes | Yes | Yes | Yes | Yes | Yes |
| R-squared | 0.79 | 0.8 | 0.8 | 0.76 | 0.77 | 0.77 |
| Adj. R-squared | 0.3 | 0.33 | 0.33 | 0.2 | 0.25 | 0.25 |
Numbers in cells are OLS regression coefficients with standard errors in parentheses. ^p < 0.10; *p < 0.05; **p < 0.01
Conley SE: only reliance on mobile forces predicts rapacious extraction episodes
| Rapacious extraction | Urban destruction | |||||
|---|---|---|---|---|---|---|
| Variable | Model 1 | Model 2 | Model 3 | Model 4 | Model 5 | Model 6 |
| Faction mobility | 0.00 (0.04) | –0.05 (0.04) | 0.04 (0.03) | –0.04 (0.04) | ||
| Force mobility | 0.1** (0.03) | 0.12** (0.01) | 0.15** (0.01) | 0.16** (0.01) | ||
| Different religion | 0.05 (0.03) | 0.04 (0.04) | 0.05 (0.04) | 0.00 (0.02) | –0.00 (0.02) | 0.00 (0.02) |
| European overseas | –0.23** (0.08) | –0.19 (0.08) | –0.18 (0.08) | –0.13 (0.07) | –0.08 (0.08) | –0.07 (0.08) |
| Boundary dist. (log) | –0.00 (0.00) | –0.00 (0.00) | –0.00 (0.00) | –0.01 (0.01) | –0.01^ (0.01) | –0.01^ (0.01) |
| River dist. (log) | –0.01 (0.01) | –0.00 (0.01) | –0.00 (0.01) | –0.01 (0.01) | –0.00 (0.01) | –0.00 (0.01) |
| Unforested (log) | –0.02 (0.02) | –0.03 (0.05) | –0.03 (0.05) | –0.08* (0.04) | –0.09* (0.04) | –0.09* (0.04) |
| Ruggedness (log) | 0.02 (0.05) | 0.02 (0.02) | 0.02 (0.02) | 0.03^ (0.02) | 0.03^ (0.02) | 0.03^ (0.02) |
| Island | –0.01 (0.05) | 0.01 (0.05) | 0.00 (0.05) | –0.06 (0.06) | –0.05 (0.05) | –0.05 (0.05) |
| Peninsula | –0.08 (0.05) | –0.07 (0.05) | –0.07 (0.05) | –0.12** (0.04) | –0.1** (0.04) | –0.11** (0.04) |
| N | 745 | 745 | 745 | 745 | 745 | 745 |
| City FE | Yes | Yes | Yes | Yes | Yes | Yes |
| Century FE | Yes | Yes | Yes | Yes | Yes | Yes |
| Adj. R-squared | 0.2 | 0.21 | 0.21 | 0.14 | 0.16 | 0.16 |
Numbers in cells are OLS regression coefficients with standard errors in parentheses. ^p < 0.10; *p < 0.05; **p < 0.01
Notes
Indeed, the Romans themselves had done this ritualistically for centuries. New conquests were heavily looted, funding the grand excesses of the city of Rome, and the expensive professional armies that had won the territory in the first place.
For example, the Hunnic destruction of Aquileia by Atilla in 452 was so complete that the city effectively ceased to exist, and its refugees would help found Venice.
The first century CE saw a Eurasian landmass concurrently dominated by regionally hegemonic entities — mainly the Roman, Parthian, Kushana, Satavahana, and Han Chinese empires.
For our purposes, we include certain belief systems with nonsupernatural (or ambiguously supernatural) components, such as Confucianism, insofar as they are foundational to adherents’ worldviews. Moreover, we use certain catch-all categories (e.g., Pagan, Tengrist) to indicate adherents to nonuniversalizing beliefs with less emphasis on proselytism.
By “noncontiguous” we mean to exclude entities such as the Russian and Byzantine Empires that straddled Europe and Asia.

