Skip to Main Content
Purpose

This study aims to explore the scope and practice of social workers in Australian general practice and evaluate the outcomes of social work practice in these settings.

Design/methodology/approach

Primary health care centres in North Queensland participated in this research. Six clinics were co-funded to employ social workers for a one-year period. Quantitative data collection was utilised via a Qualtrics survey tool to collect descriptive data about social work interventions and seek patient feedback about the social work intervention received. Patient demographics, intervention duration, areas of health, intervention, referral and referral profession information were measured. Patient feedback forms explored satisfaction rates, likelihood of return and sense of improved well-being.

Findings

Social workers in primary health care settings applied a broad range of interventions to address diverse patient needs across a spectrum of health domains, including mental health, chronic health, families, ageing, caring, housing and disability. Patients were highly satisfied with the services and valued the integration of social work in primary health care.

Originality/value

This study showed Social Workers can value-add to primary health care. Social workers responded to many areas of identified health care needs through a range of intervention relevant to patients’ complex social contexts, assisting general practitioners’ engagement with patients to achieve holistic well-being outcomes. Patients appreciated and valued the additional services to support their health needs. Using social workers to contribute to health assessments can open up conversations about social determinants that impact patients’ health and wellbeing while alleviating pressures on general practitioners and providing links to community services.

A multidisciplinary approach to primary health care enables the consideration of social, economic and environmental determinants, which account for 30–55% of health outcomes (World Health Organisation [WHO], 2018). A focus on prevention, expert multi-disciplinary team care and early intervention is important to develop integrated care (McGorry et al., 2023). Approaches to integrated care include interdisciplinary or interprofessional work as a collaborative approach to teamwork in health care (de Saxe Zerden et al., 2019; Zimmerman, 2024). Interdisciplinary team members work collaboratively with each other to develop a shared understanding of and plan for patient care, but practise within their scope of expertise and discipline. This is different to multidisciplinary approaches where professionals from different disciplines work independently from each other, but provide their expertise (Zimmerman, 2024).

Including social workers in primary health care across various countries has led to enhanced patient care and improved outcomes (Zuchowski and McLennan, 2023; Ashcroft et al., 2024). They can engage in case management, care planning, brief counselling and therapy, psycho-social assessments, diagnosis, system navigation, psychoeducation, advocacy, program development and health promotion (Ashcroft et al., 2024; Australian Association of Social Workers [AASW], 2024a; Löwe et al., 2022; Milano et al., 2022; Tadic et al., 2020). Social workers are uniquely positioned to address the social determinants of health –such as housing instability, poverty, trauma, and family violence – which are often at the root of repeated GP visits and poor health outcomes (Bussey et al., 2024; de Saxe et al., 2018; Gerber et al., 2025; Tadic et al., 2020). By embedding these competencies within primary care, social workers can intervene early, reduce preventable hospitalisations and contribute to more integrated, equitable care systems (de Saxe Zerden et al., 2018; Tadic et al., 2020). Social workers are trained to consider the socio-economic and structural determinants of health and provide strengths-based responses to health concerns, which are important contributions to holistic health care (McGorry et al., 2023; Zuchowski and McLennan, 2023; Suetani et al., 2024; O'Brien, 2019). International evidence strongly supports the integration of social workers into primary healthcare to improve health equity, enhance care coordination, and address the social determinants of health. Countries such as Canada, the United Kingdom [UK], the United States and New Zealand have implemented varied yet converging models of integration that embed social workers within interdisciplinary primary care teams (Ashcroft et al., 2024, Dobl et al., 2017; Hawk et al., 2015). In the UK and Canada, the integration of social work is most advanced, with the focus in the United Kingdom on General Practices working with services in their local areas with various approaches including care coordination, social prescribing and co-location (Lalani and Marshall, 2020; Löwe et al., 2022). The emphasis in Canada is on community orientated health services via Family Health Teams (Lalani and Marshall, 2020).

Literature on interdisciplinary practice and care integration highlights the importance of role clarity, an organisational culture that supports integrated care and joint learning and positive interactions between professionals (Ashcroft et al., 2024; Löwe et al., 2022; Milano et al., 2022). Integrated care allows different health professionals to jointly assist patients, streamlining diagnosis, treatment and preventive health (Milano et al., 2022). Key strategies for integrated health services that shift the emphasis from diseases toward people-centred care include empowering and engaging people and communities, strengthening governance and accountability, reorientating the model of care, coordinating services within and across sectors and creating an enabling environment (World Health Organisation [WHO], 2016).

This research explores the inclusion of social work in Australian Primary Health Settings considering health care workforce shortages, an increasing ageing population and high levels of chronic disease and poorer health outcomes for Aboriginal and Torres Strait Islander communities (Zuchowski and McLennan, 2023; Barber et al., 2019; Browne et al., 2012; North Queensland Primary Health Network [NQPHN], 2020; The Royal Australian College of General Practitioners [RACGP], 2023). Of particular concern for Australian Primary Health Care are chronic disease (NQPHN, 2020) and a mental health crisis (McGorry et al., 2023). The Australian General Practice Health of the Nation Survey (RACGP, 2023) found that mental health has remained one of the top three reasons for patient presentations (72%) in 2023. This is an 11% increase from the previous reporting period. In 2023, 38% of General Practitioner [GP] consultations include a mental health component (RACGP, 2023).

There are two substantial roles for primary health care social work in Australia: provision of focused psychological interventions (by Accredited Mental Health Social Workers) and general social work practice addressing the range of wel-lbeing needs that patients face, such as relationships, alcohol and drug use, physical health and disabilities, mental health, housing, ageing, grief and loss, domestic violence, families, caring and trauma (AASW, 2024a, b). This project focuses on the second role, aiming to alleviate the pressure on an over-burdened and overstretched GP workforce which increasingly services patients presenting with complex social determinants of health and multimorbidity (Harrison and Niroshan Siriwardena, 2018; RACGP, 2024a). Involving social workers in multi-disciplinary care aligns with the quadruple aims of primary health care: enhancing the patient experience; improving the health of the population; reducing per capita costs of healthcare and improving the work life of health providers (RACGP, 2024a). Canadian and Australian studies have noted that despite their potential to contribute to the quadruple aims, the inclusion of social workers is hindered by several factors: lack of understanding of social workers’ role and potential contributions; organisational barriers; and unclear funding pathways (Zuchowski and McLennan, 2023; Ashcroft et al., 2023, 2024). Notwithstanding the introduction of blended payments, Australia’s general practice funding model is still predominately a fee for service model, with increasing patient copayments, rewarding episodic care rather than focusing on comprehensive care (Kidd et al., 2024; Department of Health and Aged Care, 2023).

This study directly addresses the gap of limited Australian research specific evidence by developing and piloting a model of social work integration in Australian general practice, informed by international best practice. It contributes to the emerging local evidence base while leveraging global insights into role definition, collaborative care, and policy alignment. Through partnership with primary health networks, universities, and practitioners, this project aims to create a scalable, sustainable model that enhances both patient care and primary care team functioning.

A study protocol has been published outlining the process and aims of the study, wherein Primary Health Care settings were supported to employ a qualified social worker for a one-year period (Zuchowski et al., 2024). The aims of the overall research are to: (1) Establish the scope of social work in general practice settings and evaluate the outcomes of social work practice in these settings, (2) Facilitate and evaluate social work placements in general practice under the supervision of social workers and (3) Develop strategies to embed social work in the integrated care team in general practice (Zuchowski et al., 2024). This article reports on the first aim of the study.

Recruitment of General Practices occurred via an expression of interest [EOI] to participate in this research. Information to participate in this project was shared via the Primary Health Network, Practice Managers and GP newsletters as well as presentations at networking meetings. The EOI required clinics interested in participating in the project to commit to supporting social work students on placement, employ a social worker in a minimum of a 0.5. Full-time equivalent position for a 1-year period, provide space for the social worker and support the collection of de-identified data. Participating clinics receive a co-payment towards salary cost, and the social workers receive a reimbursement of professional supervision cost. Both clinics and social workers receive induction, support and advice from the research team.

In this mixed methods research convergent parallel design, quantitative and qualitative data were collected simultaneously (Creswell et al., 2018). Data collection via surveys and feedback forms (Creswell et al., 2018) included information about the social work interventions, patient feedback, stakeholder surveys and a well-being scale. Qualtrics survey tools were used to collect descriptive data about social work interventions and patient feedback. Each social worker reported on patient demographics (age, gender, Aboriginal and Torres Strait Islander background, patient or relative), first contact, principal mode of engagement, duration of consultation or activity, area of health, social work intervention, referral and referral profession (Zuchowski et al., 2024). A patient feedback form collected Likert scale responses to how satisfied patients were with the service they received, whether they were like to return to see a social worker if required and whether they thought seeing a social worker at the GP had contributed to their overall well-being (Zuchowski et al., 2024). Feedback could be left on a paper feedback form and left at the reception or completed electronically via a QR code after their appointment with the social worker.

Data were analysed by the authors statistically and thematically and interpreted together to facilitate a comprehensive understanding of the social work interventions (Creswell et al., 2018). Quantitative data analysis was performed using the Statistical Package for Social Sciences (IBM SPSS Statistics version 30.0) and the qualitative responses were analysed thematically (Grazino and Raulin, 2013). Ethics approval was sought, including an Aboriginal and Torres Strait Islander Research Ethics Application Supplement, and granted by the James Cook University Human Ethics Committee on the 9.10.23 (approval number H9220).

Six primary health care practices joined the research project, four based in Townsville, one in Cairns and one in Mareeba. Two practices are Aboriginal and Torres Strait Islander Community Controlled Health Organisations [ACCHOs], three are private general practices, and one is a general practice specialising in care of homeless people. The findings are based on the first nine months of data collected between February and September 2024.

In total, 1,131 reported social-work interventions were delivered, including patient engagement (n = 920, 81.3%), meetings (n = 116, 10.3%), peer activities (n = 20, 1.8%), supervision provided (n = 19,1.7%), supervision received (17, 1.5%) training (n = 13, 1.2%), group activity (n = 13, 1.2%), community events (n = 7, 0.6%) and workshops (n = 6, 0.5%). More than half of the patient engagements (n = 530, 57.8%) were repeated contact with the social workers.

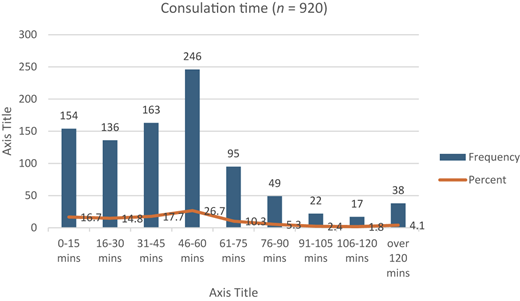
The social workers spent an average time of 44 min with each patient, with some interventions (n = 154, 16.7%) lasting 15 min or less and some (n = 77, 8.3% more than 90 min, see Figure 1).

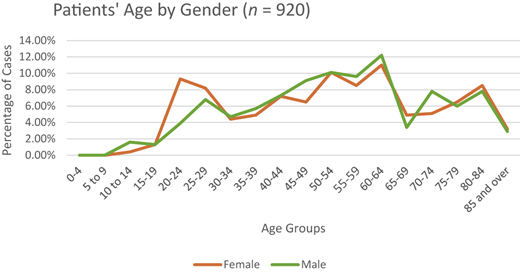
Of the 920 patients seen by social workers, 57.3% were females (n = 527). Males were 41.8% (n = 385), with a smaller representation of non-binary individuals (0.7%, n = 6) and those who preferred not to answer (0.2%, n = 2). The largest age group across all genders is 60–64, representing 11.4% of the total population. Females had the highest percentage within the 50–54 (10.1%) and 60–64 (11.0%) age groups, whereas males are in the 60–64 age group (12.2%), 55–59 (9.6%) and 50–54 (10.1%) groups (Figure 2).

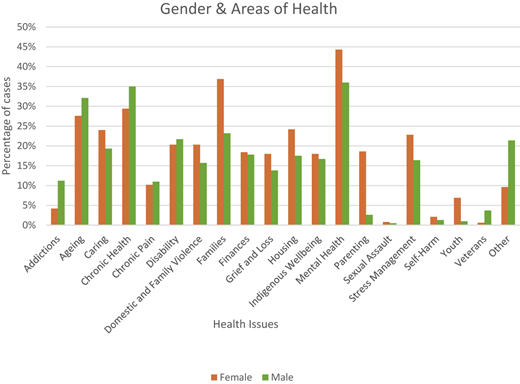
The results indicate that patients (n = 920) reported multiple areas of health concerns during their visit resulting in a total of 3,092 responses, see Figure 3. The most frequently cited concerns were mental health (40.7%), Chronic health (31.5%), Families (30.8%) and Ageing (29.3%). For female patients, the top areas were Mental Health (44.3%), Families (36.9%), Chronic Health (29.4%), Ageing (27.6%), Housing (24.6%) and Caring (24%); for male patients, they were Mental Health (36%), Chronic Health (35%), Ageing (32.1%), Families (23.2%), Disability (21.7%), and Caring (19.3%).

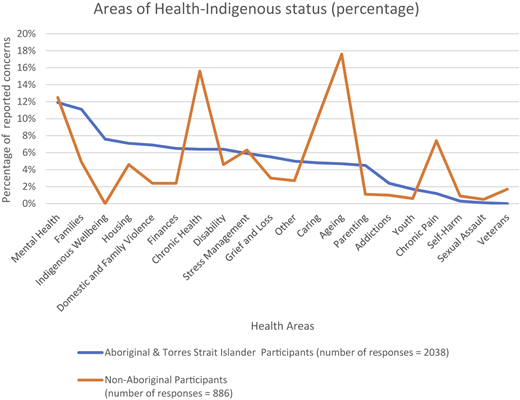
Social workers saw 537 patients (58.4%) who identified as Aboriginal and/or Torres Strait Islander people. When comparing the areas of health concerns between Aboriginal and/or Torres Strait Islander people (n = 2,038) and non-Indigenous patients (n = 886) two key observations emerge. Firstly, it appears that the social workers working with Aboriginal and Torres Strait Islander people identified a wider range of presenting issues for each patient, 3.8 issues as compared to 2.31 issues for non-Indigenous patients. Secondly, there were differences in areas of health (see Figure 4). Mental Health was the primary area of concern, with 11.1% of Aboriginal and Torres Strait Islander 12.5% of non-Indigenous patients’ health presentations. While similar percentages of stress management (5.9%/6.3%) were selected, Aboriginal and/or Torres Strait Islander people patients presented more family-related health (11.1%), domestic and family violence (6.9%), housing (7.1%) and finance (6.5%) issues. In comparison, Ageing (17.6%), chronic health (15.6%), caring (10.2%) and chronic pain (7.4%) were significant areas of health concern for non-Indigenous patients.

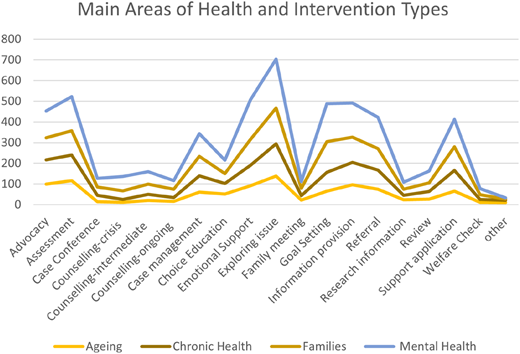
Social workers reported a total of 3,392 intervention types with patients in multiple ways during consultations. The most common interventions included exploring issues (49.5%), providing information (35.5%), offering emotional support (34.1% n = 304), conducting assessments (32.9%), advocacy (32.4%), assisting with applications (30.5% n = 272), and setting goals (29.3%). As shown in Figure 5, which correlates the four most prominent health areas (mental health, chronic health, families, and ageing) with intervention types, social workers employed a broad range of interventions to address diverse patient needs across these health domains.

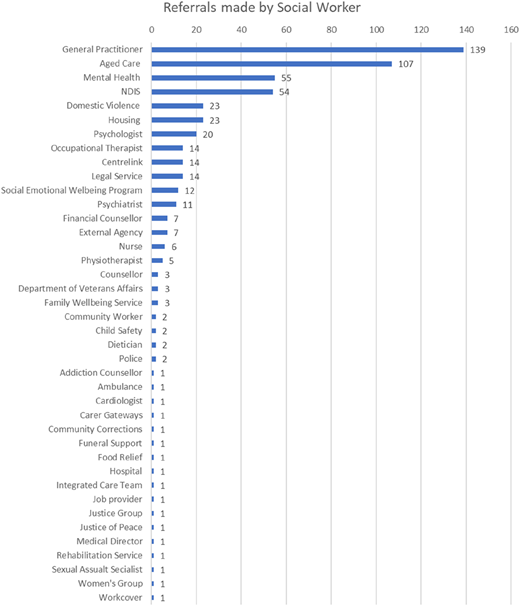
Social workers referred patients to other professionals and services. Figure 6 highlights that many of these referrals were back to the GP (n = 139). However, the patients were referred to a multitude of other services in the community including Aged Care (n = 107), Mental Health (n = 55), National Disability Insurance Scheme [NDIS] (n = 54), Domestic Violence (n = 23) and housing specialists and services (n = 23), psychologists (n = 20), occupational therapists (n = 14), Centrelink [income support agency] (n = 14) and Legal Services (n = 14).

Ninety-two patients provided feedback, resulting in a 9.9% response rate in the first nine months of the project. Of these, 95.6% (n = 88) reported being highly satisfied, and 4.3% (n = 4) were satisfied with the services. Additionally, 97.8% (n = 90) selected that they were likely to return to a social worker if needed, while 2.1% (n = 2) were unsure. Ninety respondents selected “yes” in response to the question “Do you think seeing a social worker and/or student at the GP has contributed to your overall wellbeing”, with two not responding,

Fifty-one of the patients who completed feedback forms left specific comments about social work in the GP clinic. Thematic analysis revealed three themes: “thankfulness for the services”, “helpfulness of the social work engagement” and “the value of social work in general practice”. Twenty-two comments expressed gratitude, satisfaction and praise for the social worker, for instance:

Feeling very grateful and overwhelmed by the amazing quality of the support offered. Thank you!

She was absolutely lovely to talk to and created a safe space for me to be in.

The helpfulness of the social work service (n = 12) is highlighted in comments such as

This has been very helpful to understand what is available for me in the community.

Very helpful and more settled about my wellbeing

The final theme highlighted the value of social work in the general practice settings (n = 14). Patients made comments such as:

Having a social worker in the clinic adds to the holistic care team

Having fought the good fight for this long and coming to [name of clinic], this has to be one of the best improvements in the practice. Thank you

Am very grateful to both the doctor and the social worker being a support system for me

The convenience of the GP clinic makes the meetings easier. [name] is an easy person to communicate with.

It is a very good thing as only through my GP telling me, I would not have seen proper people

More than half of the patients seen by the social worker in the clinics were of Aboriginal and Torres Strait Islander background. For context, they make up 11.7% of the North Queensland population (NQPHN, 2020), however, two of the participating clinics were ACCHOs. The health concerns that Aboriginal and Torres Strait Islander patients were bringing to the social worker highlighted the complexity of wellbeing, with multiple issues being presented to consultations. The findings reflect the lower life expectancy of Aboriginal and Torres Strait Islander people (NQPHN, 2020; Korff, 2023), with fewer consultation regarding ageing and a health understanding as a broader concept of “social, emotional, and cultural wellbeing of the whole community” (Korff, 2023, p. 111) in bringing family, domestic and family violence, housing and finance concerns to the consultations. Complex social determinants of health impacting on health (NQPHN, 2020) were more identifiable in this group of patients. This reinforces the importance of Aboriginal Community Controlled Health Organisations in delivering primary health care (Browne et al., 2012) and the valuable addition that social work can bring to such settings. Ultimately, it reinforces the need to address the social and structural determinants of health (Pearson et al., 2020).

The findings demonstrate that social workers are valuable integrated care team members as they respond to identified areas of need in primary health care, strengthening the primary health care workforce. Mental health is the most reported long-term health condition in Queensland and other states (NQPHN, 2020; Australian Bureau of Statistics, 2022). In fact, Australian GPs reported that 38% of consultations include a mental health component (NQPHN, 2020). Similarly, data from this study indicate that mental health is the most common area of health concern identified in the patient engagement for our social workers. The “GP: Health of the Nation 2023” survey identified GP workload, time pressure and stress as the top issues of most concern (27%) for GPs (RACGP, 2023). While mental health issues are pressing, there is a national shortage of psychologists and Psychiatrists (McGorry et al., 2023; RACGP, 2023), which often forces GPs to assume broader roles and responsibilities for patients with mental health needs. In 2023, Australia’s primary care workforce included 39,449 general practitioners; however, with almost one-third (32%) planning to cease practising within the next five years (RACGP, 2024b), the capacity of primary care to meet mental health care needs is expected to diminish significantly. Social workers are well positioned to help fill this growing gap addressing mental health issues in primary care settings with their expertise in addressing the social determinants of health.

This study provides evidence that social workers engaged in a range of interventions very familiar to them that supported interdisciplinary care and care integration leading to holistic patient care. Their practice included case management, welfare checks, brief intervention counselling, assessment, goal setting, advocacy and exploring referral options with community-based organisations to address the consequences and social justices inherent in mental health issues (Bland et al., 2021), alleviating both the workload pressure and emotional load experienced by GPs. They worked independently and autonomously to shape their practice according to the diverse needs that was presented to them. Further Australian research is needed to explore the impact of social work services on patient outcomes and whether the inclusion of social workers is based on multidisciplinary or interdisciplinary models of Integrated care (Zimmerman, 2024; de Saxe Zerden et al., 2019).

While some of the tasks social workers engaged in can be claimed through the Australian Medicare Benefit Scheme [MBS] by the overseeing GP (for example, preparation of Care Plans and other Enhanced Primary Care items), others primarily alleviate the GP’s workload. Overall, they allow patients to function effectively and follow medical direction for holistic care (Ashcroft et al., 2024; Harrison and Niroshan Siriwardena, 2018). This work can be facilitated through case conferencing between the physician and at least two other formal care providers that aims “ … to establish and coordinate the management of the care needs of the patient” (Australian Government, ND). Patient feedback highlights the appreciation for the social work in the GP practice, particularly in terms of receiving care, and accessing services and links to the community. It points to the value patients place and having an integrated general practice social work service and that they determine it improves their well-being, relevant to at least two of the quadruple aims of primary health care “enhancing the patient experience” and “improving the health of the population (RACGP, 2024a). The inclusion of social work into general practice could strengthen care coordination and integration. Social workers are skilled to address the complex co-morbidities that patients present with and have the competencies for holistic care (Milano et al., 2022). Our findings show the range of interventions that social workers applied in the variety of health areas, indicating that social workers” skill set, and competencies prepare them well for integrated care (Milano et al., 2022). While the integration of social workers will vary in different settings, it is important to carefully plan and implement this interprofessional approach to health care by collaboratively working to understand each professions contribution to the team and integrate the diverse knowledge into coordinated care delivery (de Saxe Zerden et al., 2019; Zimmerman, 2024).

Approximately 43% of patients were male, on average older than the female patients. This is an important consideration as research highlights that men tend to utilise primary health services less frequently due to internal (such as perceptions of self and masculinity) and structural (such as practice set-up and availability of services) barriers (Pirkis et al., 2022). Social work engagement in enhanced primary care items such as health assessment 75+ can be used strategically to initiate conversations that unpack themes impacting on patients’ quality of life and can lead to further interventions with the social worker, relevant in times where the median age of the population is forecast to further increase over time (NQPHN, 2020). Social workers can thus be a valuable support for GPs in encouraging preventative health strategies and promoting patients’ understanding of holistic healthcare (Ashcroft et al., 2024; Mursa et al., 2022). This is further advancing the quadruple aims, including improving the work life of health providers (RACGP, 2024a).

Practices participating in this project receive a subsidy to employ part-time social worker for a one-year period. A number of them are employing the social workers in fulltime capacities and/or are intending to retain their services beyond the project. Feedback from practices suggest that they undertake this investment into integrated care due to the value of the social work contribution to holistic healthcare and freeing GP time from navigating complex social issues they have limited capacity to respond to. Currently, social workers can undertake social assessments that can contribute to MBS billable items (Australian Government, 2024). Clinics employing social workers can claim Workforce Incentive and Practice Incentive program payments (Australian Government, 2025a, b). Moreover, there are pathways for payments under NDIS and Veteran’s (Australian Government, 2025c; National Disability Scheme, 2025). However, Government health funding and policies reforms need to further support the sustainability of social work in general practice, particularly in looking towards a more blended and incentive funding model to facilitate integrated care (Department of Health and Aged Care, 2023). International studies show that the universal integration of social work in general practice comes about through funding reforms supporting this integration (Zuchowski and McLennan, 2023; Milano et al., 2022; Tadic et al., 2020). Australia lacks a coordinated, policy-supported model for social work integration in primary care. Unlike the UK or Canada, where funding and training structures for integrated care are embedded in the health system, Australian general practices generally rely on ad-hoc arrangements or localised pilot projects. This creates variability in implementation and limits scalability. Thus, there is a need to develop the evidence for the value of social work in general practice and to advocate for funding reforms (Zuchowski and McLennan, 2023; Ashcroft et al., 2024; Kidd et al., 2024).

Limitations of this study are that the patient feedback rate is slightly less than 10%, which could does not provide a clear indication of the satisfaction rate of the overall population, limiting generalisability. Moreover, there might be variation in the data entry of individual social workers. Findings are not generalisable because the study was conducted in a particular geographical area, with two of the six practices being ACCHOs and a third one providing care to homeless people. A further limitation of this study is, that data collection did not focus on how integrated care was facilitated. Data collection identified how social workers conducted their work in the field focusing on the individual’s tasks undertaken with patients, and not whether and how this was done in conjunction with the GP or other allied health professionals. However, patient feedback captures aspects of integrated care and interdisciplinary approaches. It indicates the value of the social worker towards holistic team care, and the value of the integrated care to patients. The corresponds with other international studies that highlight the importance of co-location for integrated care (Lalani and Marshall, 2020).

Social work’ is an important contributor to the health work force. Social Work’s multipronged approach to addressing areas of health can support general practitioners advance the quadruple aims of health care. Mental Health, Chronic Health, Families and Ageing were key areas of Health corresponding with key presenting issues in primary health care. Findings highlight the distinct health concerns and priorities between Aboriginal and non-Aboriginal patients, emphasising the need for tailored health interventions and support service. Using social work to contribute to health assessment can encourage conversations about salient aspects impacting patients’ health. Patients value the additional services to support their health. Pressures on GPs can be alleviated through social work interventions and providing links to community services.

Social workers bring a skill set that is complementary to those of a general practitioner. They are often able to address areas which GPs are unable to manage due to time pressures and other factors. These are complex and challenging areas which are highly significant to patients, with substantial impacts on their health, but which are often not well managed, and not well remunerated. A formal cost-effectiveness evaluation was out of the scope of this study but is a logical next step as we continue to explore ways in which social workers can contribute to patient care in the general practice setting.

The de-identified data we analysed are not publicly available, but requests to the corresponding author for the data will be considered on a case-by-case basis.
AASW
(
2024a
), “
AASW accredited mental health social worker application criteria
”,
available at:
 https://www.aasw.asn.au/credentials/aasw-accredited-mental-health-social-worker-application-criteria/ (
accessed
 30 September 2024).
AASW
(
2024b
), “
What social workers do
”,
available at:
 https://www.aasw.asn.au/social-work/about-social-work/what-social-workers-do/ (
accessed
 20 September 2024).
Ashcroft
,
R.
,
Lam
,
S.
,
Feryn
,
N.
,
Sur
,
D.
,
Abudiab
,
S.
,
Sheffield
,
P.
,
Rayner
,
J.
,
Mehta
,
K.
and
Brown
,
J.
(
2023
), “
A mixed-methods examination of the role of social work in primary care teams in Ontario, Canada
”, doi: .
Ashcroft
,
R.
,
Sheffield
,
P.
,
Adamson
,
K.
,
Phelps
,
F.
,
Webber
,
G.
,
Walsh
,
B.
,
Dallaire
,
L.F.
,
Sur
,
D.
,
Kemp
,
C.
,
Rayner
,
J.
,
Lam
,
S.
and
Brown
,
J.B.
(
2024
), “
Scoping review of social workers’ professional roles in primary care
”,
BMJ Open
, Vol. 
14
No. 
12
, e090527, doi: .
Australian Bureau of Statistics
(
2022
), “
Snapshot of Australia
”,
available at:
 https://www.abs.gov.au/statistics/people/people-and-communities/snapshot-australia/2021 (
accessed
 10 May 2024).
Australian Government
(
2025a
), “
Workforce incentive program (wip) – practice stream
”,
Department of Health and Aged Care, available at:
 https://www.health.gov.au/our-work/workforce-incentive-program/practice-stream (
accessed
 7 Februay 2025).
Australian Government
(
2025b
), “
Consultations and grants
”,
Department of Veteran’s Affairs, available at:
 https://www.dva.gov.au/about-us/overview/consultations-and-grants (
accessed
 7 February 2025).
Australian Government
(
2025c
), “
Practice incentive program
”,
Services Australia, available at:
 https://www.servicesaustralia.gov.au/practice-incentives-program (
accessed
 7 February 2025).
Australian Government
(
2024
), “
MBS online. Note AN.0.49
”,
Department of Health and Aged Care, available at:
 https://www9.health.gov.au/mbs/fullDisplay.cfm?type=note&q=AN.0.49&qt=noteID&criteria=case%20conference (
accessed
 3 October 2024).
Barber
,
J.R.G.
,
Park
,
S.E.
,
Jensen
,
K.
,
Marshall
,
H.
,
McDonald
,
P.
,
McKinley
,
R.K.
,
Randles
,
H.
and
Albert
,
H.
(
2019
), “
Facilitators and barriers to teaching undergraduate medical students in general practice
”,
Medical Education
, Vol. 
53
No. 
8
, pp. 
778
-
787
, doi: .
Bland
,
R.
,
Drake
,
G.
and
Drayton
,
J.
(
2021
),
Social Work Practice in Mental Health : An Introduction
, (3rd ed.) ,
Routledge
.
Browne
,
A.J.
,
Varcoe
,
C.M.
,
Wong
,
S.T.
,
Smye
,
V.L.
,
Lavoie
,
J.
,
Littlejohn
,
D.
,
Tu
,
D.
,
Godwin
,
O.
,
Krause
,
M.
,
Khan
,
K.B.
,
Fridkin
,
A.
,
Rodney
,
P.
,
O'Neil
,
J.
and
Lennox
,
S.
(
2012
), “
Closing the health equity gap: evidence-based strategies for primary health care organizations
”,
International Journal for Equity in Health
, Vol. 
11
No. 
1
, pp. 
1
-
15
, doi: ,
available at:
 http://www.equityhealthj.com/content/11/1/59
Bussey
,
S.R.
and
Dobrof
,
J.
(
2024
), “
Social work’s opportunity and obligation to achieve population health equity
”,
Social Work in Health Care
, Vol. 
63
No. 
3
, pp. 
154
-
167
, doi: .
Creswell
,
J.W.
,
Plano
,
V.
and
Clark
,
V.
(
2018
),
Designing and Conducting Mixed Methods Research
,
Sage
,
Thousand Oaks
.
de Saxe Zerden
,
L.
,
Lombardi
,
B.
,
Fraser
,
M.
,
Jones
,
A.
and
Rico
,
Y.
(
2018
), “
Social work: integral to interprofessional education and integrated practice
”,
Journal of Interprofessional Education and Practice
, Vol. 
10
, pp. 
67
-
75
, doi: .
Department of Health and Aged Care
(
2023
), “
Strengthening Medicare taskforce report
”,
available at:
 https://www.health.gov.au/resources/publications/strengthening-medicare-taskforce-report?language=en
Dobl
,
S.
,
Beddoe
,
L.
and
Huggard
,
P.
(
2017
), “
Primary health care social work in Aotearoa New Zealand: an exploratory investigation
”,
Aotearoa New Zealand Social Work
, Vol. 
29
No. 
2
, pp. 
119
-
130
, doi: .
Gerber
,
T.
,
Hernandez
,
L.D.
,
Rüegg
,
R.
,
Vetter
,
D.
and
Zeller
,
A.
(
2025
), “
Social issues in general practice – a survey assessing the interprofessional perspective of general practitioners and social workers regarding frequency, challenges, and needs
”,
BMC Primary Care
, Vol. 
26
No. 
1
, p.
11
, doi: .
Grazino
,
A.
and
Raulin
,
M.
(
2013
),
Research Methods. A Process of Inquiry
, (8th ed.) ,
Pearson
,
Boston
.
Harrison
,
C.
and
Niroshan Siriwardena
,
A.
(
2018
), “
Multimorbidity
”,
Australian Journal of General Practice
, Vol. 
47
Nos
1-2
, p.
7
.
Hawk
,
M.
,
Ricci
,
E.
,
Huber
,
G.
and
Myers
,
M.
(
2015
), “
Opportunities for social workers in the patient centered medical home
”,
Social Work in Public Health
, Vol. 
30
No. 
2
, pp. 
175
-
184
, doi: .
Kidd
,
M.
,
Rhee
,
J.
,
Sharma
,
A.
,
Harris-Roxas
,
B.
,
Harris
,
M.
,
van Kemenade
,
C.
,
Burns
,
M.
,
Marshall
,
K.
,
Ali
,
R.
,
Sunjaya
,
A.
,
Kearns
,
R.
,
Wright
,
M.
,
Bates
,
S.
,
El Hadad
,
N.
,
Sitas
,
F.
and
Barr
,
M.
(
2024
), “
Review of general practice incentives – international evidence and literature review report
”,
Faculty of Medicine and Health, UNSW Sydney, available at:
 https://www.health.gov.au/resources/publications/review-of-general-practice-incentives-international-evidence-and-literature-review?language=en (
accessed
 25 February 2025).
Korff
,
J.
(
2023
), “
Aboriginal life expectancy
”,
available at:
 https://www.creativespirits.info/aboriginalculture/health/aboriginal-life-expectancy
Lalani
,
M.
and
Marshall
,
M.
(
2020
), “
Co‐location, an enabler for service integration? Lessons from an evaluation of integrated community care teams in East London
”,
Health and Social Care in the Community
, Vol. 
30
No. 
2
, pp. 
e388
-
e396
, doi: .
Löwe
,
C.
,
Mark
,
P.
,
Sommer
,
S.
and
Weltermann
,
B.
(
2022
), “
Collaboration between general practitioners and social workers: a scoping review
”,
BMJ Open
, Vol. 
12
No. 
6
, e062144, doi: .
McGorry
,
P.D.
,
Coghill
,
D.
and
Berk
,
M.
(
2023
), “
Mental health of young Australians: dealing with a public health crisis
”,
The Medical Journal of Australia
, Vol. 
219
No. 
6
, pp. 
246
-
249
, doi: .
Milano
,
N.
,
Petruzzi
,
L.
,
Covington
,
E.
,
Jones
,
B.
and
Findley
,
P.A.
(
2022
), “
Social workers in integrated care beyond primary care: a scoping review
”,
Translational Behavioral Medicine
, Vol. 
12
No. 
11
, pp. 
1038
-
1048
, doi: .
Mursa
,
R.
,
Patterson
,
C.
and
Halcomb
,
E.
(
2022
), “
Men’s help‐seeking and engagement with general practice: an integrative review
”,
Journal of Advanced Nursing
, Vol. 
78
No. 
7
, pp. 
1938
-
1953
, doi: .
National Disability Scheme
(
2025
), “
Pricing arrangements
”,
available at:
 https://www.ndis.gov.au/providers/pricing-arrangements#ndis-price-guide-2020-21 (
accessed
 7 February 2025).
Northern Queensland Primary Health Network [NQPHN]
(
2020
), “
Health needs assessment. 2022-2024
”,
available at:
 https://www.nqphn.com.au/sites/default/files/2022-03/NQPHN%20Health%20Needs%20Assessment%202022-
O'Brien
,
K.H.
(
2019
), “
Social determinants of health: the how, who, and where screenings are occurring; a systematic review
”,
Social Work in Health Care
, Vol. 
58
No. 
8
, pp. 
719
-
745
, doi: .
Pearson
,
O.
,
Schwartzkopff
,
K.
,
Dawson
,
A.
,
Hagger
,
C.
,
Karagi
,
A.
,
Davy
,
C.
,
Brown
,
A.
and
Braunack-Mayer
,
A.
(
2020
), “
Aboriginal community controlled health organisations address health equity through action on the social determinants of health of Aboriginal and Torres Strait Islander peoples in Australia
”,
BMC Public Health
, Vol. 
20
No. 
1859
, pp. 
1
-
13
, doi: .
Pirkis
,
J.
,
Currier
,
D.
,
Harris
,
M.
,
Mihlopoulos
,
C.
,
Arya
,
V.
,
Banfield
,
M.
,
Bassilios
,
B.
,
Buchanan
,
B.
,
Butterworth
,
P.
,
Brophy
,
L.
and
Burgess
,
P.
(
2022
), “
Evaluation of better access. Executive summary. 2022
”,
available at:
 https://www.health.gov.au/our-work/better-access-evaluation (
accessed
 30 September 2024).
Royal Australian College of General Practitioners
(
2023
), “
General practice: health of the nation 2023
”,
available at:
 https://www.racgp.org.au/general-practice-health-of-the-nation-2023 (
accessed
 30 September 2024).
Royal Australian College of General Practitioners
(
2024a
), “
The vision for general practice
”,
The model for high-quality patient care, available at:
 https://www.racgp.org.au/advocacy/advocacy-resources/the-vision-for-general-practice/the-vision/the-model-for-high-quality-patient-care#ref-num-36 (
accessed
 3 October 2024).
Royal Australian College of General Practitioners
(
2024b
), “
General practice: health of the nation 2024
”,
available at:
 https://www.racgp.org.au/general-practice-health-of-the-nation (
accessed
 30 July 2025).
Suetani
,
S.
,
Gill
,
N.
and
Salvador‐Carulla
,
L.
(
2024
), “
The mental health crisis needs more than increased investment in the mental health system
”,
The Medical Journal of Australia
, Vol. 
220
No. 
9
, pp. 
443
-
451
, doi: .
Tadic
,
V.
,
Ashcroft
,
R.
,
Brown
,
J.B.
and
Dahrouge
,
S.
(
2020
), “
The role of social workers in interprofessional primary healthcare teams
”,
Healthcare Policy
, Vol. 
16
No. 
1
, pp. 
27
-
42
, doi: .
World Health Organisation [WHO]
(
2016
), “
Integrated people-centred care
”,
available at:
 https://www.who.int/health-topics/integrated-people-centered-care#tab=tab_2
World Health Organisation [WHO]
(
2018
), “
A vision for primary health care in the 21st Century: towards universal health coverage and Sustainable Development Goals
”,
United Nations Children’s Fund (UNICEF), available at:
 https://iris.who.int/bitstream/handle/10665/328065/WHO-HIS-SDS-2018.15eng.pdf?sequence=1 (
accessed
 1 May 2024).
Zimmerman
,
A.
(
2024
), “
Understanding the nuances: multidisciplinary, interdisciplinary, cross-disciplinary and interprofessional approaches in accredited continuing healthcare education
”,
Alliance for Continuing Education in the Health Professions, available at:
 https://almanac.acehp.org/Education/Education-Article/understanding-the-nuances-multidisciplinary-interdisciplinary-cross-disciplinary-and-interprofessional-approaches-in-accredited-continuing-healthcare-education
Zuchowski
,
I.
and
McLennan
,
S.
(
2023
), “
A systematic review of social work in general practice: opportunities and challenges
”,
Journal of Evidence-Based Social Work
, Vol. 
20
No. 
5
, pp. 
686
-
726
, doi: .
Zuchowski
,
I.
,
Kuruvila
,
A.
,
Lee
,
R.
and
McLennan
,
S.
(
2024
), “
Integrating social work into general practice in Australia: protocol of an intervention study
”,
Journal of Integrated Care
, Vol. 
32
No. 
4
, pp. 
481
-
490
, doi: .
Published by Emerald Publishing Limited. This article is published under the Creative Commons Attribution (CC BY 4.0) licence. Anyone may reproduce, distribute, translate and create derivative works of this article (for both commercial and non-commercial purposes), subject to full attribution to the original publication and authors. The full terms of this licence may be seen at Link to the terms of the CC BY 4.0 licence.

Data & Figures

Figure 1
A line and a vertical bar graph plot the axis title, frequency, and percent.The graph is titled “Consulation time (n equals 920).” The horizontal axis is labeled “Axis Title” and has 9 markings labeled from left to right as follows: “0 to 15 mins,” “16 to 30 mins,” “31 to 45 mins,” “46 to 60 mins,” “61 to 75 mins,” “76 to 90 mins,” “91 to 105 mins,” “106 to 120 mins,” and “over 120 mins.” The vertical axis is labeled “Axis Title” and has markings ranging from 0 to 300 in increments of 50 units. The data from the bars on the graph for frequency is as follows: 0 to 15 mins: 154. 16 to 30 mins: 136. 31 to 45 mins: 163. 46 to 60 mins: 246. 61 to 75 mins: 95. 76 to 90 mins: 49. 91 to 105 mins: 22. 106 to 120 mins: 17. over 120 mins: 38. The graph shows a line curve for percent that starts from (0 to 15 mins, 16.7), moves to the right passing through the coordinates (16 to 30 mins, 14.6), (31 to 45 mins, 17.7), (46 to 60 mins, 26.7), (61 to 75 mins, 10.3), (76 to 90 mins, 5.3), (91 to 105 mins, 2.4), (106 to 120 mins, 1.8), and terminates at (over 120 mins, 4.1). Note: All numerical data values are approximated.

Consultation time. Source: Authors’ own work

Figure 1
A line and a vertical bar graph plot the axis title, frequency, and percent.The graph is titled “Consulation time (n equals 920).” The horizontal axis is labeled “Axis Title” and has 9 markings labeled from left to right as follows: “0 to 15 mins,” “16 to 30 mins,” “31 to 45 mins,” “46 to 60 mins,” “61 to 75 mins,” “76 to 90 mins,” “91 to 105 mins,” “106 to 120 mins,” and “over 120 mins.” The vertical axis is labeled “Axis Title” and has markings ranging from 0 to 300 in increments of 50 units. The data from the bars on the graph for frequency is as follows: 0 to 15 mins: 154. 16 to 30 mins: 136. 31 to 45 mins: 163. 46 to 60 mins: 246. 61 to 75 mins: 95. 76 to 90 mins: 49. 91 to 105 mins: 22. 106 to 120 mins: 17. over 120 mins: 38. The graph shows a line curve for percent that starts from (0 to 15 mins, 16.7), moves to the right passing through the coordinates (16 to 30 mins, 14.6), (31 to 45 mins, 17.7), (46 to 60 mins, 26.7), (61 to 75 mins, 10.3), (76 to 90 mins, 5.3), (91 to 105 mins, 2.4), (106 to 120 mins, 1.8), and terminates at (over 120 mins, 4.1). Note: All numerical data values are approximated.

Consultation time. Source: Authors’ own work

Close modal
Figure 2
A line graph plots the percentage of cases versus age groups by gender.The graph is titled “Patients' Age by Gender (n equals 920).” The horizontal axis is labeled “Axis Title” and has 18 markings labeled from left to right as follows: “0 to 4,” “5 to 9,” “10 to 14,” “15 to 19,” “20 to 24,” “25 to 29,” “30 to 34,” “35 to 39,” “40 to 44,” “45 to 49,” “50 to 54,” “55 to 59,” “60 to 64,” “65 to 69,” “70 to 74,” “75 to 79,” “80 to 84,” and “85 and over.” The vertical axis is labeled “Percentage of Cases” and has markings ranging from 0.00 to 14.00 percent in increments of 2.00 percent. The graph shows two line curves. The first curve for “Female” starts from (5 to 9, 0.00 percent), rises upward passing through coordinates (15 to 19, 1.35 percent), (20 to 24, 0.56 percent), moves in a zigzag fashion passing through coordinates (25 to 29, 8.28 percent), (30 to 34, 4.4 percent), (35 to 39, 4.97 percent), (40 to 44, 7.3 percent), (45 to 49, 6.47 percent), (50 to 54, 10.3 percent), (55 to 59, 8.51 percent), (60 to 64, 11 percent), (65 to 69, 5 percent), (70 to 74, 5.19 percent), (80 to 84, 8.58 percent), and terminates at (85 and over, 3.09 percent). The second curve for “Male” starts from (0 to 4, 0.00 percent), moves in a zigzag fashion passing through coordinates (5 to 9, 0.00 percent), (10 to 14, 1.73 percent), (15 to 19, 1.2 percent), (25 to 29, 7.00 percent), (30 to 34, 4.59 percent), (50, 54, 10.00 percent), (55 to 59, 9.63 percent), (60 to 64, 12.4 percent), (65 to 69, 3.39 percent), (70 to 74, 8.00 percent), (75 to 79, 5.95 percent), (80 to 84, 8.00 percent), and terminates at (85 and over, 2.86 percent). Note: All numerical data values are approximated.

Patients’ gender and age distribution. Source: Authors’ own work

Figure 2
A line graph plots the percentage of cases versus age groups by gender.The graph is titled “Patients' Age by Gender (n equals 920).” The horizontal axis is labeled “Axis Title” and has 18 markings labeled from left to right as follows: “0 to 4,” “5 to 9,” “10 to 14,” “15 to 19,” “20 to 24,” “25 to 29,” “30 to 34,” “35 to 39,” “40 to 44,” “45 to 49,” “50 to 54,” “55 to 59,” “60 to 64,” “65 to 69,” “70 to 74,” “75 to 79,” “80 to 84,” and “85 and over.” The vertical axis is labeled “Percentage of Cases” and has markings ranging from 0.00 to 14.00 percent in increments of 2.00 percent. The graph shows two line curves. The first curve for “Female” starts from (5 to 9, 0.00 percent), rises upward passing through coordinates (15 to 19, 1.35 percent), (20 to 24, 0.56 percent), moves in a zigzag fashion passing through coordinates (25 to 29, 8.28 percent), (30 to 34, 4.4 percent), (35 to 39, 4.97 percent), (40 to 44, 7.3 percent), (45 to 49, 6.47 percent), (50 to 54, 10.3 percent), (55 to 59, 8.51 percent), (60 to 64, 11 percent), (65 to 69, 5 percent), (70 to 74, 5.19 percent), (80 to 84, 8.58 percent), and terminates at (85 and over, 3.09 percent). The second curve for “Male” starts from (0 to 4, 0.00 percent), moves in a zigzag fashion passing through coordinates (5 to 9, 0.00 percent), (10 to 14, 1.73 percent), (15 to 19, 1.2 percent), (25 to 29, 7.00 percent), (30 to 34, 4.59 percent), (50, 54, 10.00 percent), (55 to 59, 9.63 percent), (60 to 64, 12.4 percent), (65 to 69, 3.39 percent), (70 to 74, 8.00 percent), (75 to 79, 5.95 percent), (80 to 84, 8.00 percent), and terminates at (85 and over, 2.86 percent). Note: All numerical data values are approximated.

Patients’ gender and age distribution. Source: Authors’ own work

Close modal
Figure 3
A grouped vertical bar graph plots percentage of cases versus health issues.The graph is titled “Gender and Areas of Health.” The horizontal axis is labeled “Health Issues” and has 20 markings labeled from left to right as follows: “Addictions,” “Ageing,” “Caring,” “Chronic Health,” “Chronic Pain,” “Disability,” “Domestic and Family Violence,” “Families,” “Finances,” “Grief and Loss,” “Housing,” “Indigenous Wellbeing,” “Mental Health,” “Parenting,” “Sexual Assault,” “Stress Management,” “Self-Harm,” “Youth,” “Veterans,” and “Others.” The vertical axis is labeled “Percentage of cases” and has markings ranging from 0 to 50 percent in increments of 5 percent. The graph shows two bars for “Female” and “Male” at each marking. The data from the bars on the graph is as follows: Addictions: Female: 4.5 percent; Male: 11 percent. Ageing: Female: 27.7 percent; Male: 32.4 percent. Caring: Female: 23.7 percent; Male: 19.3 percent. Chronic Health: Female: 29.5 percent; Male: 35 percent. Chronic Pain: Female: 10 percent; Male: 11 percent. Disability: Female: 20 percent; Male: 22 percent. Domestic and Family Violence: Female: 20 percent; Male: 15.8 percent. Families: Female: 37 percent; Male: 23.1 percent. Finances: Female: 18.4 percent; Male: 17.9 percent. Grief and Loss: Female: 18.2 percent; Male: 13.8 percent. Housing: Female: 24 percent; Male: 17.9 percent. Indigenous Wellbeing: Female: 18.2 percent; Male: 16.7 percent. Mental Health: Female: 44.3 percent; Male: 36.2 percent. Parenting: Female: 19 percent; Male: 2.7 percent. Sexual Assault: Female: 1.05 percent; Male: 0.76 percent. Stress Management: Female: 23.1 percent; Male: 16.7 percent. Self-Harm: Female: 2.21 percent; Male: 1.63 percent. Youth: Female: 7.15 percent; Male: 1.3 percent. Veterans: Female: 0.76 percent; Male: 3.95 percent. Others: Female: 9.7 percent; Male: 21.4 percent. Note: All numerical data values are approximated.

Areas of health by gender. Source: Authors’ own work

Figure 3
A grouped vertical bar graph plots percentage of cases versus health issues.The graph is titled “Gender and Areas of Health.” The horizontal axis is labeled “Health Issues” and has 20 markings labeled from left to right as follows: “Addictions,” “Ageing,” “Caring,” “Chronic Health,” “Chronic Pain,” “Disability,” “Domestic and Family Violence,” “Families,” “Finances,” “Grief and Loss,” “Housing,” “Indigenous Wellbeing,” “Mental Health,” “Parenting,” “Sexual Assault,” “Stress Management,” “Self-Harm,” “Youth,” “Veterans,” and “Others.” The vertical axis is labeled “Percentage of cases” and has markings ranging from 0 to 50 percent in increments of 5 percent. The graph shows two bars for “Female” and “Male” at each marking. The data from the bars on the graph is as follows: Addictions: Female: 4.5 percent; Male: 11 percent. Ageing: Female: 27.7 percent; Male: 32.4 percent. Caring: Female: 23.7 percent; Male: 19.3 percent. Chronic Health: Female: 29.5 percent; Male: 35 percent. Chronic Pain: Female: 10 percent; Male: 11 percent. Disability: Female: 20 percent; Male: 22 percent. Domestic and Family Violence: Female: 20 percent; Male: 15.8 percent. Families: Female: 37 percent; Male: 23.1 percent. Finances: Female: 18.4 percent; Male: 17.9 percent. Grief and Loss: Female: 18.2 percent; Male: 13.8 percent. Housing: Female: 24 percent; Male: 17.9 percent. Indigenous Wellbeing: Female: 18.2 percent; Male: 16.7 percent. Mental Health: Female: 44.3 percent; Male: 36.2 percent. Parenting: Female: 19 percent; Male: 2.7 percent. Sexual Assault: Female: 1.05 percent; Male: 0.76 percent. Stress Management: Female: 23.1 percent; Male: 16.7 percent. Self-Harm: Female: 2.21 percent; Male: 1.63 percent. Youth: Female: 7.15 percent; Male: 1.3 percent. Veterans: Female: 0.76 percent; Male: 3.95 percent. Others: Female: 9.7 percent; Male: 21.4 percent. Note: All numerical data values are approximated.

Areas of health by gender. Source: Authors’ own work

Close modal
Figure 4
A line graph plots the percentage of reported concerns versus health areas.The graph is titled “Areas of Health - Indigenous status (percentage).” The horizontal axis is labeled “Health Areas” and has 20 markings labeled from left to right as follows: “Mental Health,” “Families,” “Indigenous Wellbeing,” “Housing,” “Domestic and Family Violence,” “Finances,” “Chronic Health,” “Disability,” “Stress Management,” “Grief and Loss,” “Other,” “Caring,” “Ageing,” “Parenting,” “Addictions,” “Youth,” “Chronic Pain,” “Self-Harm,” “Sexual Assault,” and “Veterans.” The vertical axis is labeled “Percentage of reported concerns” and has markings ranging from 0 to 20 percent in increments of 2 percent. The graph shows two line curves. The first curve for “Aboriginal and Torres Strait Islander Participants (number of responses equals 2038)” starts from (Mental Health, 12 percent), slopes down passing through coordinates (Families, 11.07 percent), (Indigenous Wellbeing, 7.8 percent), (Disability, 6.58 percent), (Parenting, 4.54 percent), (Addictions, 2.33 percent), (Self-Harm, 0.29 percent), and terminates at (Veterans, 0 percent). The second curve for “Non-Aboriginal Participants (number of responses equals 886)” starts from (Mental Health, 12.7 percent), moves in a zigzag fashion passing through coordinates (Indigenous Wellbeing, 0 percent), (Housing, 4.7 percent), (Domestic and Family Violence, 2.33 percent), (Finances, 2.33 percent), (Chronic Health, 15.7 percent), (Disability, 4.78 percent), (Stress Management, 6.4 percent), (Grief and Loss, 2.91 percent), (Other, 2.66 percent), (Ageing, 17.8 percent), (Parenting, 0.95 percent), (Youth, 0.62), (Chronic Pain, 7.48), (Self-Harm, 0.78), (Sexual Assault, 0.46), and terminates at (Veterans, 1.8). Note: All numerical data values are approximated.

Aboriginal and Torres Strait Islander status and area of health. Source: Authors’ own work

Figure 4
A line graph plots the percentage of reported concerns versus health areas.The graph is titled “Areas of Health - Indigenous status (percentage).” The horizontal axis is labeled “Health Areas” and has 20 markings labeled from left to right as follows: “Mental Health,” “Families,” “Indigenous Wellbeing,” “Housing,” “Domestic and Family Violence,” “Finances,” “Chronic Health,” “Disability,” “Stress Management,” “Grief and Loss,” “Other,” “Caring,” “Ageing,” “Parenting,” “Addictions,” “Youth,” “Chronic Pain,” “Self-Harm,” “Sexual Assault,” and “Veterans.” The vertical axis is labeled “Percentage of reported concerns” and has markings ranging from 0 to 20 percent in increments of 2 percent. The graph shows two line curves. The first curve for “Aboriginal and Torres Strait Islander Participants (number of responses equals 2038)” starts from (Mental Health, 12 percent), slopes down passing through coordinates (Families, 11.07 percent), (Indigenous Wellbeing, 7.8 percent), (Disability, 6.58 percent), (Parenting, 4.54 percent), (Addictions, 2.33 percent), (Self-Harm, 0.29 percent), and terminates at (Veterans, 0 percent). The second curve for “Non-Aboriginal Participants (number of responses equals 886)” starts from (Mental Health, 12.7 percent), moves in a zigzag fashion passing through coordinates (Indigenous Wellbeing, 0 percent), (Housing, 4.7 percent), (Domestic and Family Violence, 2.33 percent), (Finances, 2.33 percent), (Chronic Health, 15.7 percent), (Disability, 4.78 percent), (Stress Management, 6.4 percent), (Grief and Loss, 2.91 percent), (Other, 2.66 percent), (Ageing, 17.8 percent), (Parenting, 0.95 percent), (Youth, 0.62), (Chronic Pain, 7.48), (Self-Harm, 0.78), (Sexual Assault, 0.46), and terminates at (Veterans, 1.8). Note: All numerical data values are approximated.

Aboriginal and Torres Strait Islander status and area of health. Source: Authors’ own work

Close modal
Figure 5
A line graph is titled “Main Areas of Health and Intervention Types”.The horizontal axis has 19 markings labeled from left to right as follows: “Advocacy,” “Assessment,” “Case Conference,” “Counselling - crisis,” “Counselling - intermediate,” “Counselling - ongoing,” “Case management,” “Choice Education,” “Emotional Support,” “Exploring issue,” “Family meeting,” “Goal Setting,” “Information provision,” “Referral,” “Research information,” “Review,” “Support application,” “Welfare Check,” and “Other.” The vertical axis has markings ranging from 0 to 800 in increments of 100 units. The graph shows 4 line curves. The first curve for “Ageing” starts from (Advocacy, 100), moves in a zigzag fashion passing through coordinates (Assessment, 119), (Case Conference, 11.7), (Counselling - ongoing, 8.49), (Case management, 57.4), (Choice Education, 50.9), (Exploring issue, 139), (Family meeting, 11.7), (Information provision, 100), (Research information, 21.5), (Review, 24.8), (Support application, 64), (Welfare Check, 8.4), and terminates at (other, 0). The second curve for “Chronic Health” starts from (Advocacy, 214.2), moves in a zigzag fashion passing through coordinates (Assessment, 246.8), (Case Conference, 41.1), (Counselling - crisis, 24.8), (Counselling - intermediate, 50.9), (Counselling - ongoing, 31.3), (Case management, 142.3), (Choice Education, 100), (Exploring issue, 300), (Family meeting, 37.8), (Information provision, 200), (Research information, 50.9), (Support application, 168.4), (Welfare Check, 24.8), and terminates at (other, 21.5). The third curve for “Families” starts from (Advocacy, 325), moves in a zigzag fashion passing through coordinates (Assessment, 354), (Case Conference, 90.12), (Counselling - crisis, 67.2), (Counselling - intermediate, 100), (Counselling - ongoing, 73.8), (Case management, 240.3), (Choice Education, 142.3), (Exploring issue, 468.9), (Family meeting, 77), (Goal Setting, 305), (Information provision, 335), (Referral, 266), (Research information, 73), (Review, 103.1), (Support application, 286), (Welfare Check, 47.6), and terminates at (Other, 21.5). The fourth curve for “Mental Health” starts from (Advocacy, 452.5), moves in a zigzag fashion passing through coordinates (Assessment, 524.4), (Case Conference, 132.5), (Counselling - intermediate, 165.2), (Counselling - ongoing, 116.2), (Case management, 351.3), (Choice Education, 217.4), (Exploring issue, 713.8), (Family meeting, 109.7), (Goal Setting, 491.7), (Information, provision, 498.2), (Referral, 426.4), (Research information, 100), (Review, 162), (Support application, 423.1), (Welfare Check, 73.8), and terminates at (Other, 31.3). Note: All numerical data values are approximated.

Selected area of health and interventions. Source: Authors’ own work

Figure 5
A line graph is titled “Main Areas of Health and Intervention Types”.The horizontal axis has 19 markings labeled from left to right as follows: “Advocacy,” “Assessment,” “Case Conference,” “Counselling - crisis,” “Counselling - intermediate,” “Counselling - ongoing,” “Case management,” “Choice Education,” “Emotional Support,” “Exploring issue,” “Family meeting,” “Goal Setting,” “Information provision,” “Referral,” “Research information,” “Review,” “Support application,” “Welfare Check,” and “Other.” The vertical axis has markings ranging from 0 to 800 in increments of 100 units. The graph shows 4 line curves. The first curve for “Ageing” starts from (Advocacy, 100), moves in a zigzag fashion passing through coordinates (Assessment, 119), (Case Conference, 11.7), (Counselling - ongoing, 8.49), (Case management, 57.4), (Choice Education, 50.9), (Exploring issue, 139), (Family meeting, 11.7), (Information provision, 100), (Research information, 21.5), (Review, 24.8), (Support application, 64), (Welfare Check, 8.4), and terminates at (other, 0). The second curve for “Chronic Health” starts from (Advocacy, 214.2), moves in a zigzag fashion passing through coordinates (Assessment, 246.8), (Case Conference, 41.1), (Counselling - crisis, 24.8), (Counselling - intermediate, 50.9), (Counselling - ongoing, 31.3), (Case management, 142.3), (Choice Education, 100), (Exploring issue, 300), (Family meeting, 37.8), (Information provision, 200), (Research information, 50.9), (Support application, 168.4), (Welfare Check, 24.8), and terminates at (other, 21.5). The third curve for “Families” starts from (Advocacy, 325), moves in a zigzag fashion passing through coordinates (Assessment, 354), (Case Conference, 90.12), (Counselling - crisis, 67.2), (Counselling - intermediate, 100), (Counselling - ongoing, 73.8), (Case management, 240.3), (Choice Education, 142.3), (Exploring issue, 468.9), (Family meeting, 77), (Goal Setting, 305), (Information provision, 335), (Referral, 266), (Research information, 73), (Review, 103.1), (Support application, 286), (Welfare Check, 47.6), and terminates at (Other, 21.5). The fourth curve for “Mental Health” starts from (Advocacy, 452.5), moves in a zigzag fashion passing through coordinates (Assessment, 524.4), (Case Conference, 132.5), (Counselling - intermediate, 165.2), (Counselling - ongoing, 116.2), (Case management, 351.3), (Choice Education, 217.4), (Exploring issue, 713.8), (Family meeting, 109.7), (Goal Setting, 491.7), (Information, provision, 498.2), (Referral, 426.4), (Research information, 100), (Review, 162), (Support application, 423.1), (Welfare Check, 73.8), and terminates at (Other, 31.3). Note: All numerical data values are approximated.

Selected area of health and interventions. Source: Authors’ own work

Close modal
Figure 6
A horizontal bar graph is titled “Referrals made by Social Worker”.The horizontal axis has markings ranging from 0 to 160 in increments of 20 units. The vertical axis has 40 markings labeled from top to bottom as follows: “General Practitioner,” “Aged Care,” “Mental Health,” “N D I S,” “Domestic Violence,” “Housing,” “Psychologist,” “Occupational Therapist,” “Centrelink,” “Legal Service,” “Social Emotional Wellbeing Program,” “Psychiatrist,” “Financial Counsellor,” “External Agency,” “Nurse,” “Physiotherapist,” “Counsellor,” “Department of Veterans Affairs,” “Family Wellbeing Service,” “Community Worker,” “Child Safety,” “Dietician,” “Police,” “Addiction Counsellor,” “Ambulance,” “Cardiologist,” “Carer Gateways,” “Community Corrections,” “Funeral Support,” “Food Relief,” “Hospital,” “Integrated Care Team,” “Job provider,” “Justice Group,” “Justice of Peace,” “Medical Director,” “Rehabilitation Service,” “Sexual Assault Secialist,” “Women's Group,” and “Workcover.” The data from the bars on the graph is as follows: General Practitioner: 139. Aged Care: 107. Mental Health: 55. N D I S: 54. Domestic Violence: 23. Housing: 23. Psychologist: 20. Occupational Therapist: 14. Centrelink: 14. Legal Service: 14. Social Emotional Wellbeing Program: 12. Psychiatrist: 11. Financial Counsellor: 7. External Agency: 7. Nurse: 6. Physiotherapist: 5. Counsellor: 3. Department of Veterans Affairs: 3. Family Wellbeing Service: 3. Community Worker: 2. Child Safety: 2. Dietician: 2. Police: 2. Addiction Counsellor: 1. Ambulance: 1. Cardiologist: 1. Carer Gateways: 1. Community Corrections: 1. Funeral Support: 1. Food Relief: 1. Hospital: 1. Integrated Care Team: 1. Job provider: 1. Justice Group: 1. Justice of Peace: 1. Medical Director: 1. Rehabilitation Service: 1. Sexual Assault Secialist: 1. Women's Group: 1. Workcover: 1.

Referral points. Source: Authors’ own work

Figure 6
A horizontal bar graph is titled “Referrals made by Social Worker”.The horizontal axis has markings ranging from 0 to 160 in increments of 20 units. The vertical axis has 40 markings labeled from top to bottom as follows: “General Practitioner,” “Aged Care,” “Mental Health,” “N D I S,” “Domestic Violence,” “Housing,” “Psychologist,” “Occupational Therapist,” “Centrelink,” “Legal Service,” “Social Emotional Wellbeing Program,” “Psychiatrist,” “Financial Counsellor,” “External Agency,” “Nurse,” “Physiotherapist,” “Counsellor,” “Department of Veterans Affairs,” “Family Wellbeing Service,” “Community Worker,” “Child Safety,” “Dietician,” “Police,” “Addiction Counsellor,” “Ambulance,” “Cardiologist,” “Carer Gateways,” “Community Corrections,” “Funeral Support,” “Food Relief,” “Hospital,” “Integrated Care Team,” “Job provider,” “Justice Group,” “Justice of Peace,” “Medical Director,” “Rehabilitation Service,” “Sexual Assault Secialist,” “Women's Group,” and “Workcover.” The data from the bars on the graph is as follows: General Practitioner: 139. Aged Care: 107. Mental Health: 55. N D I S: 54. Domestic Violence: 23. Housing: 23. Psychologist: 20. Occupational Therapist: 14. Centrelink: 14. Legal Service: 14. Social Emotional Wellbeing Program: 12. Psychiatrist: 11. Financial Counsellor: 7. External Agency: 7. Nurse: 6. Physiotherapist: 5. Counsellor: 3. Department of Veterans Affairs: 3. Family Wellbeing Service: 3. Community Worker: 2. Child Safety: 2. Dietician: 2. Police: 2. Addiction Counsellor: 1. Ambulance: 1. Cardiologist: 1. Carer Gateways: 1. Community Corrections: 1. Funeral Support: 1. Food Relief: 1. Hospital: 1. Integrated Care Team: 1. Job provider: 1. Justice Group: 1. Justice of Peace: 1. Medical Director: 1. Rehabilitation Service: 1. Sexual Assault Secialist: 1. Women's Group: 1. Workcover: 1.

Referral points. Source: Authors’ own work

Close modal

Supplements

References

AASW
(
2024a
), “
AASW accredited mental health social worker application criteria
”,
available at:
 https://www.aasw.asn.au/credentials/aasw-accredited-mental-health-social-worker-application-criteria/ (
accessed
 30 September 2024).
AASW
(
2024b
), “
What social workers do
”,
available at:
 https://www.aasw.asn.au/social-work/about-social-work/what-social-workers-do/ (
accessed
 20 September 2024).
Ashcroft
,
R.
,
Lam
,
S.
,
Feryn
,
N.
,
Sur
,
D.
,
Abudiab
,
S.
,
Sheffield
,
P.
,
Rayner
,
J.
,
Mehta
,
K.
and
Brown
,
J.
(
2023
), “
A mixed-methods examination of the role of social work in primary care teams in Ontario, Canada
”, doi: .
Ashcroft
,
R.
,
Sheffield
,
P.
,
Adamson
,
K.
,
Phelps
,
F.
,
Webber
,
G.
,
Walsh
,
B.
,
Dallaire
,
L.F.
,
Sur
,
D.
,
Kemp
,
C.
,
Rayner
,
J.
,
Lam
,
S.
and
Brown
,
J.B.
(
2024
), “
Scoping review of social workers’ professional roles in primary care
”,
BMJ Open
, Vol. 
14
No. 
12
, e090527, doi: .
Australian Bureau of Statistics
(
2022
), “
Snapshot of Australia
”,
available at:
 https://www.abs.gov.au/statistics/people/people-and-communities/snapshot-australia/2021 (
accessed
 10 May 2024).
Australian Government
(
2025a
), “
Workforce incentive program (wip) – practice stream
”,
Department of Health and Aged Care, available at:
 https://www.health.gov.au/our-work/workforce-incentive-program/practice-stream (
accessed
 7 Februay 2025).
Australian Government
(
2025b
), “
Consultations and grants
”,
Department of Veteran’s Affairs, available at:
 https://www.dva.gov.au/about-us/overview/consultations-and-grants (
accessed
 7 February 2025).
Australian Government
(
2025c
), “
Practice incentive program
”,
Services Australia, available at:
 https://www.servicesaustralia.gov.au/practice-incentives-program (
accessed
 7 February 2025).
Australian Government
(
2024
), “
MBS online. Note AN.0.49
”,
Department of Health and Aged Care, available at:
 https://www9.health.gov.au/mbs/fullDisplay.cfm?type=note&q=AN.0.49&qt=noteID&criteria=case%20conference (
accessed
 3 October 2024).
Barber
,
J.R.G.
,
Park
,
S.E.
,
Jensen
,
K.
,
Marshall
,
H.
,
McDonald
,
P.
,
McKinley
,
R.K.
,
Randles
,
H.
and
Albert
,
H.
(
2019
), “
Facilitators and barriers to teaching undergraduate medical students in general practice
”,
Medical Education
, Vol. 
53
No. 
8
, pp. 
778
-
787
, doi: .
Bland
,
R.
,
Drake
,
G.
and
Drayton
,
J.
(
2021
),
Social Work Practice in Mental Health : An Introduction
, (3rd ed.) ,
Routledge
.
Browne
,
A.J.
,
Varcoe
,
C.M.
,
Wong
,
S.T.
,
Smye
,
V.L.
,
Lavoie
,
J.
,
Littlejohn
,
D.
,
Tu
,
D.
,
Godwin
,
O.
,
Krause
,
M.
,
Khan
,
K.B.
,
Fridkin
,
A.
,
Rodney
,
P.
,
O'Neil
,
J.
and
Lennox
,
S.
(
2012
), “
Closing the health equity gap: evidence-based strategies for primary health care organizations
”,
International Journal for Equity in Health
, Vol. 
11
No. 
1
, pp. 
1
-
15
, doi: ,
available at:
 http://www.equityhealthj.com/content/11/1/59
Bussey
,
S.R.
and
Dobrof
,
J.
(
2024
), “
Social work’s opportunity and obligation to achieve population health equity
”,
Social Work in Health Care
, Vol. 
63
No. 
3
, pp. 
154
-
167
, doi: .
Creswell
,
J.W.
,
Plano
,
V.
and
Clark
,
V.
(
2018
),
Designing and Conducting Mixed Methods Research
,
Sage
,
Thousand Oaks
.
de Saxe Zerden
,
L.
,
Lombardi
,
B.
,
Fraser
,
M.
,
Jones
,
A.
and
Rico
,
Y.
(
2018
), “
Social work: integral to interprofessional education and integrated practice
”,
Journal of Interprofessional Education and Practice
, Vol. 
10
, pp. 
67
-
75
, doi: .
Department of Health and Aged Care
(
2023
), “
Strengthening Medicare taskforce report
”,
available at:
 https://www.health.gov.au/resources/publications/strengthening-medicare-taskforce-report?language=en
Dobl
,
S.
,
Beddoe
,
L.
and
Huggard
,
P.
(
2017
), “
Primary health care social work in Aotearoa New Zealand: an exploratory investigation
”,
Aotearoa New Zealand Social Work
, Vol. 
29
No. 
2
, pp. 
119
-
130
, doi: .
Gerber
,
T.
,
Hernandez
,
L.D.
,
Rüegg
,
R.
,
Vetter
,
D.
and
Zeller
,
A.
(
2025
), “
Social issues in general practice – a survey assessing the interprofessional perspective of general practitioners and social workers regarding frequency, challenges, and needs
”,
BMC Primary Care
, Vol. 
26
No. 
1
, p.
11
, doi: .
Grazino
,
A.
and
Raulin
,
M.
(
2013
),
Research Methods. A Process of Inquiry
, (8th ed.) ,
Pearson
,
Boston
.
Harrison
,
C.
and
Niroshan Siriwardena
,
A.
(
2018
), “
Multimorbidity
”,
Australian Journal of General Practice
, Vol. 
47
Nos
1-2
, p.
7
.
Hawk
,
M.
,
Ricci
,
E.
,
Huber
,
G.
and
Myers
,
M.
(
2015
), “
Opportunities for social workers in the patient centered medical home
”,
Social Work in Public Health
, Vol. 
30
No. 
2
, pp. 
175
-
184
, doi: .
Kidd
,
M.
,
Rhee
,
J.
,
Sharma
,
A.
,
Harris-Roxas
,
B.
,
Harris
,
M.
,
van Kemenade
,
C.
,
Burns
,
M.
,
Marshall
,
K.
,
Ali
,
R.
,
Sunjaya
,
A.
,
Kearns
,
R.
,
Wright
,
M.
,
Bates
,
S.
,
El Hadad
,
N.
,
Sitas
,
F.
and
Barr
,
M.
(
2024
), “
Review of general practice incentives – international evidence and literature review report
”,
Faculty of Medicine and Health, UNSW Sydney, available at:
 https://www.health.gov.au/resources/publications/review-of-general-practice-incentives-international-evidence-and-literature-review?language=en (
accessed
 25 February 2025).
Korff
,
J.
(
2023
), “
Aboriginal life expectancy
”,
available at:
 https://www.creativespirits.info/aboriginalculture/health/aboriginal-life-expectancy
Lalani
,
M.
and
Marshall
,
M.
(
2020
), “
Co‐location, an enabler for service integration? Lessons from an evaluation of integrated community care teams in East London
”,
Health and Social Care in the Community
, Vol. 
30
No. 
2
, pp. 
e388
-
e396
, doi: .
Löwe
,
C.
,
Mark
,
P.
,
Sommer
,
S.
and
Weltermann
,
B.
(
2022
), “
Collaboration between general practitioners and social workers: a scoping review
”,
BMJ Open
, Vol. 
12
No. 
6
, e062144, doi: .
McGorry
,
P.D.
,
Coghill
,
D.
and
Berk
,
M.
(
2023
), “
Mental health of young Australians: dealing with a public health crisis
”,
The Medical Journal of Australia
, Vol. 
219
No. 
6
, pp. 
246
-
249
, doi: .
Milano
,
N.
,
Petruzzi
,
L.
,
Covington
,
E.
,
Jones
,
B.
and
Findley
,
P.A.
(
2022
), “
Social workers in integrated care beyond primary care: a scoping review
”,
Translational Behavioral Medicine
, Vol. 
12
No. 
11
, pp. 
1038
-
1048
, doi: .
Mursa
,
R.
,
Patterson
,
C.
and
Halcomb
,
E.
(
2022
), “
Men’s help‐seeking and engagement with general practice: an integrative review
”,
Journal of Advanced Nursing
, Vol. 
78
No. 
7
, pp. 
1938
-
1953
, doi: .
National Disability Scheme
(
2025
), “
Pricing arrangements
”,
available at:
 https://www.ndis.gov.au/providers/pricing-arrangements#ndis-price-guide-2020-21 (
accessed
 7 February 2025).
Northern Queensland Primary Health Network [NQPHN]
(
2020
), “
Health needs assessment. 2022-2024
”,
available at:
 https://www.nqphn.com.au/sites/default/files/2022-03/NQPHN%20Health%20Needs%20Assessment%202022-
O'Brien
,
K.H.
(
2019
), “
Social determinants of health: the how, who, and where screenings are occurring; a systematic review
”,
Social Work in Health Care
, Vol. 
58
No. 
8
, pp. 
719
-
745
, doi: .
Pearson
,
O.
,
Schwartzkopff
,
K.
,
Dawson
,
A.
,
Hagger
,
C.
,
Karagi
,
A.
,
Davy
,
C.
,
Brown
,
A.
and
Braunack-Mayer
,
A.
(
2020
), “
Aboriginal community controlled health organisations address health equity through action on the social determinants of health of Aboriginal and Torres Strait Islander peoples in Australia
”,
BMC Public Health
, Vol. 
20
No. 
1859
, pp. 
1
-
13
, doi: .
Pirkis
,
J.
,
Currier
,
D.
,
Harris
,
M.
,
Mihlopoulos
,
C.
,
Arya
,
V.
,
Banfield
,
M.
,
Bassilios
,
B.
,
Buchanan
,
B.
,
Butterworth
,
P.
,
Brophy
,
L.
and
Burgess
,
P.
(
2022
), “
Evaluation of better access. Executive summary. 2022
”,
available at:
 https://www.health.gov.au/our-work/better-access-evaluation (
accessed
 30 September 2024).
Royal Australian College of General Practitioners
(
2023
), “
General practice: health of the nation 2023
”,
available at:
 https://www.racgp.org.au/general-practice-health-of-the-nation-2023 (
accessed
 30 September 2024).
Royal Australian College of General Practitioners
(
2024a
), “
The vision for general practice
”,
The model for high-quality patient care, available at:
 https://www.racgp.org.au/advocacy/advocacy-resources/the-vision-for-general-practice/the-vision/the-model-for-high-quality-patient-care#ref-num-36 (
accessed
 3 October 2024).
Royal Australian College of General Practitioners
(
2024b
), “
General practice: health of the nation 2024
”,
available at:
 https://www.racgp.org.au/general-practice-health-of-the-nation (
accessed
 30 July 2025).
Suetani
,
S.
,
Gill
,
N.
and
Salvador‐Carulla
,
L.
(
2024
), “
The mental health crisis needs more than increased investment in the mental health system
”,
The Medical Journal of Australia
, Vol. 
220
No. 
9
, pp. 
443
-
451
, doi: .
Tadic
,
V.
,
Ashcroft
,
R.
,
Brown
,
J.B.
and
Dahrouge
,
S.
(
2020
), “
The role of social workers in interprofessional primary healthcare teams
”,
Healthcare Policy
, Vol. 
16
No. 
1
, pp. 
27
-
42
, doi: .
World Health Organisation [WHO]
(
2016
), “
Integrated people-centred care
”,
available at:
 https://www.who.int/health-topics/integrated-people-centered-care#tab=tab_2
World Health Organisation [WHO]
(
2018
), “
A vision for primary health care in the 21st Century: towards universal health coverage and Sustainable Development Goals
”,
United Nations Children’s Fund (UNICEF), available at:
 https://iris.who.int/bitstream/handle/10665/328065/WHO-HIS-SDS-2018.15eng.pdf?sequence=1 (
accessed
 1 May 2024).
Zimmerman
,
A.
(
2024
), “
Understanding the nuances: multidisciplinary, interdisciplinary, cross-disciplinary and interprofessional approaches in accredited continuing healthcare education
”,
Alliance for Continuing Education in the Health Professions, available at:
 https://almanac.acehp.org/Education/Education-Article/understanding-the-nuances-multidisciplinary-interdisciplinary-cross-disciplinary-and-interprofessional-approaches-in-accredited-continuing-healthcare-education
Zuchowski
,
I.
and
McLennan
,
S.
(
2023
), “
A systematic review of social work in general practice: opportunities and challenges
”,
Journal of Evidence-Based Social Work
, Vol. 
20
No. 
5
, pp. 
686
-
726
, doi: .
Zuchowski
,
I.
,
Kuruvila
,
A.
,
Lee
,
R.
and
McLennan
,
S.
(
2024
), “
Integrating social work into general practice in Australia: protocol of an intervention study
”,
Journal of Integrated Care
, Vol. 
32
No. 
4
, pp. 
481
-
490
, doi: .

Languages

or Create an Account

Close Modal
Close Modal