


This study integrates economic, environmental, and social dimensions into the distribution network for India’s Public Distribution System (PDS). It aims to identify multi-modal strategies that balance cost efficiency, lower emissions, and community well-being.
A model is proposed to allocate grains from base to field silos via road, rail, and inland waterways considering Triple Bottom Line (TBL). The costs, emissions, and social factors (e.g. employment) were quantified and combined to generate a composite score, enabling rigorous trade-off evaluation.
Results from a representative case study show that integrating rail and waterways reduces total costs and emissions while boosting employment and community welfare. Intermodal configurations improve the PDS’s sustainability, demonstrating the feasibility of aligning economic objectives with environmental and social outcomes.
Future work could incorporate stochastic demand or disruptions, and extend beyond a single commodity or region, enhancing the model’s robustness and generalizability.
Insights guide planners in selecting routes, modes, and facility investments aligned with cost reduction, emissions control, and social uplift.
The approach promotes inclusive development by increasing employment opportunities and ensuring a more equitable distribution of benefits in vulnerable communities.
This research extends conventional cost-centric frameworks by incorporating TBL metrics in a large-scale, government-run distribution setting. It provides a practical blueprint, informing infrastructural investments and policy interventions for holistic, enduring improvements in food security and resource utilization.
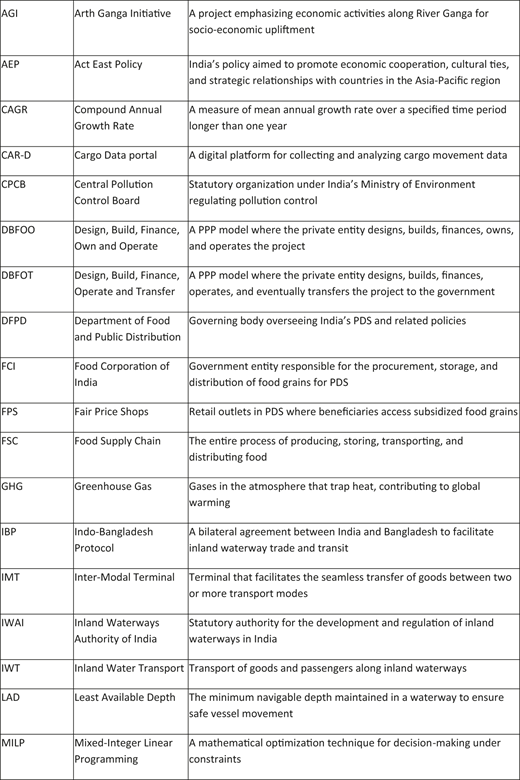
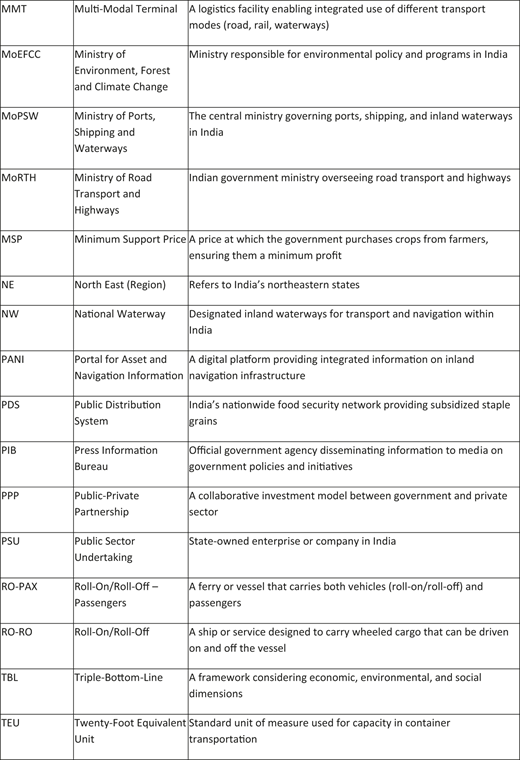
Abbreviations
1. Introduction
India’s PDS is one of the world’s largest government-driven food distribution frameworks, providing subsidized staple grains (notably rice and wheat) to more than 800 million beneficiaries (DFPD, 2023). Operationalizing this expansive system involves large-scale procurement, storage in central and state warehouses, and final distribution through FPS. Despite significant investments in infrastructure, it faces well-documented inefficiencies-high transport costs, suboptimal resource utilization, and rising environmental and social externalities (Kaur and Gupta, 2024). Traditionally, the FCI has relied heavily on road transport, often incurring higher costs and carbon footprints than alternatives such as rail or inland waterways (FCI, 2023). In recent years, the Government of India has intensified efforts to modernize storage and transportation infrastructure, notably through Public-Private Partnerships (PPP) in silo construction and the development of multi-modal freight corridors. For instance, several state-of-the-art silo projects, each with a capacity of around 50,000 MT, have been completed under the DBFOO/DBFOT models in locations such as Darbhanga, Samastipur, Sahnewal, Baroda, Chheheratta, and Batala. These modern silos, equipped with dedicated rail sidings and automated systems, aim to enhance preservation, reduce losses, and lower operational costs while fostering local employment opportunities (Mogale et al., 2018). Concurrently, inland waterway projects have expanded significantly, with cargo movement on National Waterways increasing from 18.10 million tons in 2013–14 to over 133 million tons in 2023–24, reflecting the government’s push for multi-modal connectivity (PIB, 2022). Such infrastructural reforms are designed to complement the PDS, enabling more efficient, lower-carbon, and socially inclusive supply chains.
Yet, identifying the optimal distribution strategies that harmonize cost efficiency, environmental integrity, and social welfare remains challenging. Although several studies focus on cost-based optimization of agri-food logistics, a holistic TBL perspective encompassing economic, environmental, and social dimensions remains limited in the PDS context. Recent research has underscored that comprehensive integration of metrics such as CO2 emissions, employment generation, and balanced regional development can lead to more sustainable solutions (Sharifi et al., 2024; Yousefi-Babadi et al., 2023; Mishra et al., 2022). Government initiatives such as the modernization of inland terminals (e.g. the planned terminal at Kalughat in Bihar), the operationalization of integrated waterway routes for grain transport (e.g. Patna to Pandu via Indo-Bangladesh protocol), and public announcements highlighting a shift towards multi-modal connectivity (PIB, 2022) further validate the need to evaluate distribution strategies against multiple performance dimensions. The FCI typically sources staples from states like Punjab, Haryana, and Madhya Pradesh, then distributes them to diverse consumption regions across Eastern, Western, and Southern India. Figure 1 offers a schematic overview of this network, tracing the movement of wheat from farmers and procurement centers through a series of specialized storage nodes such as base and field silos to regional silos and, ultimately, to FPSs that serve end beneficiaries. With expanding procurement bases (e.g. Chhattisgarh, Odisha) and improved infrastructure such as modern silos and multi-modal terminals, there is a strategic opportunity to shift from a road-centric model to one leveraging rail and inland waterways. A MILP model that incorporates economic, environmental, and social objectives can provide the rigorous decision support needed to capitalize on these infrastructural advancements (Nie et al., 2023). This study aims to:
- (1)
Develop a model that integrates TBL objectives into transportation decisions for India’s PDS.
- (2)
Utilize realistic, context-specific data such as distances, costs, emission factors, and social indicators to ensure model relevance and applicability.
- (3)
Evaluate various modal configurations, including recently operationalized silos and inland waterway routes, to identify the most balanced solution using a weighted composite metric.
By fulfilling these objectives, this research offers a novel methodological lens to sustainable agri-food logistics and provides actionable insights for policymakers and stakeholders in India’s PDS. Such guidance is essential for leveraging new infrastructure spanning from mechanized silos to enhanced inland waterways and ensuring that cost reductions, carbon mitigation, and social benefits move forward in unison.
2. Literature review
The optimization of agri-food supply chains, particularly those operated under public distribution mechanisms, has evolved considerably over the past two decades. Initially, research was dominated by cost-centric models that treated logistics purely as a minimization of transportation expenses (Sonar et al., 2024). Gradually, the scope broadened to incorporate service-level constraints and basic environmental considerations (Manigandan et al., 2024). More recently, scholars have embraced TBL frameworks, integrating economic, environmental, and social factors and it is an approach vital for large-scale government initiatives such as India’s PDS. The PDS in India dates back several decades, evolving from the early 1950s as a rationing system to today’s expansive network. Historically, long-distance movements of staples (notably wheat and rice) relied heavily on rail (covering over 60% of inter-state movements by volume in the 1970 and 1980s), gradually shifting towards road transport with the expansion of the national highway network (Bohtan et al., 2020). By the mid-2000s, road transport accounted for approximately 65–70% of the final mile movement of grains due to increased trucking availability and flexible scheduling (Mogale et al., 2017). However, with national targets to reduce carbon intensity by 33–35% from 2005 levels by 2030 (UNFCC, 2015), the infrastructural push for inland waterways (notably National Waterway-1 along the Ganga) and the Dedicated Freight Corridor (DFC) for rail freight (DFCCIL, 2024) has reintroduced the possibility of multi-modal optimization. Given that inland waterway transport emits as little as 0.01–0.02 kg CO2/ton-km compared to road’s 0.08–0.12 kg CO2/ton-km (TERI, 2022), rethinking mode assignments can yield substantial environmental dividends.
Traditional optimization approaches, such as linear programming (LP) and MILP, have been widely applied in supply chain contexts, focusing primarily on cost minimization. Studies have emphasized the reduction of transportation and handling expenses within PDS logistics without explicitly addressing environmental or social externalities (Mogale et al., 2020a, b). While these studies laid the groundwork for improved logistics in PDS, their exclusive focus on cost often neglected the long-term sustainability and social equity components that are increasingly central to policy agendas in India. In response to global sustainability drives, researchers have begun incorporating environmental metrics such as greenhouse gas emissions and social factors like employment generation, accident rates, and community disruptions into optimization frameworks (Mogale et al., 2023; Khan et al., 2021). The resulting models, often referred to as Multi-Criteria Decision Making (MCDM) or multi-objective optimization, typically involve solving formulations including composite metrics of social impacts. For India’s logistics sector, Mari et al. (2014) considered emissions reduction as a secondary objective, while Dubey et al. (2015) integrated a three-objective framework: cost, emission, and time-related service levels. Few studies, however, directly apply these frameworks to the PDS, despite its scale and social significance. Additionally, several researchers have investigated the evolution and efficacy of the PDS between 2000 and 2015, underscoring logistical bottlenecks and systemic inefficiencies. For instance, Khera (2011) examined the utilization and impact of PDS on food security across Indian states, highlighting infrastructural challenges that hindered efficient distribution. Puri (2012) explored reforms aimed at improving transparency and reducing leakages, indirectly pointing to the need for innovative distribution channels. Meanwhile, the Planning Commission (2015) had earlier advocated for experiments with multiple transport modes, yet actual implementation was sporadic due to limited connectivity and lack of robust multi-modal networks.
Most relevant to the Indian context is the nascent literature on multi-modal optimization. Incorporating different transportation modes (road, rail, water) requires detailed data on distances, costs, capacities, and handling times. Inland water transport, still underutilized in India, can handle large bulk volumes at lower costs (₹0.8–1.2 per ton-km) and lower emissions (0.01–0.02 kg CO2/ton-km) (Nayak et al., 2024; TERI, 2022). Incorporating these modes in optimization models has proven valuable in other geographic contexts (e.g. European Union supply chains), but Indian research remains limited. Studies that consider multi-modal logistics for food grains generally highlight potential cost reductions of 10–15% and emission cuts of up to 30–40% compared to road-only solutions (Kim and Lee, 2022). However, these figures are often theoretical, as actual utilization of waterways and dedicated freight rail corridors is still emerging. The ongoing development of National Waterways (e.g. NW-1 from Allahabad to Haldia) and the Dedicated Freight Corridors (Eastern and Western DFCs) provide tangible infrastructure to test these models (ESCAP, 2023). Prior research also shows that multi-modal transport strategies were acknowledged but not extensively adopted (Parthiban et al., 2011; Kumar et al., 2013). Parthiban et al. (2011), for example, reported that rail-water combinations, while discussed in policy circles, faced implementation barriers due to insufficient last-mile connectivity and storage infrastructure. Kumar et al. (2013) further underscored the limited scale of these experiments, finding that road transport remained dominant despite higher emissions, mainly because of its flexibility and shorter lead times. Nonetheless, these studies suggest that multi-modal frameworks could offer efficiency gains if infrastructure gaps are addressed.
Social factors, although acknowledged, are not always rigorously quantified. In the Indian context, the capacity of certain modes to generate employment, or conversely, their propensity to cause accidents, community fragmentation, and pollution in local areas, is crucial. For instance, road transport, while flexible, is associated with a higher accident rate (1.0–1.5 per million ton-km) and potentially more community disruptions (1.5–2.0 disruption units per million ton-km) (TRW, 2019; MOHUA, 2016). Conversely, rail and water transport often entail fewer accidents (0.3–0.5 per million ton-km for rail, 0.1–0.2 for water) and lower community disruption indexes (0.5–1.0 for rail and 0.2–0.5 for water), but may offer fewer local employment opportunities (MoLE, 2024). Incorporating these into an optimization model involves translating such qualitative and quantitative data into measurable coefficients. This not only allows for a social dimension in the objective function but also paves the way to compare and normalize these metrics alongside cost and emissions.
The literature indicates several key gaps relevant to the PDS. While TBL frameworks exist for certain agri-food chains, their direct application to India’s PDS, which involves state and central agencies, complex policy constraints, and variable infrastructure is limited. Most studies offering multi-modal solutions rely on simplified assumptions or test cases. There is a need for models that incorporate updated data from infrastructure projects like NW-1, the DFCs, and actual cost and emission metrics reflective of current scenarios. Methods to combine and compare economic, environmental, and social metrics often remain ad hoc. A systematic normalization of costs, emissions, and social impacts could yield a composite decision metric guiding policymakers. The PDS operates across varied terrains from mountainous Northeastern states to coastal Southern regions and each with different transport availability and challenges. Tailoring the model to reflect such diversity remains an open challenge.
In the next section, the problem is defined in detail, specifying the sets, parameters, and constraints that form the basis of the model. The model will draw from the insights gleaned here, ensuring that economic, environmental, and social metrics are rigorously incorporated and that multi-modal routes are realistically represented.
3. Model development to analyze the public distribution system in India
Constructing a rigorous framework for improving India’s PDS supply chain requires a careful formalization of the decision environment, data elements, and optimization relationships. This section presents a mathematically consistent model that encapsulates multi-modal transport, stable yet region-specific supply and demand profiles, and the complex interplay of cost efficiency with externalities related to environmental emissions and socio-economic repercussions.
3.1 Contextual framework
In the PDS, commodities (e.g. staple grains) move from central procurement nodes to a dispersed network of distribution points. These shipments confront not only minimum cost objectives but also constraints that reflect infrastructure limits, ecological considerations, and stakeholder well-being. The system under consideration comprises (Figure 1):
- (1)
Base silos: Strategically located aggregation points in surplus production regions or intermediate consolidation hubs.
- (2)
Destination silos: Facilities placed closer to consumption zones where subsidized grains are eventually delivered to Fair Price Shops.
- (3)
Feasible transportation modes: Potentially including roadway trucking, railway freight services, and inland/coastal waterways, each mode offering distinct trade-offs in terms of cost structure, emission intensity, capacity profiles, and social impact footprints.
Through the model (Figure 2), the aim is to prescribe allocations that minimize monetary expenditure, but only as a first step. Post-optimization, an extensive evaluation of environmental (CO2 emissions) and social (employment generation, accident risk, community disruption) metrics supports decision-making. The flowcharts underlying this methodology suggest a sequence: determine feasible networks of origin-destination-mode combinations, solve a cost-based optimization problem for each network, quantify environmental and social effects for the resulting solutions, and normalize and aggregate these criteria into a final decision score. The chosen network and allocation are those that best satisfy the composite triple-bottom-line objective.
3.2 Sets and indices
- (1)
Let represent the set of base silos, indexed by .
- (2)
Let represent the set of field silos, indexed by .
- (3)
Let denote the set of available transport modes, indexed by .
In practice, might be defined as . However, not all -pairs admit all modes. Some routes may lack navigable waterways or direct rail access. Hence, mode feasibility is route-specific.
3.3 Core input parameters
Supply and demand:
- (1)
: Maximum quantity (e.g. metric tons) available at base silo .
- (2)
: Minimum required quantity at field silo to ensure full distribution targets are met.
Transportation data:
- (1)
: Distance (km) from silo ii to silo jj via mode mm if feasible, otherwise undefined.
- (2)
: Monetary cost per ton-km for mode mm.
- (3)
: Per-ton transport cost on route using mode .
These cost parameters originate from field data compiled through governmental sources, official distance charts, and validated logistics databases. Each mode’s cost reflects fuel consumption, vehicle wear, handling charges, and other operational expenses.
Environmental and social parameters:
- (1)
: Emission factor (kg CO2 per ton-km) for mode .
- (2)
: Social indices representing employment generation (jobs/million ton-km), accident incidence (accidents/million ton-km), and community disruption (disruption units/million ton-km) respectively.
3.4 Decision variables
Let represent the shipment volume (e.g. metric tons) transported from base silo ii to field silo using mode mm. These continuous variables will be determined by the optimization model. Since every combination of can, in theory, be chosen, the solver will allocate flows to minimize total cost under the given constraints. The presence of multiple modes per route enables trade-offs: if a less expensive but more emission-intensive option is chosen, it might yield immediate cost gains but environmental drawbacks, which will matter later when the sustainability metrics are computed and normalized.
3.5 Mode assignment and feasibility
The problem’s structure can incorporate binary feasibility indicators or simply omit variables for infeasible route-mode pairs. If a route is not accessible (e.g. no waterway link), then does not appear in the formulation. Thus, feasibility is implicitly handled by variable definition. For routes that offer multiple modes, the model may split volumes across different transport options, provided that this leads to a lower overall cost.
3.6 Economic objective function
Initially, the focus is on cost minimization, solving a pure linear cost optimization problem (Figure 3). The objective is:
where denotes the subset of modes feasible for the -pair. This objective ensures that, given route availability and mode characteristics, the solver finds the least-cost allocation satisfying all supply and demand constraints.
3.7 Constraints
The constraints of the model are from supply, demand and non-negativity of the decision variables and are discussed below:
Supply constraints: Each origin’s total outbound flow cannot exceed its available stock:
Demand constraints: Each destination’s inflow must meet or surpass the required target:
Non-Negativity:
These constraints are linear and keep the problem within the realm of MILP. Since our variables are continuous and no integrality constraints are mandatory (unless minimum shipment sizes or discrete units are imposed), the complexity remains manageable. However, if certain policies require integer solutions (e.g. shipment in standardized batch units), integrality conditions could be introduced, albeit at a potential computational cost.
3.8 Network configurations and iterative evaluation
The approach described in the provided flowcharts suggests evaluating multiple “networks,” each representing a strategic set of mode-route availabilities or policy-driven restrictions. For instance:
- (1)
A baseline network may allow only road transport.
- (2)
An alternative network might permit both road and rail.
- (3)
Another network configuration might incorporate water transport where feasible.
For each such configuration , the above model is solved independently, yielding an optimal solution and a corresponding minimum cost .
Subsequently, environmental () and social () metrics are calculated from these allocations (Figures 4 and 5):
- (1)
Emissions:
- (2)
Social impact indicators: Define positive (employment) and negative (accident + disruption) impacts as:
The transformations from to , represent the quantification stage, integral to the flowchart’s logic. This stage is not about re-optimizing but about evaluating the chosen solution across multiple sustainability dimensions.
3.9 Normalization and composite scoring
Rather than directly blending raw values of cost, emissions, and social indicators—on incompatible scales—normalization is performed. Let denote normalized metrics, obtained by mapping each metric into a [0,1] range relative to best (min) and worst (max) values observed across all feasible networks. Specific normalization formulas will be introduced later, but the concept involves:
For employment, since it is a positive factor, adjustments may be made so that higher values contribute positively, potentially by using if negative impacts dominate, or by defining a separate normalization scheme. The composite scoring blends these normalized metrics using predefined weights for economic, environmental, and social aspects, respectively. The network that yields the minimal composite score indicates the most balanced solution.
3.10 Rationale and practical relevance
By structuring the problem in this manner, decision-makers within the PDS can first operate within a familiar economic optimization paradigm, ensuring that cost considerations often paramount in large-scale public programs are thoroughly addressed. After determining cost-optimal allocations, the model’s second phase reveals each allocation’s broader consequences. Only through this integrated approach can policymakers identify strategies that not only minimize government expenditure but also advance environmental stewardship and social responsibility. The final decision emerges from comparing different scenario outcomes, guided by normalized composite metrics that highlight trade-offs clearly.
This model’s adaptability allows for the incorporation of future data, such as anticipated changes in river navigability, evolving rail corridors, or policy shifts related to carbon taxation. Thus, it is not merely a static tool but an evolving decision-support framework aligned with ongoing efforts to modernize and “green” India’s PDS logistics.
4. Environmental and social impact quantification
Having established how the cost-minimal solutions for each network scenario are derived, the subsequent stages of the methodological framework are now addressed: calculating environmental emissions, identifying social outcomes, and implementing a multi-criteria evaluation protocol. This integrated assessment is essential for guiding strategic decisions in the Indian PDS context, where the long-term viability of supply chain choices depends not solely on cost efficiency, but also on mitigating ecological burdens and enhancing societal benefits.
4.1 Defining impact metrics
The solutions obtained from each feasible network scenario provide a unique allocation pattern—specified as tonnages moved along various origin-destination-mode routes. These allocations are now leveraged to compute quantifiable measures of environmental and social performance. Rather than adjusting these allocations (which remain fixed at their cost-optimal levels), each scenario’s solution is treated as a “portfolio” of flows, translating those flows into numeric indicators of externalities.
Environmental metric (emissions): Given mode-specific emission factors (kg CO2/ton-km) and known distances , all routes, and modes are aggregated to determine total network-level emissions. For a scenario :
This scalar value represents the cumulative CO2 emissions attributable to transporting the required volumes from base to field silos under the configuration assumed by scenario . Higher values signify environmentally costly distributions, while lower values indicate greener logistics strategies.
Social indicators (employment, accidents, and community disruption): In the Indian PDS, social considerations cover multiple dimensions: the opportunity for job creation in local communities, the risk of accidents along freight corridors, and the intangible but significant disruptions inflicted on communities located near busy transport routes.
Employment generation: Let denote the mode-specific employment factor (jobs per million ton-km). If a solution moves tons over km on mode mm, the employment contribution for that route is:
Summing over all routes and modes:
This captures how certain modes—such as road—tend to generate more local employment per million ton-km than others, influencing policy decisions that value socio-economic upliftment.
Accidents and community disruption: Two negative externalities—accident rates (per million ton-km) and community disruption (units per million ton-km)—are quantified similarly:
Aggregating over the entire network scenario gives:
Though these are separate indices, they both represent social “costs.” For composite decision-making, negative social impacts are combined as:
4.2 Normalization of metrics
Direct comparisons between cost, emission, and social metrics are complicated by their differing units and scales. To enable coherent multi-criteria analysis, each metric is normalized. Normalization maps raw values to dimensionless scores within [0,1], preserving relative differences and facilitating combined evaluations.
For each metric, the minimum and maximum values are identified across all feasible networks.
Since employment is beneficial (more employment is preferable), and the normalization is inverted if employment is to be considered as part of a positive contribution. One typical method is to treat negative social factors separately from the positive factor of employment, or to define a combined social metric that accounts for both. For simplicity, assume the study first focuses on negative social impacts acknowledging that employment considerations may be incorporated as an additional layer of analysis.
4.3 Weighting and composite score computation
A key step in multi-criteria decision-making involves specifying relative importance weights for economic, environmental, and social dimensions. Let with denote the decision-maker’s weight preferences. A policy-driven set of weights might reflect India’s current policy emphasis—perhaps for cost, for emissions, and for social impacts, though these values can vary depending on priorities.
The composite score for the scenario can be formulated as:
Employment is integrated by adjusting the social metric to account for both positive (jobs) and negative (accidents, disruptions) elements. The approach involves defining a net social indicator and then normalizing this combined metric. The exact functional form depends on stakeholder input and the level of complexity preferred.
4.4 Ranking and selection of optimal scenario
After computing for every candidate network scenario, these composite values are ranked from lowest to highest. The scenario with the smallest composite score is deemed the most balanced and, thus, the best candidate. Since each scenario has previously been solved to yield a cost-minimized distribution, and now thoroughly evaluated across environmental and social criteria, this final selection reflects a truly multi-dimensional optimization stance.
5. Application of the proposed model for a case environment
In this section, the developed framework is applied to a representative scenario drawn from India’s PDS. The objective is to demonstrate how distinct network configurations—each imposing certain mode availability constraints—lead to varying economic, environmental, and social outcomes. The procedure and results are discussed in Section 5.1 to Section 5.6.
5.1 Case context and data specification
For demonstration, consider a regionally focused case that links three base silos to three field silos, as outlined in Table 1.
All supply and demand figures are based on averaged data from official government reports, ensuring realistic magnitudes. Road, rail, and water are potential choices for transportation modes, but feasibility differs by route. As previously established, inland waterways are primarily available along the Ganga corridor, connecting Lucknow to Kolkata. Conversely, rail and road links span all major corridors, albeit with different costs and distances (Table 2).
5.2 Network configurations evaluated
Four network scenarios are considered, and each represents a distinct combination of modes that are allowed. This mirrors a policymaker’s perspective, testing “what if” scenarios rather than forcing the model to pick modes within a single run.
- (1)
Scenario A (baseline: road-only): All routes are road-enabled. Although costly and emission-intensive, this scenario is the status quo baseline.
- (2)
Scenario B (Road + Rail): Permits both trucking and railway freight on all corridors except where rail infrastructure is limited. For simplicity, rail connectivity presence is assumed on all B1-F1, B1-F2, B1-F3, B2-F1, B2-F2, B2-F3, and B3-F1, B3-F2, and B3-F3 pairs.
- (3)
Scenario C (Road + Rail + Water): In addition to Scenario B’s modes, water transport is introduced exclusively for the Lucknow-to-Kolkata route. This scenario tests the strategic use of inland waterways to reduce emissions.
- (4)
Scenario D (Rail + Water only): To explore a more radical departure from current patterns, road usage is disallowed. Rail and water must handle all flows. Though potentially less flexible, this scenario might reveal deeper sustainability gains at potential incremental cost.
5.3 Cost minimization results
For each scenario, the linear cost-minimization problem is solved independently. The results (obtained using a standard MILP solver SCIP) yield allocations and a minimum total cost. These allocations are derived from a single run per scenario and reflect how the optimizer leverages available routes and modes to minimize total expenditure.
Assuming all demands must be met exactly, the solver will adjust allocations accordingly. For Scenario A, it might reroute more shipments from Lucknow to Chennai, ensuring that the entire demand is met, even if that raises costs. In subsequent scenarios, rail and water availability can alter distribution patterns substantially—rail might divert flows from expensive road corridors, and water might move a portion of Lucknow-to-Kolkata shipments at a lower cost. After solving, the minimum costs are recorded – Typically, the introduction of rail reduces cost significantly compared to road-only, and adding water could further trim costs on selected routes.
5.4 Environmental and social metrics
Once each scenario’s cost-minimized allocation is known, emissions and social impacts are quantified. For instance, consider Scenario A (Road-Only). The predominantly road-based solution likely emits the most CO2. Emissions might be on the order of tens of millions of kg CO2 if large volumes and long distances are considered. Scenario B, introducing rail, might drastically reduce due to lower emission factors. Scenario C, with water, could drive even lower on certain corridors. Scenario D, rail-and-water only, may yield the lowest emissions, albeit at a potentially higher cost. Social metrics follow a similar pattern. Road tends to produce more local jobs, but also higher accident and disruption metrics. Rail and water are safer and less disruptive, but do not foster the same level of grassroots employment. Thus, Scenario A might excel in job creation but fare poorly in and . By contrast, Scenario D might be environmentally and socially less harmful (fewer accidents, less disruption) but also yield fewer employment opportunities along key routes.
5.5 Normalization and composite decision scores
Normalization is done using these raw metrics. Identification of min/max values across scenarios is shown in Table 3.
The normalization of the optimized value of each network along TBL is denoted as
With chosen weights, say , The composite score will be as mentioned below:
Comparing these composite scores (smaller the better) reveals which scenario strikes the best overall balance. Scenario D, which leverages rail and water, emerges as the top contender, offering significant emission reductions and moderate cost savings without excessively compromising on employment or inflating social externalities.
5.6 Discussion
From a policy perspective, the results indicate that broadening the mode mix can yield substantial improvements in sustainability while keeping cost increases at bay (or even reducing them). Although road-only networks may appear straightforward and socially advantageous (due to the high employability rate), however, they impose both logistics and environmental costs. Incorporating rail reduces emissions dramatically, and integrating water routes further aligns with India’s vision to utilize inland waterways for bulk transport, thus slashing carbon footprints and community disruptions. In the context of this particular case application linking three base silos (Nagpur, Bhopal, and Lucknow) to three field silos (Kolkata, Mumbai, and Chennai), the model highlights several nuanced trade-offs. For instance, the road-intensive Scenario A provides significant local employment opportunities in the region but also leads to high CO2 emissions and exposes communities to increased risk of accidents and congestion. This is particularly important given that in states like Maharashtra (Nagpur and Mumbai) and Uttar Pradesh (Lucknow), livelihoods along trucking corridors can be substantially affected by freight route decisions. Meanwhile, the introduction of water transport in Scenario C and D benefits the Ganga corridor between Lucknow and Kolkata by lowering emissions, yet it may reduce road-dependent jobs and income in intermediate districts. Such region-specific insights are crucial for policymakers who must consider how localized social benefits (e.g. job creation along trucking routes) compare to system-wide environmental and health gains.
Beyond this specific case scenario, the model outcomes have broader implications. Each scenario involves trade-offs: shifting away from road might lower accidents but also diminish local employment opportunities. Policymakers must consider how to balance these conflicting objectives. If emission reduction is the top priority, emphasizing rail and water corridors is logical, potentially offsetting fewer jobs with skill development programs in waterway management and railway logistics. In more general terms, these results underscore the importance of multi-criteria decision-making in public distribution systems worldwide. Policymakers, researchers, and practitioners can adopt similar methodologies to evaluate the economic, environmental, and social dimensions of logistics planning in diverse geographical contexts. By applying context-relevant data on demand centers, infrastructure availability, and emission profiles, a similar framework can guide evidence-based investments in transportation and storage infrastructure, ultimately leading to more resilient and sustainable supply chains. Overall, this study demonstrates that expanding the mode mix, particularly by leveraging underutilized capacities such as railways and inland waterways, can help strike a balance among cost savings, emissions reduction, and social objectives. Future work could explore how finer capacity constraints, seasonal demand variations, or dynamic pricing policies might alter the relative attractiveness of different modes, further enriching both case-specific and generalizable insights for policymakers and supply chain stakeholders.
6. Research and policy implications
By applying this integrated approach, government agencies responsible for the PDS can adopt a more holistic planning stance. Long-term infrastructural projects, like expanding inland waterways or strengthening dedicated freight corridors, can be evaluated not just for their immediate cost implications but also for their contributions to national sustainability goals and community resilience. As India strives to balance fiscal prudence with environmental stewardship and equitable socio-economic development, this methodology offers a valuable decision-support tool. Local and regional authorities may use these insights to negotiate better terms with transport service providers, justify capital expenditures on multi-modal terminals, or design incentive structures that encourage more environmentally benign transportation. Additionally, international donors and development agencies engaged in food security initiatives can reference the framework to assess the broader impacts of their interventions. While the proposed model and methodology are conceptually robust, certain simplifying assumptions warrant further refinement. This study focuses on a single link in the PDS chain—transportation from base to field silos—leaving out upstream or downstream segments. Commodity quality, lead time variability, dynamic demand, and perishability factors were not incorporated in the current formulation. Moreover, real-world implementations might face data quality challenges, necessitating careful parameter estimation and continual model updates as new information emerges.
Several extensions would deepen the model’s applicability and insights. Upstream nodes (farmers, collection centers) and downstream nodes (regional silos, fair price shops) can be incorporated for end-to-end optimization. Considering multiple grain types could reveal interactions between commodity characteristics and transport mode selection. Uncertainty in supply volumes, seasonal demand fluctuations, and volatile fuel prices can be introduced. Dynamic models could re-optimize periodically, capturing the temporal dimension of infrastructure utilization and offering robust solutions under uncertain conditions. The environmental dimension can be extended to include spoilage, waste, and energy consumption in storage operations. Minimizing losses could complement cost, emission, and social objectives, offering a more comprehensive measure of sustainability. Embed mechanisms like carbon pricing, subsidies for certain modes, or mandated safety standards can be utilized in the optimization framework. This would allow the model to simulate different policy levers and observe their direct impact on modal allocation and TBL performance. Operational research models can be combined with behavioral insights from agricultural economics and regional planning. This would enhance the model’s realism, capturing farmers’ responses, social acceptance of transport corridors, and community-level feedback loops.
7. Conclusion
This paper presents a structured decision framework tailored for a critical segment of India’s PDS-the transportation of staple food grains from base silos to field silos. By integrating cost-minimization with subsequent environmental and social performance assessments, this study offers a method that embraces the triple-bottom-line imperatives of sustainability and social equity. Unlike approaches that simultaneously embed all modes and criteria into a single mathematical problem, this research adopts a scenario-based methodology. Each feasible network configuration was defined by which transportation modes were allowed and was independently optimized for cost, generating distinct solutions. These solutions were then rigorously evaluated on environmental emissions and social impact metrics, including employment generation and community disruption. The result is a transparent comparative analysis that enables policymakers to directly observe how introducing or removing a transportation mode affects overall system performance. Normalization and weighted aggregation have been utilized to reconcile diverse metrics measured in incompatible units and scales. This technique transforms raw data into dimensionless, comparable indices. By adjusting weights assigned to economic, environmental, and social dimensions, stakeholders can tailor the final composite decision score to reflect evolving strategic priorities, such as reducing carbon footprints or enhancing community welfare. The illustrative case study analyses the flexibility and relevance of this framework. Compared to a road-only baseline, introducing rail and water modes could unlock substantial cost savings, emission reductions, and social benefits. At the same time, recognizing that shifting modal mixes might reduce local employment or require infrastructural investments guides policymakers toward complementary strategies such as workforce retraining programs or phased infrastructure rollouts.
This paper forms part of a special section “Decarbonizing Logistics and Supply Chains: Sustainable Innovation for Global Impact”, guest edited by Srikanta Routroy, Prasanta Sahu and Prem Chhetri.


