


This study aims to investigate the economic diffusion effects of high-speed rail (HSR) development in China's Yangtze River Delta (YRD).
The study uses a time-varying difference-in-differences (DID) model and night-time lighting data from 2006 to 2019 for analysis.
The analysis reveals that HSR contributes to the spatial reorganisation of economic activity, fostering decentralised growth and regional integration. Contrary to expectations, large cities experienced significant reductions in light intensity, indicating an outward diffusion of economic activity, while small and medium-sized cities saw limited benefits. The findings highlight substantial spatial heterogeneity in HSR's economic impact and underscore potential trade-offs in sustainable urban mobility. While HSR can alleviate urban congestion and support balanced development, it may weaken economic agglomeration in core cities.
The study demonstrates the effectiveness of using nighttime lighting as a proxy for urban economic activity and underscores the need for integrated transportation, land use and regional development policies. This research provides actionable insights for policymakers seeking to leverage HSR for inclusive, sustainable urban and regional development.
1. Introduction
A strong link exists between the development of transport infrastructure and economic growth (Li et al., 2023a, b). Sound transport infrastructure can foster global competitiveness and economic growth by promptly supporting manufacturing and production activities in an economy (Zhang and Cheng, 2023). Countries have continued to accelerate the development of transport infrastructure to stimulate rapid economic growth. Transport infrastructure supports business development, lowers product prices, provides access to global consumer markets and suppliers, and enables more cost-effective global production processes by reducing transportation costs and improving accessibility (Meersman and Nazemzadeh, 2017). For example, the rapid economic growth of Asian countries over the past 2 decades relied heavily on the construction of transport infrastructure (Nawaz and Mangla, 2021). Infrastructure investment in developed European countries, such as the United States, can effectively increase gross domestic product (GDP) levels (Del Bo and Florio, 2012). Infrastructure development influences economic growth through four key approaches, including the expansion of capital and labour productivity, cost savings, stimulation of industrial accumulation, and increased aggregate market demand (Zhang and Cheng, 2023).
High-speed rail (HSR) has significantly improved city-to-city accessibility, outperforming other modes of transport (Jiao et al., 2014; Wang et al., 2016). The HSR network, once a minor solution to regional traffic demand, has evolved into a key method of supporting and guiding the spatial structural organisation of towns and cities in the region. It enhances the efficiency of industrial clusters and land use, fostering functional complementarities and economic and spatial associations between various areas (Cai et al., 2023). This efficiency in spatial structural organisation positions HSR as one of the most promising advancements in ground transportation (Li et al., 2024).
Enhancements to transportation systems can facilitate economic prosperity by increasing fixed asset investment and improving accessibility (Li and Zhang, 2024). The HSR network system has established key arteries to maintain tight spatial economic relationships and networking, as well as structuring, in the context of its rapid urbanisation (Cai et al., 2023). Thirty-five cities in China have launched robust urban rail transit systems, with 185 operational lines covering a total distance of 57,161.4 kilometres (Meng et al., 2020), accounting for over 70% of the worldwide network (Li and Zhang, 2024). China's government has made significant contributions to the development of advanced high-speed railway infrastructure, which has substantially increased its urbanisation rate, rising from 48.34% in 2009 to 65.22% in 2022 (Ma et al., 2023).
The Yangtze River Delta (YRD) city cluster has an ever-improving HSR network. The Hefei-Nanjing HSR (the first intercity HSR in the YRD city cluster) was officially opened in 2008. After that, YRD gradually became a network of HSR. In 2021, the HSR contributed to urban intercity railways, regional passenger lines, and the national high-speed railway trunk lines. This reflects a growing mode of transportation and a notable regional carrier. With the development of the “Eight Vertical and Eight Horizontal” pattern in the HSR network and the ongoing enhancement of its structure, fundamental changes have emerged from socioeconomic development and from changes in the regional spatial network structure (Cai et al., 2023). The intercity and regional railway lines are considered a supplement to the key thoroughfares. The evolution of the HSR network significantly influences regional development trends, fostering awareness of the infrastructure's substantial impact and the potential for balanced regional development (Cai et al., 2023). An important objective of considerable HSR investments is to minimise the urban-rural gap, which refers to the disparities in economic development, public services, and infrastructure between urban and rural areas, and foster coordinated regional balanced development. This generates progress toward national sustainable development (Li and Zhang, 2024).
The HSR network is a key driver of rapid socioeconomic development, thereby increasing transportation demand. This has significant effects on the transition of regional population mobility and spatial structural patterns, as well as the country's economic growth (Cai et al., 2023). Previous research has primarily focused on analysing the spatial location influences of specific HSR stations on land-use change, urban spatial expansion, economic coordination, spatial accessibility, and co-opetition with other transportation modes (Jiang et al., 2010; Wang et al., 2016; Zhong et al., 2015). Some studies have identified a strong correlation between transportation facilities and economic development in the YRD region. However, there is a noticeable lack of research evaluating the overall HSR network, underscoring the need for further study.
While substantial research has examined the economic impacts of HSR, most existing studies focus on whether HSR promotes aggregate economic growth, productivity, or accessibility improvement in connected cities. Relatively less attention has been paid to whether HSR alters the spatial distribution of economic activity within a major urban region, particularly by encouraging diffusion from large metropolitan centres to surrounding cities. In addition, many studies rely primarily on GDP or related macroeconomic indicators, which are useful for measuring aggregate growth but are less capable of identifying spatial redistribution effects. To address these gaps, this study combines nighttime light data with a time-varying difference-in-differences framework to examine how HSR expansion reshapes regional economic patterns in the YRD (Tang et al., 2024). The contribution of this study, therefore, lies not only in estimating the economic effect of HSR but also in identifying whether HSR promotes concentration or diffusion of economic activity across cities under conditions of rapid regional integration.
From a theoretical perspective, this study draws on New Economic Geography (NEG), particularly core–periphery and transport-cost models (Krugman, 1992; Fujita et al., 2001). NEG suggests that reductions in transport costs may initially strengthen agglomeration in major cities but can also trigger spatial dispersion once congestion, land prices, and labour costs offset the benefits of agglomeration. HSR reduces intercity travel time and effective economic distance, potentially facilitating the decentralisation of economic activities from core metropolitan centres to surrounding cities. By empirically testing whether HSR produces concentration or diffusion effects in the YRD, this study contributes to understanding how transport infrastructure reshapes regional economic geography.
This paper is structured as follows. Section 1 presents the research background and objective. Section 2 provides a literature review, and Section 3 presents the research methodology. The data used in the study are presented in Section 4. The results are presented in Section 5. The discussion and conclusion are addressed in Sections 6 and 7.
2. Literature review
Transportation infrastructure is pivotal in stimulating economic growth by improving accessibility and reducing transaction costs, fostering regional productivity. HSR systems have demonstrated substantial impacts on regional economies in countries such as Spain, Japan, and Germany (Heuermann and Schmieder, 2019; Monzon et al., 2021; Miwa et al., 2022). In these cases, HSR has stimulated productivity by enhancing intercity connectivity and enabling greater access to labour markets, business hubs, and consumer bases (Zhang et al., 2019; Zheng et al., 2022). HSR systems also face potential challenges and limitations in stimulating economic growth, including reducing travel times, increasing productivity, and easing regional economic disparities (Clever and Hansen, 2008; Guirao et al., 2018).
HSR expansion is a crucial part of national strategies for promoting balanced regional development, particularly in densely populated clusters such as the YRD (An et al., 2022). While the benefits of HSR in developed nations are well-documented, some studies have examined the unique economic diffusion effects in China's rapidly urbanising regions (Zhou and Zhang, 2021). This research seeks to address that gap and specifically analyses how HSR fosters the spatial reorganisation of economic activity in the YRD.
With the worldwide development of HSR, the relationship between HSR and regional economic growth has attracted greater attention. Chen and E Silva (2014) studied the impact of the high-speed rail network on provincial economies and employment in Spain between 1990 and 2010, showing that investment in high-speed rail stimulated provincial gross regional product and increased employment levels. Wetwitoo and Kato (2017) studied the impact of the opening of HSR on the economy of prefectural cities in Japan during 1981–2006 and found that the opening of HSR increased regional economic productivity, with the most significant impact on HSR prefectures located approximately 150–200 KM from major cities such as Tokyo and Osaka, which allowed for a substantial alleviation of regional inequalities in economic productivity in Japan. By contrast, the introduction of HSR between the German cities of Cologne and Frankfurt would have a positive economic impact, bringing a causal effect of 8.5% economic growth on average to cities with HSR stations and spilling over to surrounding areas through knowledge diffusion, lower transaction costs, and labour market pooling, a process where the HSR facilitates the movement of workers to areas with labour shortages, thereby reducing regional disparities in employment (Ahlfeldt and Feddersen, 2018).
There was spatial heterogeneity in the economic effects of HSR across large, medium, and small cities, with HSR opening having an adverse spillover effect on large cities but an insignificant impact on the economic growth of small and medium-sized cities (Wang et al., 2020). With the operation of HSR, lower intercity transport costs can shift industrial and overall economic activity from surrounding counties to urban centres, potentially driving significant economic growth in these areas. This shift could result in substantial declines in GDP and GDP per capita in non-central regional cities along the railway line (Qin, 2017). At the same time, HSR will strengthen the siphoning effect between regions and enhance the agglomeration capacity of central cities, as evidenced by the fact that the opening of HSR significantly reduced the economic growth rate of prefecture-level cities along the way, and the closer the cities were to the urban centre, the greater the inhibiting effect of HSR.
Nighttime lighting data has emerged as an innovative proxy for measuring economic development, particularly in regions where traditional economic statistics may be limited or unavailable (Beyer and Rama, 2018). Unlike static economic indicators such as GDP or employment rates, nighttime light intensity provides a dynamic, real-time measure of urban activity and infrastructure development (Liu et al., 2022). The strong correlation between increased nighttime light intensity and higher economic growth levels instils confidence in the reliability of this data. Nighttime light data capture can capture economic activities and small-scale production (Han et al., 2022; Mellander et al., 2015).
Nighttime lighting data provide a practical, spatially disaggregated perspective on economic growth, enabling researchers to observe changes in economic activity across cities and regions over time (Cheng et al., 2019). This practicality is valuable for analysing the impact of HSR, as the spread of economic benefits from core cities to peripheral areas may manifest in increased light intensity as economic activity decentralises (Li et al., 2023a, b). Furthermore, nighttime lighting can detect subtle changes in economic patterns that traditional indicators might overlook, making it a valuable and reassuring tool for examining HSR's spatial economic effects (Rodegerdts et al., 2004).
Compared with conventional indicators such as gross domestic product (GDP), nighttime light data offer several advantages for evaluating the economic effects of transport infrastructure. First, nighttime lights provide a spatially continuous measure of economic activity, allowing observation not only of whether economic output changes, but also where such changes occur. This feature is particularly important in the context of HSR, whose effects may manifest as spatial redistribution rather than simple aggregate growth. Second, nighttime light data are available in a temporally consistent manner across cities and years, which improves comparability in longitudinal analyses of staggered infrastructure expansion. Third, unlike annual GDP statistics, which are often reported only at an aggregate administrative level, nighttime lights are better suited to capturing changes in the intensity and distribution of urban economic activity, especially in rapidly urbanising regions. Therefore, the use of nighttime light data in this study is not merely a substitute for GDP, but a methodological choice that is better suited to identifying whether HSR development promotes the concentration or diffusion of economic activity across the YRD.
3. Methodology
This paper employs a time-varying DID model to examine the impact of HSR openings on the economies of cities in the YRD. Cities that have opened an HSR are assigned to the treatment group, and those that have not are assigned to the control group. A general regression model of time-varying DID is presented as:
Where i is a city i, and t is a time (from 2006 to 2019). Yit stands for the economic development level of city i at time t. α0 refers to a constant term. DIDit is the dummy variable obtained by multiplying the dummy variable for the grouping of HSR opening and the dummy variable for HSR opening time (Treati × Periodit). Treati is a dummy variable for the opening of the HSR (treatment group = 1, control group = 0). Periodit equals 1 if city i is open to HSR at time t. Otherwise, it is 0. β represents the coefficient of the interaction term, indicating the impact of HSR opening on the city's economy. Positive β indicates the extent to which the opening of HSR promotes the economic level of the city. Negative β indicates the extent to which the opening of HSR depresses the city's economic level. xij is a control variable. λi is the individual fixed effects. ut time-fixed effects and εit is the random perturbation term.
The DID model is utilised under the stringent assumption of an equilibrium trend. This condition requires that the treatment and control groups maintain a consistent trend of change before the HSR opens. It means that the treatment and control groups must have the same trend in nighttime light intensity before the HSR's inauguration. If this precondition is not met, the resulting policy effect may not accurately reflect the actual effect, due to inherent differences between the groups. In the time-varying DID model, the event study method is used to conduct an equilibrium trend test. The method plays a crucial role in this process, given the different timing of high-speed rail openings in various cities. The model is structured as follows.
Where M and N are the number of periods before and after policy implementation, respectively. Policyi,t−j is a dummy variable; if city i opens the high-speed rail in period t−j, then Policyi,t−j = 1. Otherwise, it is 0. βj measures the effect of high-speed rail policy in period j. If βj before the opening of the high-speed rail is not significantly different from 0, it means that it satisfies the equilibrium trend test.
Recent econometric studies note that conventional two-way fixed-effects DID estimators may produce biased estimates when treatment adoption is staggered and treatment effects vary across cohorts or over time (Goodman-Bacon, 2021; Sun and Abraham, 2021). However, in this study, several robustness checks, including event-study analysis, PSM-DID estimation, placebo tests, and alternative specifications, produce consistent results, suggesting that the main conclusions are not driven by such biases.
4. Data
Nighttime light intensity is employed in this study as a proxy for urban economic activity because it is sensitive to both the scale and the spatial distribution of development. This makes it particularly useful for analysing the potential diffusion effects of HSR, which may manifest not only through aggregate economic growth but also through the redistribution of activity across cities. At the same time, nighttime lights should be understood as an informative but imperfect indicator, since luminosity may also be affected by factors such as energy efficiency, industrial composition, and urban lighting practices. For this reason, the results are interpreted in conjunction with the broader empirical pattern and robustness tests.
This paper utilises nighttime lighting data to measure cities' economic development levels, providing a more comprehensive view of economic activity across temporal and geographical scales than traditional economic data (Henderson et al., 2012). Several scholars have extensively explored the relationship between nighttime light imagery and GDP, and some studies have found a significant positive correlation between nighttime light data and regional GDP (Henderson et al., 2012; Huang et al., 2022). Nighttime lighting data, with its broad applicability, is often used in studies of various socioeconomic data, underscoring its relevance in economic research. The data consists of the DMSP-OLS Nighttime Light Time Series (1992–2013) dataset from the National Oceanic and Atmospheric Administration (NOAA) and the NPP/VIIRS Night Light Remote Sensing data (Day/Night Band) cloud-free monthly synthetic dataset from Colorado School of Mines. Data continuity correction was performed using the method proposed by Huang et al. (2014) and Li et al. (2023a, b), yielding stable nighttime lighting data from 2006 to 2019.
In the data processing, the ARCGIS software was used to preprocess DMSP/OLS and NPP/VIIRS night-light images. All geographic coordinate systems for the night light images are based on the GCS_Krasovsky_1940. The image projection coordinate systems were converted to the Albers equal-area projection, and the image grids were resampled to 1 km2. All images were extracted by an administrative boundary mask and resampled. The DN values of nighttime light data from the same year, acquired by different DMSP/OLS sensors, differ, necessitating preprocessing of the raw data. According to the proposed invariant target region method, the DMSP/OLS long-term nighttime lighting data series is adjusted to be consistent with one another. The city of Hegang in F162006 was selected as the invariant target region because the area has experienced relatively stable urban development over the past 21 years. The power function equation is used to establish the correction model.
Where DN and DNcal denote the pixel DN values in the image before and after correction, respectively, and a and b are the parameters in the power function regression equation. The problem of discontinuity in nighttime light images persists after mutual correction. This situation persists: different sensors have multiple image periods in the same year, and abnormal fluctuations in DN values occur in the same area in other years. Continuity correction is performed by combining DN values from multiple sensors within the same year. The continuous-time dataset of nighttime lights from 1992 to 2013 is obtained.
Where n is a year (2006, 2007, …, 2013). is the value of image element i in the nighttime light image acquired by two different sensors after mutual correction in year n. is the value of image element i in the corrected image in the year n.
The NPP/VIIRS cloud-free monthly data were combined using the mean method, a statistical technique that provides a representative value for a set of data. This method was chosen to obtain annual average nighttime light data because it effectively mitigates the effects of outliers and transient lights. The NPP/VIIRS is a cloud-free nighttime light map only, with the disadvantage that scattered lights (such as aurora borealis, fires, ships, and other transient lights) are not removed, leading to outliers. Because DMSP/OLS removes fire and moonlight clouds, it is better suited for handling outliers and utilising the corrected 2013 DMSP/OLS nighttime light images. All the 2014–2020 VIIRS nighttime light images were extracted to remove unstable light sources and background noise.
The most significant DN value in the urban area is selected as the maximum threshold for the study area, thereby removing the very high DN values of anomalous light sources in the image. To remove the influence of light reflected from ships and horizontal surfaces, we utilise rivers (lakes) of class IV or higher, as provided by the National Geographic Information Data (NGID), to eliminate the lights of rivers (lakes) from all nighttime light images, thereby minimising data error. DMSP/OLS and NPP/VIIRS are two different satellite sensors with inconsistencies, and their time series are not comparable. Last year's NPP/VIIRS nighttime light image was used as a mask to extract all the DMSP/OLS nighttime light images from 2001 to 2013. This prevents the final extracted values from being disconnected. Considering that the urbanisation level of Chinese cities has been increasing, the nighttime lighting data and the general trend of urban development patterns are similar. Therefore, it is assumed that the DN value of the previous year should not be greater than the DN value of the following year. If the DN value for the following year is 0, the DN value for the previous year should also be 0. Stable and continuous nighttime lighting data were obtained from 1992 to 2020.
Where DN(n-1,i), DN(n,i), and DN(n+1,i) are the DN values of the ith image element in years n-1, n, and n+1, respectively. n is a year (2006, 2007, …, 2019.
This study, which encompasses 41 cities in the YRD region, including Shanghai, Jiangsu, Zhejiang, and Anhui Provinces, is designed to be inclusive. Using prefectural-level cities as the basic research unit and as the criterion for a rail-opening high-speed town, based on their presence in the YRD high-speed rail network, ensures that a wide range of areas are considered. The cities listed in the YRD are those that had HSR service open from 2008 to 2019. This results in a study of 36 high-speed rail cities and five non-high-speed rail cities, a testament to the inclusivity of this research.
Economic development indicators for YRD prefecture-level cities from 2006 to 2019 were collected from the China City Statistical Yearbook and provincial statistical yearbooks, with missing data supplemented from the cities' statistical bulletins. Tables 1 and 2 show descriptive statistics for the main variables.
Variable
| Variable | Name |
|---|---|
| DN | Ln sum light intensity |
| GDP | Ln Gross Domestic Product |
| Investment | Ln investment in fixed assets |
| Secondary | Ln added the value of the secondary industry |
| Tertiary | Ln added the value of the tertiary industry |
| Transportation infrastructure | Urban Road area/population |
| Labour force | Number of employees per labour unit/GDP |
| Government expenditure | General public budget expenditure/GDP |
| Foreign direct investment | Foreign direct investment (FDI)/GDP |
| Population | Ln population |
Variable descriptive statistics
| Variable | N | Mean | SD | Min | Max |
|---|---|---|---|---|---|
| DN | 574 | 10.95 | 0.919 | 8.709 | 12.97 |
| GDP | 574 | 7.387 | 1.122 | 4.868 | 12.39 |
| Investment | 574 | 16.35 | 0.972 | 13.72 | 18.20 |
| Secondary | 574 | 6.808 | 1.059 | 3.902 | 9.246 |
| tertiary | 574 | 6.656 | 1.180 | 3.952 | 10.23 |
| Transportation infrastructure | 574 | 5.341 | 3.790 | 0.377 | 22.98 |
| Labour force | 574 | 0.0326 | 0.0199 | 0.00282 | 0.326 |
| Government expenditure | 574 | 0.172 | 0.0850 | 0.0216 | 0.461 |
| Foreign direct investment | 574 | 53.81 | 35.24 | 3.409 | 165.6 |
| Population | 574 | 6.053 | 0.616 | 4.292 | 7.292 |
5. Results
The results can be interpreted through the lens of New Economic Geography, where reductions in transport costs alter the balance between agglomeration and dispersion forces. The negative DID coefficient suggests that HSR promotes outward economic diffusion rather than reinforcing concentration in core cities.
This section presents the main empirical results in four steps. First, the baseline multi-period DID estimates are reported to assess the average effect of HSR opening on nighttime light intensity in YRD cities. Second, an instrumental-variable specification is used to address potential endogeneity in HSR placement. Third, heterogeneity analysis is conducted to examine whether the effects differ by city size. Finally, a series of robustness checks is performed to test the stability of the findings. Taken together, these results provide a more comprehensive understanding of whether HSR expansion promotes concentrated growth or spatial economic diffusion within the region.
Figure 1 illustrates the standard trend test. The dummy variable coefficient estimates for the two years preceding the HSR opening hover around zero and are not statistically significant (the 95% confidence interval includes 0). This strongly suggests that there were no significant differences between the treatment and control groups before the HSR opening, thereby validating the common trend test hypothesis.
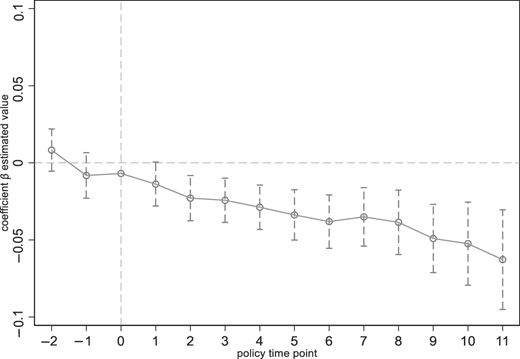
Table 3 reports the baseline multi-period DID estimates of the economic effect of HSR opening on YRD cities. In both specifications, the coefficient on the DID variable is negative and statistically significant at the 1% level. This finding indicates that, after the opening of HSR, nighttime light intensity in affected cities declines relative to that in non-HSR cities, holding city and time fixed effects constant. Rather than interpreting this result as a simple decline in economic performance, the coefficient is more appropriately understood as being consistent with a process of spatial economic diffusion or redistribution. In other words, HSR appears to facilitate the outward movement of economic activity from major urban centres toward surrounding areas, thereby reshaping the regional distribution of development.
Economic impact of HSR opening on YRD cities
| (1) | (2) | |
|---|---|---|
| Parameter | DN | DN |
| DID | −0.0198*** | −0.0168*** |
| (0.006) | (0.005) | |
| Transportation | 0.00174 | |
| (0.002) | ||
| Labour | 0.310** | |
| (0.145) | ||
| Government | 0.225*** | |
| (0.045) | ||
| FDI | 0.000583*** | |
| (0.000) | ||
| Population | 0.00909 | |
| (0.015) | ||
| _cons | 10.96*** | 10.82*** |
| (0.003) | (0.095) | |
| Fixed Effects | YES | YES |
| N | 574 | 574 |
| adj. R2 | 0.9980 | 0.9985 |
Note(s): Standard errors in parentheses *p < 0.1, **p < 0.05, ***p < 0.01
The control variables also provide useful contextual information. The positive and significant coefficient on labour suggests that a stronger labour base is associated with higher nighttime light intensity, reflecting the role of employment concentration in sustaining urban economic activity. Government expenditure and foreign direct investment are likewise positively associated with light intensity, implying that public investment capacity and external capital inflows remain important drivers of local development. By contrast, transportation infrastructure and population are not statistically significant in the fully specified model, suggesting that their effects may be absorbed by fixed effects or overlap with other structural determinants. Overall, Table 3 provides initial evidence that HSR affects not only the scale of urban economic activity but also its spatial distribution, which directly relates to the study's core objective.
At the same time, this interpretation should be treated with caution. Nighttime light intensity is an informative but imperfect proxy for economic activity, and declines in luminosity may also arise from changes in energy efficiency, urban lighting policies, technological upgrading, or industrial restructuring. Accordingly, the estimated negative coefficient should be understood as being consistent with spatial economic diffusion, rather than as direct proof of diffusion alone. In the present study, this interpretation is supported by the broader empirical evidence, especially the heterogeneity analysis, which shows that the negative effect is concentrated mainly in large cities rather than being uniformly observed across all city types.
Table 4 presents the endogeneity test results. A potential concern is that HSR lines may not be randomly located, but instead may be more likely to open in cities with favourable historical, political, or economic conditions. To address this issue, the analysis uses the historical location of post stations in the Ming dynasty as an instrumental variable (Banerjee et al., 2020; Bu et al., 2019). The first-stage results show that the instrumental variable is strongly and positively associated with HSR opening, suggesting substantial explanatory power.
Endogeneity test
| Phase I | Phase II | |
|---|---|---|
| DID | DN | |
| DID | −0.0266*** | |
| (0.007) | ||
| IV | 0.772*** | |
| (0.027) | ||
| Transportation | −0.0337*** | 0.00148 |
| (0.006) | (0.002) | |
| Labour | 0.311 | 0.309** |
| (0.702) | (0.135) | |
| Government | −0.542** | 0.216*** |
| (0.246) | (0.043) | |
| FDI | 0.000423 | 0.000592*** |
| (0.000) | (0.000) | |
| Population | 0.428*** | 0.00968 |
| (0.116) | (0.014) | |
| DID | −0.0266*** | |
| (0.007) | ||
| Fixed Effects | YES | YES |
| _cons | −2.154*** | 12.66*** |
| (0.725) | (0.106) | |
| N | 574 | 574 |
| adj. R2 | 0.8262 | 0.9985 |
Note(s): Standard errors in parentheses *p < 0.1, **p < 0.05, ***p < 0.01
The second-stage results continue to show a negative and statistically significant effect of HSR on nighttime light intensity. Importantly, the estimated coefficient remains consistent with the baseline DID result and is even slightly larger in magnitude. This pattern suggests that the negative baseline estimate is unlikely to be driven solely by endogenous HSR placement. Instead, the IV results reinforce the interpretation that HSR opening is associated with outward economic diffusion and regional spatial reorganisation. Therefore, Table 4 strengthens the credibility of the baseline findings reported in Table 3.
To examine whether the economic effects of HSR differ across the regional urban hierarchy, the sample cities are grouped into large, medium-sized, and small cities based on population size. This classification is used to test whether HSR produces heterogeneous economic effects across cities with different development scales and absorptive capacities.
Table 5 presents a heterogeneity analysis by city size and shows that the economic effects of HSR are highly uneven across the regional urban system. For large cities, the DID coefficient is negative and statistically significant, indicating that HSR opening is associated with a reduction in nighttime light intensity. This result suggests that large cities may experience spillover or diffusion effects, whereby some economic functions, labour flows, or development intensity shift outward as intercity accessibility improves. In this sense, HSR may weaken the relative concentration advantage of major metropolitan centres.
Economic impact of the opening of HSR on cities of different sizes in YRD
| Parameter | (1) | (2) | (3) |
|---|---|---|---|
| Big city | Medium-sized cities | Small cities | |
| DID | −0.0152** | 0.00157 | 0.0112 |
| (0.007) | (0.009) | (0.013) | |
| Transportation | −0.000456 | 0.00637*** | 0.00188 |
| (0.003) | (0.002) | (0.013) | |
| Labour | 1.042** | −0.613* | 0.329 |
| (0.404) | (0.348) | (0.208) | |
| Government | 0.236*** | 0.0791 | 0.296** |
| (0.076) | (0.058) | (0.114) | |
| FDI | −0.0000983 | 0.000422*** | 0.00124*** |
| (0.000) | (0.000) | (0.000) | |
| Population | 0.0806** | 0.0296 | 0.0183 |
| (0.038) | (0.033) | (0.060) | |
| _cons | 11.24*** | 10.51*** | 9.670*** |
| (0.244) | (0.204) | (0.391) | |
| Fixed Effects | YES | YES | YES |
| N | 224 | 210 | 140 |
| adj. R2 | 0.9990 | 0.9960 | 0.9884 |
Note(s): Standard errors in parentheses *p < 0.1, **p < 0.05, ***p < 0.01
By contrast, the coefficients for medium-sized and small cities are statistically insignificant. This implies that improved HSR accessibility does not automatically translate into measurable gains in nighttime light intensity for these cities. One possible explanation is that HSR alone is insufficient to sustain local growth unless it is matched by complementary factors, such as industrial capacity, labour-market adaptability, investment attraction, and supportive public policies. These heterogeneous findings are central to this study's objective because they show that HSR does not yield uniform economic benefits across all cities. Instead, its effects depend strongly on city size and local development capacity, which highlights the importance of spatial heterogeneity in infrastructure evaluation.
Table 6 reports several robustness checks, including substitution of the dependent variable, PSM-DID estimation, sample adjustment, and a placebo test. Across the first three specifications, the estimated DID coefficient remains negative and statistically significant, indicating that the main result is robust to alternative empirical treatments. In particular, the consistency of the PSM-DID result suggests that differences in observable characteristics between treated and untreated cities are unlikely to fully explain the baseline finding. Similarly, the persistence of the negative effect after changing the sample further supports the robustness of the conclusion.
Stability test
| (1) | (2) | (3) | (4) | |
|---|---|---|---|---|
| Parameter | Substitution of the dependent variable | PSM-DID | Change sample | Placebo test |
| DID | −0.0550*** | −0.0156*** | −0.0155*** | −0.00371 |
| (0.021) | (0.005) | (0.005) | (0.006) | |
| Transportation | −0.0284*** | 0.00273 | 0.000304 | 0.00163 |
| (0.009) | (0.002) | (0.002) | (0.002) | |
| Labour | −0.407 | 0.774*** | 0.339** | 0.317** |
| (0.657) | (0.201) | (0.154) | (0.148) | |
| Government | −1.663*** | 0.262*** | 0.210*** | 0.224*** |
| (0.361) | (0.059) | (0.050) | (0.045) | |
| FDI | 0.000159 | 0.000610*** | 0.000593*** | 0.000588*** |
| (0.000) | (0.000) | (0.000) | (0.000) | |
| Population | −0.0882 | 0.0119 | −0.00164 | 0.100** |
| (0.060) | (0.017) | (0.015) | (0.046) | |
| _cons | 8.387*** | 10.74*** | 10.75*** | 10.81*** |
| (0.439) | (0.108) | (0.096) | (0.030) | |
| Fixed Effects | YES | YES | YES | YES |
| N | 574 | 522 | 518 | 574 |
| adj. R2 | 0.9832 | 0.9983 | 0.9981 | 0.9985 |
Note(s): Standard errors in parentheses *p < 0.1, **p < 0.05, ***p < 0.01
The placebo test provides additional reassurance. In this specification, the DID coefficient becomes statistically insignificant, indicating that the estimated treatment effect does not arise mechanically from the model structure or random assignment. Taken together, these checks confirm that the main result is not driven by a particular variable definition, sample composition, or spurious statistical correlation. Therefore, Table 6 provides strong support for the reliability of the conclusion that HSR expansion is associated with spatial economic diffusion in the YRD.
Overall, the results reported in Tables 3–6 present a consistent empirical pattern. The baseline estimates suggest that HSR opening is associated with a decline in nighttime light intensity, the endogeneity analysis confirms that this result is not merely an artefact of non-random HSR placement, the heterogeneity analysis shows that the effect is concentrated mainly in large cities, and the robustness checks demonstrate that the finding is stable across alternative specifications. Taken together, these results support the view that HSR expansion in the YRD contributes more to the spatial redistribution of economic activity than to a uniform increase in economic intensity across all connected cities.
6. Discussion
This study offers a nuanced perspective on the broader implications of HSR development within China's YRD, particularly regarding its impact on spatial economic diffusion and sustainable regional development. The empirical evidence, derived from nighttime lighting data and a time-varying DID framework, reveals significant spatial and structural transformations in urban economic activity linked to the opening of HSR lines. The research findings have significant implications for sustainable urban planning.
6.1 Economic diffusion and urban decentralisation
The most prominent finding is the statistically significant decline in nighttime light intensity in cities following the opening of HSR lines. Contrary to the expectation that improved infrastructure would concentrate economic activity in urban centres, the results suggest a decentralising effect, where economic activity disperses outward from large cities. This shift could potentially lead to a more balanced distribution of economic activity, reducing overconcentration in metropolitan hubs and fostering development in peripheral regions.
This pattern is consistent with predictions from the NEG, in which reduced transport costs can shift the balance from agglomeration toward spatial dispersion once congestion and land costs erode core-city advantages.
6.2 Spatial heterogeneity of HSR impact
The heterogeneity analysis highlights a critical divergence in HSR's effects by city size. Large cities experience adverse spillover effects after HSR implementation, as indicated by significant reductions in light intensity, suggesting outward economic diffusion. This may reflect the redistribution of labour, capital, and business activity toward surrounding lower-tier cities or suburban areas, potentially weakening the urban core's growth trajectory.
Conversely, small and medium-sized cities showed no statistically significant effect, suggesting that HSR alone may be insufficient to stimulate economic growth in these areas. This underscores the urgent need for complementary policies and supportive infrastructure to fully realise the potential benefits of HSR. This outcome points to the “Matthew Effect” in regional development, where regions already possessing economic and institutional capital are more likely to benefit from infrastructure investments.
This uneven impact challenges the assumption that HSR is a uniformly beneficial development tool, underscoring the need for targeted policy interventions to address these disparities. In particular, medium-sized cities could be better positioned to absorb economic activity diffused from large cities, but only if supported by adequate industrial bases, urban amenities, and most importantly, robust and adaptable labour markets. The success of these cities is intricately linked to the success of these factors.
6.3 Trade-offs in sustainable urban mobility
While the diffusion of economic activity can reduce environmental pressures and urban congestion in large cities, it also poses trade-offs for sustainable development. The weakening of central urban agglomerations could compromise economies of scale, innovation clustering, and efficient public service provision. On the other hand, a more polycentric regional structure could enhance urban resilience, reduce vulnerability to shocks, and support more balanced regional development.
The study aligns with sustainable mobility principles by demonstrating how HSR can redistribute economic activities, potentially reducing reliance on private vehicle travel and short-haul flights. However, if this decentralisation is not carefully managed, it may lead to urban sprawl, car dependency in peripheral areas, and increased emissions, thereby undermining sustainability goals. This emphasises the urgency of the issue and the need for careful planning and management.
6.4 Institutional and policy implications
The pivotal role of government expenditure and foreign direct investment (FDI) in shaping the observed economic changes underscores a crucial point: infrastructure development alone does not ensure inclusive growth. Our regression models reveal a significant positive correlation between government spending, FDI, and economic activity. This underscores the weight of our responsibilities as policymakers, highlighting the essential role of institutional capacity and capital inflows in moderating the impacts of infrastructure development.
To fully leverage HSR's potential for regional sustainability, policymakers must adopt integrated planning frameworks. These frameworks, which link transportation infrastructure to economic zoning, land-use regulation, and environmental protection, are crucial. By amplifying the benefits of HSR through strategies like “station area development” and the creation of intermodal transport nodes, we can make significant strides. However, coordinated urban-rural strategies are particularly urgent, as they can help address the pressing issue of regional disparities.
6.5 Methodological insights
The use of nighttime lighting data introduces a novel and dynamic lens for examining spatial economic patterns. This approach captures informal, undocumented, or rapidly evolving economic activities that are often overlooked by traditional indicators, such as GDP. The time-varying DID framework, combined with robustness and placebo tests, strengthens causal interpretation in the context of staggered HSR implementation. Although recent advances in DID methodology propose alternative estimators for staggered policy adoption, the consistency of results across robustness tests in this study suggests that potential biases associated with two-way fixed effects estimators are unlikely to overturn the main findings.
Moreover, the instrumental variable approach, a statistical technique that uses an instrumental variable to estimate causal relationships, lends historical depth and statistical rigour by using Ming dynasty post stations to control for endogenous factors that might otherwise bias the interpretation of HSR effects.
These findings also hold implications for sustainable energy use and urban resilience. The decentralisation of economic activity implies shifting energy demands, potentially reducing urban energy consumption in favour of a more distributed model. By pairing HSR development with energy-efficient and resilient urban planning, such as the use of renewable energy sources and the implementation of green infrastructure, policymakers can better manage these shifts in resource demand, thereby reinforcing the role of HSR in reducing reliance on car travel and short-haul flights, and ultimately lowering regional carbon emissions. This holistic approach to sustainable urban mobility can help build a more resilient, balanced urban network.
Policymakers should integrate sustainable transportation and urban planning strategies that align with HSR's decentralising effect, promoting inclusive regional growth without undermining the economic vitality of large cities. Strategies that balance HSR's benefits with sustainable development goals are essential to achieving a resilient urban network. Future research should delve deeper into the mechanisms of HSR's impact on urban form and economic dynamics, incorporating factors such as station density and service frequency to refine our understanding of HSR's role in fostering sustainable, balanced regional development. The reliability of these findings is reinforced by robustness checks, including PSM and placebo tests, which confirm that these conclusions hold across different model specifications and assumptions. The potential selection bias has been effectively addressed, ensuring that the observed effects are attributable to the HSR network rather than to other external factors. This should instil confidence in HSR's potential for sustainable urban development.
7. Conclusion
This study provides empirical evidence on the spatial economic effects of HSR expansion in China's YRD, utilising a time-varying DID approach and nighttime lighting data as a proxy for urban economic activity. The findings suggest that while HSR development promotes regional integration and enhances sustainable urban mobility, it also induces economic diffusion from large cities, potentially diminishing the concentration of economic activity in key metropolitan areas.
The results demonstrate significant spatial heterogeneity: large cities experience adverse spillover effects following HSR implementation, whereas small and medium-sized cities benefit to a lesser extent. These outcomes highlight the dual nature of HSR infrastructure, which enables decentralised growth and relieves congestion in urban cores but may also challenge the sustained economic dominance of central cities. Moreover, the robustness of the findings, validated through endogeneity testing, heterogeneity analysis, and multiple robustness checks (e.g. PSM-DID and placebo tests), enhances the credibility and generalisability of the study's conclusions.
This study also contributes methodologically by showing the value of nighttime light data for evaluating the spatial economic effects of major transport infrastructure. Much of the existing literature assesses HSR impacts using GDP, employment, or productivity indicators, which are appropriate for measuring aggregate outcomes but less informative about spatial redistribution within a region. By contrast, nighttime lights provide a spatially sensitive proxy that helps reveal whether economic activity becomes more concentrated or more dispersed after HSR expansion. In the present study, this feature is particularly important because the central question is not simply whether HSR increases economic activity, but whether it reorganises economic activity across the YRD in a more decentralised pattern.
From a policy perspective, the implications are twofold. First, transportation planning must be harmonised with regional economic policies to ensure that the benefits of HSR are equitably distributed. Second, strategic investment in complementary infrastructure and services, especially in small and medium-sized cities, is necessary to mitigate the uneven benefits and prevent the deepening of spatial economic inequalities.
Despite its contributions, the study has limitations. The use of nighttime lighting as a proxy, while innovative, may overlook nuanced economic dynamics such as sector-specific growth or informal economic activity. Additionally, the model does not account for variations in HSR service frequency, station accessibility, or other operational factors that may influence local economic outcomes. The study is also limited to the YRD and may not be fully generalisable to other regions with differing urban structures or transport policies.
Future research should expand its geographic scope to include other regions in China and globally, enabling cross-comparative analysis. Furthermore, incorporating more granular data on industrial structure, land-use changes, and intra-city connectivity could enhance understanding of HSR's broader socioeconomic impacts. Longitudinal studies examining the long-term implications of HSR for urban form, migration patterns, and energy consumption would also provide valuable insights for sustainable infrastructure planning.

