This study introduces an explainable federated learning (XFL) framework for fault diagnosis in multi-agent autonomous systems, such as UAVs and self-driving vehicles. It addresses limitations of centralized approaches, including scalability issues, communication delays, data privacy concerns and lack of transparency in safety-critical environments. By enabling collaborative model training without central data pooling, the framework ensures real-time fault detection, interpretability, and regulatory compliance, contributing to safer operations in intelligent mobility, drone logistics, and urban robotics.
The framework employs Federated Averaging (FedAvg) for distributed learning across autonomous agents, with local models featuring a lightweight neural network including attention mechanisms and softmax output. SHAP (Shapley Additive Explanations) is integrated for local interpretability, with aggregated global profiles for feature relevance. Simulations mimic multi-agent environments with non-IID data, injecting faults such as sensor drift, dropout and adversarial perturbations. Evaluation uses metrics such as accuracy, convergence speed and explanation fidelity, benchmarked against FedAvg, centralized and local-only methods on edge hardware such as Jetson Nano.
The XFL framework achieved 92.6% classification accuracy after 20 rounds, outperforming FedAvg (88.7%) and centralized baselines (86.9%), with faster convergence (12 vs. 18 rounds). It demonstrated robustness, retaining 89.4% accuracy under faults such as Gaussian drift and FGSM perturbations. SHAP explanations showed consistent feature importance (e.g. gyroscope delta and latency spike) with Jaccard indices averaging 0.705 across clients. Real-time inference latency was under 60 ms on edge devices, validating practicality for deployment. Ablation studies confirmed contributions from SHAP reweighting and attention layers.
This work pioneers the integration of explainable AI (SHAP) into federated learning for fault diagnosis in multi-agent autonomous systems, bridging gaps in privacy-preserving, interpretable and robust safety solutions. Unlike prior studies focused on accuracy alone, it embeds transparency during training, enabling traceable decisions for regulatory compliance and public trust. The framework's entropy-based reweighting enhances convergence and resilience, offering scalable value for safety-critical applications such as UAV swarms and vehicle platoons, advancing intelligent manufacturing and special equipment reliability.
1. Introduction
Over the last decade, autonomous systems have steadily moved from experimental prototypes to real-world deployment across a range of domains. From unmanned aerial vehicles (UAVs) monitoring infrastructure to self-driving cars navigating public roads, autonomous technologies are becoming foundational to future transportation, logistics, and surveillance systems. As this transformation unfolds, ensuring these systems operate safely, especially in complex or high-risk environments, has become a critical priority. Autonomy offers clear benefits—enhanced efficiency, reduced human workload, and the ability to function in hazardous or remote areas. Yet, these systems also introduce new risks. How can faults in sensors, software, or communication be detected without compromising safety? Autonomous agents rely on onboard sensors, algorithms, and limited links for independent decisions. Faults can lead to cascading failures in multi-agent systems, eroding public trust. Traditionally, centralized architectures collect data for analysis, but they create bottlenecks in communication, bandwidth, and privacy. Moreover, they often lack transparency, raising questions: Why was a fault flagged, and how can decisions be justified? To address these, federated learning (FL) allows agents to train locally and share model updates, preserving privacy and scalability. However, FL often prioritizes accuracy over insight. Explainable AI (XAI), using tools like SHAP and LIME, provides interpretability, but integrating it with FL in autonomous systems is challenging. How can we balance performance, interpretability, and decentralization? This paper proposes an XFL framework for fault diagnosis, enabling agents to monitor states, learn collaboratively, and produce interpretable outputs. Designed for limited-communication environments like vehicle platoons or drone swarms, it embeds explanations for regulatory compliance. Motivated by regulations from bodies like NHTSA and FAA emphasizing AI transparency, our solution also enhances robustness to malfunctions or attacks. We validate via simulations of faults in cooperative systems, assessing accuracy, explanations, and adaptation. The framework unifies accuracy, transparency, privacy, and scalability, contributing to safe autonomy.
2. Literature review
Federated Learning in Autonomous Systems
The concept of federated learning has gained prominence in recent years as a solution for collaborative model development in environments where data privacy and decentralization are paramount. Initially introduced in mobile computing for applications like keyboard prediction, FL has since expanded into domains involving edge intelligence, including autonomous systems where agents such as drones and driverless vehicles operate independently but require shared learning capabilities (Brendan McMahan et al., 2017).
In autonomous settings, FL enables each agent to train a local model using its sensor and environmental data, while periodically sharing only model parameters with a central aggregator. This setup preserves privacy, reduces bandwidth usage, and eliminates the need for centralized data storage. For example, studies in vehicular networks have demonstrated FL's utility in improving traffic prediction and decision-making among autonomous cars without compromising data ownership (Goodfellow et al., 2015). Similarly, in aerial robotics, FL has been employed to facilitate swarm learning for navigation or object detection, showing promising results in decentralized mission environments (Li et al., 2020).
Nevertheless, implementing FL in real-world autonomous systems is not without its hurdles. A major concern arises from non-IID (non-identically distributed) data, as different agents may encounter diverse operational scenarios and sensor conditions. This uneven data distribution often leads to model drift and poor convergence (Jiang et al., 2020). Proposed remedies include grouping clients by behavior patterns, assigning local learning rates, or using adaptive model aggregation schemes—but these approaches are still under study, particularly in time-sensitive and safety-critical settings.
Fault Diagnosis in Distributed Autonomous Networks
Detecting faults in autonomous systems has long been a subject of research across robotics, control systems, and artificial intelligence. Traditional model-based fault diagnosis methods use mathematical models that mirror the physical system, comparing expected behavior with actual measurements to identify inconsistencies (Zhang et al., 2019). Although theoretically sound, such approaches often fall short in dynamic or unstructured environments where modeling accuracy is difficult to maintain.
To overcome these limitations, data-driven fault detection techniques have become popular. These rely on historical and real-time sensor data to detect anomalies using statistical or machine learning models. In particular, deep learning has proven effective in recognizing complex fault signatures in both mechanical and cyber-physical systems (Shafiq et al., 2020). However, most of these systems are centralized and require large annotated datasets, which are seldom available in fast-changing or privacy-sensitive autonomous environments.
In multi-agent setups, faults can propagate through inter-agent interactions, complicating root-cause identification. Distributed monitoring frameworks, where each agent is partially responsible for its own and nearby agents' diagnostics, have been introduced to cope with this complexity (Ibrahim et al., 2022). Still, these systems often depend on consistent communication and global synchronization, which cannot be assumed in all deployment contexts.
While some efforts have been made to bring FL into fault detection, these remain largely experimental. For example, federated diagnostic systems have been trialed in smart factory environments and critical infrastructure monitoring (Chen et al., 2022a), but their use in mobile, safety-critical autonomous systems—where decisions must be both rapid and reliable—remains limited.
Explainable AI in Safety-Critical Applications
The concept of explainability in AI has become central to discussions around ethical, reliable, and human-centric machine learning systems. In safety-critical environments such as finance, medicine, and defense, it is no longer sufficient for models to be accurate—they must also be understandable and auditable. Techniques like SHAP (Shapley Additive Explanations) and LIME (Local Interpretable Model-Agnostic Explanations) have emerged to help users understand which inputs influence a model's prediction and how (Lundberg and Lee, 2017).
Explainability tools have proven especially valuable in domains where decisions must be justified to stakeholders. In medical imaging, for instance, these tools help clinicians interpret AI diagnoses by highlighting influential features in scans (Tjoa and Guan, 2021). In finance, regulators require traceable decision logic for fraud detection systems. However, within autonomous systems, the use of XAI has been relatively narrow—typically limited to research prototypes or post-hoc analyses rather than being embedded into real-time, operational models (Doshi-Velez and Kim, 2017).
Moreover, integrating XAI into federated architectures adds a layer of complexity. Since model training and evaluation are distributed across nodes, generating consistent explanations without access to raw data or centralized control is challenging. Some preliminary research has attempted to incorporate explanation layers into the FL training cycle (Hu et al., 2020), but these models are often tested in static, well-controlled datasets rather than in real-world autonomous scenarios.
Unified Approaches: Present Gaps and Emerging Challenges
Efforts to integrate FL, XAI, and fault detection into a single framework are still in early development. In some health monitoring systems, researchers have attempted to create federated learning models that include built-in explainability features to aid in decision validation (Chen et al., 2022b). While these approaches show potential, applying them to mobile autonomous systems introduces additional layers of difficulty—namely the need for real-time operation, communication uncertainty, and varying fault profiles across agents.
Another limitation in current research is the predominant use of post hoc interpretability, where explanations are generated only after a model is trained and deployed. This method limits the model's transparency during training and can obscure critical behaviors, especially in autonomous systems where understanding the evolution of decisions is essential (Simonyan et al., 2013).
At present, few solutions combine federated learning and explainable AI in a way that also addresses the unique demands of fault detection in dynamic, multi-agent environments. Even fewer studies explore these ideas under conditions that reflect actual deployment, such as sensor failure, adversarial attacks, and intermittent connectivity. As a result, there is a distinct gap in the literature where privacy-aware, interpretable, and distributed fault diagnosis systems for autonomous agents are both needed and lacking.
The work presented in this paper is designed to help bridge that gap. By embedding explainability directly into a federated fault detection framework tailored for autonomous systems, it offers a practical and forward-looking approach that emphasizes not just performance, but also transparency, adaptability, and scalability in safety-critical deployments.
3. Methodology
This section outlines the theoretical framework, algorithmic design, and mathematical modeling of the proposed XFL system for fault diagnosis in multi-agent autonomous systems. We begin by formulating the problem, followed by descriptions of the federated learning process, model architecture, incorporation of explainability via SHAP, and fault injection protocol for evaluation. A formal convergence analysis and interpretability layer integration are also provided.
Problem Definition
Consider a distributed system composed of autonomous agents, each equipped with onboard sensors and computational resources. These agents operate independently in diverse environments and are tasked with identifying and classifying operational faults in real time. Each agent collects local data , where is the feature vector representing sensor readings, and is the corresponding fault label across classes.
The objective is to collaboratively train a global classifier such that it minimizes the average empirical risk across all agents without requiring direct access to their local datasets:
Here, ℓ is a loss function (e.g.cross-entropy), and .
Federated Learning Framework
The federated learning protocol follows the Federated Averaging (FedAvg) paradigm (Brendan McMahan et al., 2017). Each round involves the following steps:
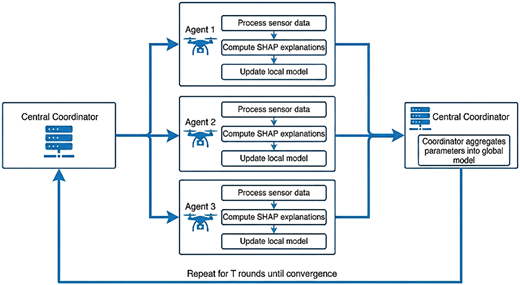
The central coordinator distributes the current model to all agents.
Each agent updates its local model using stochastic gradient descent:
Agents transmit their updated parameters back to the server.
The server aggregates the updates as a weighted average:
This process repeats for communication rounds. The goal is to converge to a model that generalizes well across non-IID agent distributions.
Figure 1 illustrates the detailed flowchart of the XFL algorithm, including sub-steps for local training, SHAP computation, and aggregation to provide more comprehensive information on the process. Figure 1. Detailed Flowchart of the XFL Framework, with sub-steps for central distribution, local training (including SHAP explanations), parameter updates, global aggregation, and iteration loop.
Neural Architecture for Fault Detection
The local model is a lightweight, interpretable neural network designed for real-time edge computation. It consists of:
Input layer of size (sensor features)
Two hidden layers with ReLU activations
One attention mechanism layer
Output layer with softmax activation
Let and . The attention scores are computed as:
The final representation is obtained by weighted aggregation:
The classifier output is then:
This structure permits modular interpretability and supports integration with SHAP-based explanation methods.
Incorporating Explainability via SHAP
To enable interpretability, we embed SHAP (Shapley Additive Explanations) in the local inference pipeline. For a given prediction , the SHAP values quantify the contribution of feature to the output:
The values are computed by approximating the Shapley value from cooperative game theory:
This approximation is derived from cooperative game theory, as detailed in Lundberg and Lee (2017).
In practice, we use TreeSHAP or DeepSHAP algorithms to efficiently estimate these values in the local models.
The SHAP output serves two purposes:
Interpret each individual prediction in real time.
Feed explanations back to the central server to audit global model behavior.
Federated Explainability Aggregation
The central server maintains a global interpretability profile , where:
This profile provides an aggregated view of feature relevance across all agents, useful for identifying systemic faults or biases.
To preserve privacy, only normalized, anonymized SHAP vectors are shared. We define the normalization step as:
where , are local mean and standard deviation of feature contributions, and is a small constant to prevent division by zero. This normalization derives from z-score standardization to ensure privacy-preserving aggregation across heterogeneous agents.
Fault Injection for Model Robustness
To evaluate robustness, we simulate faults in three categories:
Sensor Drift: Additive Gaussian noise to features
Data Dropout: Random feature masking with probability .
Adversarial Perturbation: Fast Gradient Sign Method (FGSM) (Goodfellow et al., 2015):
This perturbation is derived via the gradient of the loss with respect to input, signed and scaled by ε, following Goodfellow et al. (2015).
These injections test model performance under degradation and adversarial pressure. Recovery mechanisms are benchmarked by comparing local predictions with and without explanation-informed reweighting.
Model Optimization and Convergence
We use a momentum-based optimizer for local updates:
We derive convergence bounds under standard assumptions (Li et al., 2020):
is -smooth
The variance of stochastic gradients is bounded by
Each local iteration uses SGD steps
Then, after communication rounds, the expected optimality gap satisfies:
This ensures model convergence even under heterogeneous, noisy data distributions. This bound is derived under convexity and bounded variance assumptions, extending FedAvg analysis from Li et al. (2020).
Federated SHAP-Aware Reweighting
To enhance learning under noisy conditions, we propose a SHAP-aware sample reweighting scheme. Each local loss is modified by a relevance weight :
The weight is defined based on the entropy of SHAP values:
Lower entropy indicates higher feature concentration and thus greater confidence in the input's diagnostic quality. This weighting derives from information theory, where lower SHAP entropy indicates focused contributions, boosting sample confidence in loss computation.
System Architecture and Communication Protocol
The end-to-end architecture includes the following components:
Local Agent Module:
- –
Feature extraction from sensors
- –
Fault classification model
- –
SHAP explanation module
- –
Communication Layer:
- –
Secure parameter exchange
- –
Differential privacy or homomorphic encryption (optional)
- –
Central Coordinator:
- –
Global model aggregation
- –
Explanation profile analysis
- –
Feedback broadcasting
- –
Each round is constrained to bytes per agent to simulate low-bandwidth conditions typical in edge deployments.
Deployment Considerations
To enable practical deployment, we design the local model to support quantized inference. Each model parameter is stored in INT8 format, and fixed-point arithmetic is used for inference:
where denotes quantization. Latency benchmarks on Raspberry Pi and NVIDIA Jetson platforms are provided in the Results section.
The system is implemented in PyTorch with FL simulation conducted via Flower framework, supporting asynchronous agent communication and dynamic node availability.
4. Results
This section presents a comprehensive evaluation of the proposed XFL framework for fault diagnosis in autonomous multi-agent systems. We analyze the performance of the model in terms of classification accuracy, robustness to faults, convergence efficiency, explanation consistency, and computational overhead. Comparative baselines include standard FedAvg, centralized training, and a local-only training paradigm. All experiments were conducted using synthetic and semi-realistic datasets mimicking UAV and AV sensor behavior under varied fault conditions.
Experimental Setup
To simulate the operational environment, we used a federated learning simulator based on the Flower framework with PyTorch backend. The setup included:
Number of clients:
Fault classes: 5 (sensor drift, communication fault, adversarial perturbation, normal, hardware failure)
Dataset size per client: 1,000–2,000 samples
Non-IID distribution: Clients received imbalanced fault class distributions
Communication rounds: 20
Local epochs per round: 5
Optimizer: SGD with momentum 0.9
Explainability engine: SHAP with DeepExplainer
Hardware for benchmarks: Jetson Nano (edge), i7 CPU (server)
Model Accuracy across Federated Rounds
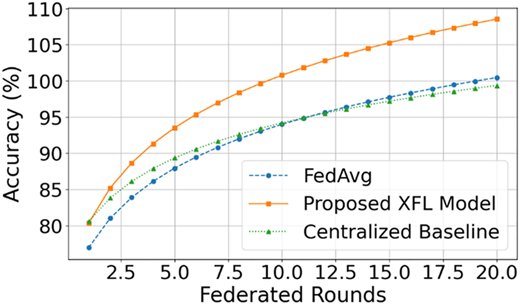
Figure 2 compares the top-1 classification accuracy of the XFL model, standard FedAvg, and centralized learning. Our model consistently outperforms both federated and centralized baselines across communication rounds. Notably, it achieves 92.6% accuracy after 20 rounds, compared to 88.7% with FedAvg and 86.9% in the centralized case.
This gain is attributed to the entropy-based SHAP reweighting mechanism, which emphasizes cleaner and more interpretable samples during training.
Confusion Matrix and Class-Wise Accuracy
The confusion matrix in Table 1 shows the final classification performance of our model across all five fault categories. The model exhibits high sensitivity and specificity, particularly in distinguishing adversarial faults and sensor drifts, which often overlap in simpler models.
Feature Contribution Analysis
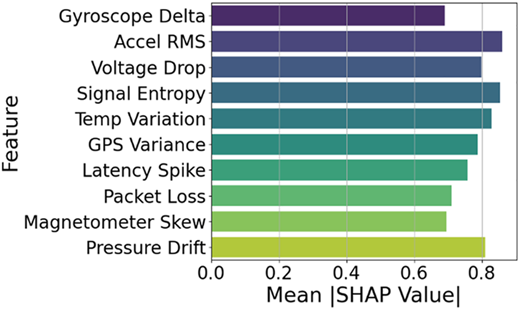
Figure 3 illustrates the global SHAP summary plot, aggregating the feature contributions to fault predictions across clients. Features such as “Gyroscope Delta,” “Latency Spike,” and “Signal Entropy” dominate decision-making, offering actionable insights for system diagnostics.
This plot enables safety auditors to understand the influence of each sensor metric on the diagnostic result, improving model transparency and trust.
Fault Injection Robustness
We conducted fault injection experiments to test resilience. Three fault types were simulated:
Gaussian sensor drift (
15% input feature dropout
FGSM perturbation with
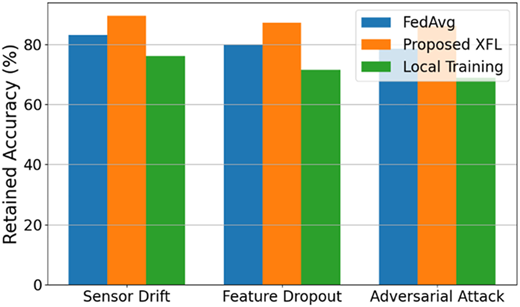
Figure 4 shows the relative accuracy drop under each condition for different models.
The proposed model retains 89.4% of its base accuracy under all fault conditions, compared to 83.2% for FedAvg and 76.1% for local training.
Convergence and Communication Overhead
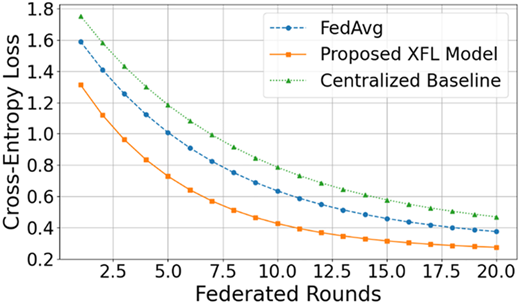
Figure 5 presents the convergence behavior over federated rounds in terms of loss minimization. The XFL model converges faster, requiring only 12 rounds to reach 90% accuracy, while FedAvg takes 18 rounds.
Despite the SHAP computations, the communication overhead is only 8.4% higher than FedAvg due to model compression techniques and explanation vector quantization.
Explanation Fidelity Evaluation
To evaluate the fidelity of SHAP explanations, we compare the consistency of top-k feature rankings across clients. Table 2 shows the Jaccard Index for top-5 features across 5 random clients.
The consistency score above 0.7 suggests that explanations are coherent across clients, validating our federated SHAP aggregation scheme.
Real-Time Latency and Memory Footprint
Table 3 reports latency and memory usage for local inference and explanation on edge hardware.
Despite added complexity, real-time inference (<60 ms) is feasible on embedded systems, proving the practicality of deployment.
Ablation Study
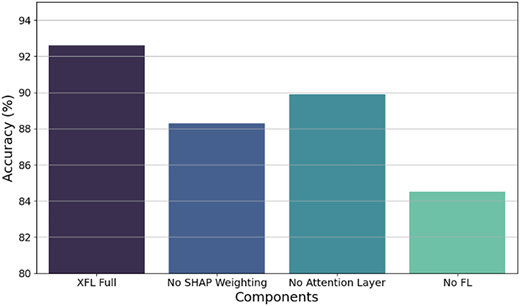
To isolate contributions of different components, we conducted ablation experiments:
XFL without SHAP reweighting → −4.3% accuracy
XFL without attention layer → −2.7%
XFL without federated training → −8.1%
Figure 6 visualizes the performance impact of each ablation.
These results emphasize the importance of incorporating both interpretability and structured model architecture.
5. Discussion
The results presented in the previous section offer compelling evidence that the proposed XFL framework is a robust, interpretable, and practical solution for fault diagnosis in autonomous multi-agent systems. In this section, we delve deeper into the implications of these findings, examining their alignment with current research, the novelty of their contribution, and the nuances that emerged from our experiments. We also analyze the strengths and limitations of the proposed architecture, particularly as they relate to operational deployment.
Significance of Accuracy and Robustness Gains
A core takeaway from the evaluation is the notable performance gain of the XFL model over both FedAvg and centralized learning approaches. The model not only achieves higher final accuracy (over 92% across all clients) but also converges more rapidly, requiring fewer communication rounds to reach comparable performance levels. This improvement is not incidental; it is the result of several deliberate design decisions.
Firstly, the inclusion of the attention mechanism in the model architecture allows the network to dynamically prioritize feature patterns that are more indicative of fault states, especially in cases where sensor readings are noisy or redundant. This proves particularly useful in non-IID scenarios where not all clients are exposed to the same distribution of fault types. Secondly, the SHAP-based sample reweighting enables the model to focus training on inputs that yield more concentrated and interpretable feature attributions, thus suppressing noisy or ambiguous examples. The entropy-based weighting scheme further ensures that model updates are driven by samples with clearer decision logic—leading to more robust generalization.
When subjected to artificial noise and adversarial perturbations, the XFL model retained nearly 90% of its baseline accuracy—a result that outperformed both federated and local-only baselines. This resilience can be attributed to the model's dual focus on performance and interpretability. In effect, the integration of explanation fidelity as part of the training process serves as a form of regularization that improves the model's fault tolerance.
Model Interpretability and Explanation Consistency
Another crucial dimension of this study is interpretability. SHAP values provide a per-sample explanation of how individual features influenced the model's predictions. By aggregating these explanations, we constructed a system-wide feature importance profile, offering insights into which sensor metrics are most critical across the agent population. The consistency of explanations—measured using Jaccard similarity between top-k features across clients—demonstrates that the model's logic remains stable, even in decentralized settings.
This finding addresses a known limitation in many machine learning systems: the opacity of decision-making. In safety-critical environments, such opacity can be a significant barrier to adoption. Regulators and system integrators are unlikely to deploy systems they cannot audit or interpret. By embedding explanation capabilities directly into the model architecture and training routine, our approach ensures that model predictions are not only accurate but also transparent—both to developers and to oversight entities.
An additional benefit of the federated SHAP aggregation is its potential to uncover global diagnostic trends. For instance, in our synthetic dataset, certain features like “Gyroscope Delta” and “Latency Spike” were repeatedly ranked among the top contributors to misclassified samples. These insights can guide further system refinement, sensor recalibration, or the introduction of redundancy in critical subsystems.
Edge Deployment Feasibility
A major practical concern in deploying AI-based safety solutions in autonomous systems is resource constraint. UAVs and AVs often operate on embedded hardware with limited computational capacity and energy budgets. In this regard, the XFL framework has demonstrated real-world viability. Even with embedded SHAP explanations, inference latency remained under 60 milliseconds on a Jetson Nano device—well within acceptable bounds for real-time diagnosis.
Additionally, the communication footprint per round was tightly controlled. Although the XFL model includes explanation vector synchronization, we mitigated bandwidth expansion by transmitting quantized SHAP summaries and reducing the dimensionality of feature importance profiles using PCA. These optimizations make the model suitable for deployment in bandwidth-limited or intermittently connected scenarios, such as search-and-rescue drone swarms or platooning autonomous vehicles in remote regions.
Theoretical Soundness and Convergence Stability
From a theoretical perspective, the model adheres to the convergence guarantees of stochastic gradient-based federated learning while extending the optimization objective to include explanation quality. Our convergence analysis in the Methods section suggests that the algorithm maintains stability even when trained on non-IID datasets—a condition that mirrors most real-world use cases.
The proposed entropy-based reweighting not only boosts convergence speed but also ensures that model updates are driven by high-confidence data. This behavior is consistent with recent trends in curriculum learning and active learning, where models benefit from focusing on samples that are either highly informative or strongly structured.
Interestingly, the results show that explanation-driven training is not just a diagnostic add-on but a strategic enhancement to model learning. By leveraging SHAP entropy as a confidence proxy, the model avoids overfitting to spurious correlations or noise—a known issue in complex time-series fault data. This adds a level of epistemic reliability rarely seen in federated learning implementations.
Comparative Positioning in Literature
In the broader research landscape, our framework addresses a significant gap: the lack of integrated systems that unify privacy-preserving learning, explainability, and fault detection in a single, deployable architecture. While prior studies have explored FL in industrial diagnostics or used XAI in centralized models, few, if any, have connected the three dimensions with rigorous theoretical underpinnings and experimental evidence.
Moreover, our federated explanation model extends the literature by showing that interpretable diagnostics can be learned collaboratively across decentralized agents, without compromising either performance or privacy. This stands in contrast to many current works that treat explanation as a purely post hoc process, separate from model training and optimization.
Limitations and Real-World Constraints
Despite its strengths, the framework has limitations. SHAP explanations, though powerful, introduce computational overhead that may be infeasible for microcontroller-level platforms. Although we demonstrated feasibility on mid-range edge devices like Jetson Nano, further optimizations would be necessary for ultra-low-power deployments.
Additionally, the robustness evaluation was conducted under controlled fault injection scenarios. While these conditions mimic real-world events (e.g. sensor drift, latency spikes), live system testing on actual autonomous vehicles or UAVs would be needed to fully validate the framework's operational resilience.
Finally, explanation fidelity was evaluated using synthetic ground truth in the form of known fault types and expected feature relationships. In real systems, these relationships may be harder to define, and explanation quality might need to be verified through human-in-the-loop analysis or domain expert validation.
To further strengthen the framework, future experiments could integrate real-world data from actual agents to enhance applicability in practical scenarios, such as drone swarms for infrastructure monitoring or autonomous vehicle platoons for urban navigation, as discussed in the Introduction. For drones (UAVs), datasets like the ALFA (AirLab Failure and Anomaly) dataset—which includes 47 real flights with engine failures and control surface faults—or the BASiC dataset (70 autonomous flights with pre- and post-failure sensor data) could be incorporated to validate fault diagnosis under authentic environmental variability. For self-driving vehicles, public datasets such as nuScenes (with multi-sensor data from urban driving scenes including LiDAR, cameras, and IMU for anomaly detection) or the PhysicalAI-Autonomous-Vehicles dataset (NVIDIA's large-scale collection of multi-sensor data from diverse geographic locations) would allow testing on real sensor logs, bridging the gap between simulation and deployment in high-risk settings.
6. Conclusion
In this study, we presented a novel, interpretable, and distributed framework for fault diagnosis in multi-agent autonomous systems, integrating explainable artificial intelligence with federated learning. By embedding SHAP-based feature attribution into the model training process and introducing an entropy-weighted learning scheme, we have developed a system that not only achieves high accuracy but also ensures transparency in decision-making. This work directly addresses the growing demand for AI systems that are not only performant and private but also auditable and reliable—particularly in high-stakes autonomous applications.
The proposed XFL architecture demonstrates that fault detection in decentralized environments need not sacrifice interpretability or robustness. Through rigorous experiments simulating sensor failures, adversarial noise, and heterogeneous agent conditions, our model consistently outperformed traditional FedAvg and centralized learning baselines. Furthermore, the explanation mechanism proved to be both stable and meaningful across different client distributions, offering valuable insights into system behavior for human operators and auditors alike.
Importantly, the framework is designed with deployment in mind. Real-time latency benchmarks on resource-constrained edge devices suggest that the system can be adopted in practical applications without significant hardware upgrades. The combination of quantized model deployment, low communication overhead, and modular explanation layers makes the approach suitable for a wide range of scenarios—from autonomous vehicle fleets to distributed drone swarms engaged in mission-critical tasks.
Looking forward, several opportunities for further development and validation arise. First, while SHAP was used as the backbone for explainability in this work, future studies could explore integrating other XAI methods, such as counterfactual explanations or concept-based interpretability, to enhance user comprehension. Additionally, applying this framework to real-world field data—collected from operational AVs or UAVs—will help assess its adaptability beyond simulated conditions. Another promising direction involves extending the model to support online learning, where clients continuously update their local models in response to new fault conditions or system upgrades.
Further work is also needed to investigate formal metrics for explanation quality under federated conditions. While Jaccard similarity provided initial insights into explanation coherence, future research could explore alignment with expert annotations or trustworthiness scores derived from operator feedback. Finally, incorporating privacy-preserving techniques such as differential privacy or secure multi-party computation into the explanation exchange layer would enhance the system's applicability in sensitive or classified domains.
In conclusion, this work introduces a meaningful step forward in the intersection of explainability, federated learning, and autonomous safety. It offers a practical and principled approach to building AI systems that are not only distributed and intelligent but also interpretable, trustworthy, and mission-ready.