


The purpose of this paper is to develop a theoretical model and investigate the relationship between talent management (TM) processes and knowledge creation (KC) in Australian public and private universities. This is because of the pragmatic advantages for organisations that focus on talents and knowledge.
This research adopted the mixed-methods design. The sample comprised 23 individuals for the qualitative study and 286 individuals for the quantitative survey questionnaire, all conducted in nine public and private universities in Australia.
The qualitative outcomes were utilised to develop the quantitative survey statement. These outcomes are based on a three-stage method of thematic analysis. The core conclusion of the quantitative study is that there is a significantly positive influence on TM processes (TMPs) on KC.
The principle limitation of this study was the scope. It only targeted one country (Australia), one state (Queensland) and a part of the higher education sector (the university).
This research designed a quantitative instrument of TMPs and KC for the Australian educational institutions. The instrument is severely designed and comprehensively conceptualised utilising social, excellent, performance, strategic, behavioural and developmental concepts within TMPs with innovative, informational and technological concepts underlining KC within the Australian public and private universities in Queensland.
The study adds value to both TM and knowledge management literature through designing a conceptual model that links both of these variables in one tool regarding the university sector.
1. Introduction
1.1 Motivation and justification for research
Knowledge and talent are two primary sources of competitive advantage for organisations (Jones, 2008; Daraei et al., 2014; Mohammed et al., 2017; Shabane, 2017). As a result, there are many practical benefits for organisations that focus on talents and knowledge (Hazelkorn, 2017; Shabane, 2017; Mohammed, 2018). For example, both talent and knowledge assist in increasing rankings and profits of higher education organisations (Lynch, 2015; Hazelkorn, 2017). To explain, universities’ rankings are aligned with the talent and knowledge of high-performing employees (Lynch, 2015; Hazelkorn, 2017; Refozar et al., 2017; Horseman, 2018; Mohammed et al., 2019a, b). These talented individuals contribute significantly to a university’s performance by attracting new students, conducting high-quality teaching and learning, conducting high-level research, and securing funds for further research (Refozar et al., 2017; Diezmann, 2018; Horseman, 2018; Mohammed et al., 2018a, b).
However, both talent management (TM) and knowledge management (KM) research works in the higher education sector are limited (Sunalai and Beyerlein, 2015; Veer Ramjeawon and Rowley, 2017; Paisey and Paisey, 2018). The majority of TM research focuses on theoretical frameworks, and they give little focus to empirical research (Gallardo-Gallardo et al., 2015; Gallardo-Gallardo and Thunnissen, 2016; Thunnissen, 2016; Mohammed et al., 2018c). Furthermore, empirical research on TM is either qualitative or quantitative with only 20 per cent of the studies using a mixed-method approach (Gallardo-Gallardo and Thunnissen, 2016; McDonnell et al., 2017). In a parallel fashion, current empirical research of KM has focused on some aspects, “such as the individualistic nature of research and loyalty to discipline, or on specific elements of KM, such as knowledge sharing amongst academics” (Agarwal and Marouf, 2017; Veer Ramjeawon and Rowley, 2017, p. 1). Hence, there is much more research to be done in this space, especially in relation to talent and knowledge using empirical methodologies.
1.2 Research objective
The aim of this research is to reveal how the organisation can attract, develop and retain their talented staff. This leads to the creation of academic knowledge together with the necessary active involvement of all staff within the Australian public and private universities. The primary objective of this study is to understand the best processes that are currently used in managing talent and knowledge creation (KC) in Australian higher education and then investigate the effect of talent management processes (TMPs) on KC.
1.3 Research contribution
This study has theoretical and practical contributions. Theoretically, the study adds a value to both TM and KM literature through designing a conceptual model that links both of these variables in Australian higher education. As a result, there is a deficiency of pragmatic evidence for those institutions in terms of TMPs and KC. This research designed a quantitative instrument of TMPs and KC for the Australian educational institutions. The instrument is severely designed and comprehensively conceptualised utilising social, excellent, performance, strategic, behavioural and developmental concepts within TMPs with innovative, informational and technological concepts underlining KC within the Australian public and private universities in Queensland. Unlike the high number of prior studies conducting either one aspect (quantitative, qualitative, or mixed method with a single case study or small sample size) or general investigation, this study is methodologically comprehensive through adopting a sequential exploratory strategy as a specific mixed-methods design. This means a more comprehensive analysis; hence, the findings are better searched and with results that when practically applied are more beneficial. In addition, this measure can be used with other universities to specifically evaluate their TMPs as well as KC and generally inform their management processes. If the Australian public and private universities carry out these concepts efficiently, they should gain the competitive advantage over their competitors.
2. Research background
Prior to giving the meaning of null and alternative hypotheses as specific hypotheses in this research, it is important to introduce the term of a hypothesis. The hypothesis is empirically a reasonably intuitive relationship among two or more elements, indicated in a shape of directional and testable information and data (Tharenou et al., 2007; Cooper and Schindler, 2011; Zikmund et al., 2013; Waithiegeni Kibui, 2015). The null hypothesis is a statistical “statement about a population parameter” (Johnson and Christensen, 2014, p. 560; O’Dwyer and Bernauer, 2014, p. 234). Likewise, the alternative hypothesis is a statistical “statement that the population parameter is some value other than the value stated by the null hypothesis” (Johnson and Christensen, 2014, p. 560; O’Dwyer and Bernauer, 2014, p. 234)[1]. These hypotheses attempt to investigate the relationship between TMPs and KC within Australian public and private universities in Queensland. TMPs may have a direct influence on KC towards an organisation’s objectives (Jones, 2008; Dries, 2013; Kim et al., 2014; Vaiman et al., 2015; Ali et al., 2017; Osigwelem, 2017; Shabane, 2017; Suryawanshi, 2017). At the same time, organisations need to construct a distributed proficiency system of TM that involves KM practices which guarantee its continuing flow (Chadee and Raman, 2012; Daraei et al., 2014; Scaringella and Malaeb, 2014; Sparrow and Makram, 2015; Urbancová and Vnoučková, 2015).
According to the conceptual model of this study, there are nine hypotheses that should be tested to achieve the research objective: to develop a theoretical model and investigate the relationship between TMPs and KC in Australian public and private universities. In this model, each process from the three TM will test an effect of KC in Australian higher education. This investigation was based on data gathered from the nine public and private universities in Queensland, Australian.
2.1 Talent management processes and knowledge creation, and hypothesis development
In regard to the link between the total TMPs and KC, Whelan and Carcary (2011), Chadee and Raman (2012), Egerova et al. (2013) and Daraei et al. (2014) state that the advancement of KC can be achieved by applying TM programs. Likewise, Sparrow and Makram (2015) point out that talent capital can achieve indirect advantages to organisations by creating new knowledge. Although TM requires a productive work environment that links to specific tasks that require appropriate talent (Scaringella and Malaeb, 2014), TMPs play a significant role in supporting strategies of KC such as cultivating knowledge creators and activists (Whelan and Carcary, 2011).
More specifically, focusing on the connection between TMPs and individual KC can benefit an organisation that focuses its attraction processes on the best highly qualified employees as well as on its KC practices. For instance, attracting the best talents to an organisation assists in meeting major challenges related to effectively creating individual knowledge, including the reduction of gaps among employees in an organisation’s different units (Frank and Taylor, 2004; Scaringella and Malaeb, 2014). Besides, Scaringella and Malaeb (2014) have indicated that mixing talent attraction with KC may assist organisations to face major challenges related to individual knowledge levels. Thus, talent attraction may have a direct influence on KC (Vaiman et al., 2015). Furthermore, a process of TD is an approach to building KC competencies in order to enhance and develop innovation (Scaringella and Malaeb, 2014; Ling, 2016; Gateau and Simon, 2017). Moreover, a process of TR can be enhanced by creating new knowledge and learning on an ongoing basis (Brockbank, 1999; Kong et al., 2013). Overall, based on the literature and this research project’s conceptual model, the following hypotheses have been tested to show the relationship between TMPs and KC.
Hypothesis 1:
There is no significant positive influence of TA on KC in a university.
There is significant positive influence of TA on KC in a university.
This hypothesis attempts to investigate the extent to which TA influences KC in the university. Here, the stated null hypothesis shows that there is a significant relationship between the two variables TA and KC. TA may have a direct influence on KC (Vaiman et al., 2015). This section of the study has therefore measured this relationship to view whether to accept or reject the stated null hypothesis.
Hypothesis 2:
There is no significant and positive impact of TD on KC in a university.
There is significant and positive impact of TD on KC in a university.
This hypothesis seeks to investigate the extent to which talent development impacts on KC in the university. Here, the stated null hypothesis H0 shows that there is a significant relationship between the two variables TD and KC. TD might have a direct impact on KC (Vaiman et al., 2015). Therefore, this section of the thesis has evaluated this relationship to ascertain whether to accept or refuse the stated null hypothesis.
Hypothesis 3:
There is no significant positive impact of TR on KC in a university.
There is significant positive impact of TR on KC in a university.
This hypothesis attempts to investigate the extent to which TR does effect on KC in the university. Here, the stated null hypothesis shows that there is a significant relationship between the two variables TR and KC. TR may have a direct effect on KC (Vaiman et al., 2015). Therefore, this section of the thesis will evaluate this relationship to recognise whether to accept or refuse the stated null hypothesis.
3. Research methodology
3.1 Research design
A sequential exploratory strategy as a specific mixed-methods design (qualitative and quantitative designs) is adopted in this study to achieve the research objective (Cameron, 2009; Cooper and Schindler, 2011; Creswell, 2014; Johnson and Christensen, 2014; Leavy, 2017). Qualitative data collection and analysis as a first stage will be followed by the second stage of quantitative data collection and analysis (Cameron, 2009; Creswell, 2014; Mauceri, 2014). After completing the qualitative study, this research moved to the quantitative study. The quantitative data collection is a process of collecting information which are characterised via numbers (Zikmund et al., 2013). Quantitative research is an empirical and systematic method which includes data in the form of measurements or numbers (Punch, 2014; Clarke and Collier, 2015). The survey questionnaire was developed and employed with Australian public and private universities. To explore the relationship between the study variables, required data were gathered by questionnaire. The survey was administered to Australian public and private universities. A Likert five-item scale was selected in this questionnaire as it is one of the most used in quantitative research (Clason and Dormody, 1994; Dimitrov, 2012; Zikmund et al., 2013). Prior to conducting the survey, the researchers refined the questionnaire through an academic peer review process which is a very important procedure of any study structure (Raj, 2013; Ritchie et al., 2013). The researchers organised a special form to examine the opinions of two groups; academic experts who specialise in the fields of human resources management and information systems, as well as academics that are not specialists in these fields to obtain a different view on the research tools that could be incorporated into the research design. Following pre-test of a questionnaire, the quantitative pilot study was used to improve the internal validity of a survey questionnaire. The pilot questionnaire individuals made up approximately 10 per cent of the sample (Lyria, 2014; Waithiegeni Kibui, 2015). The findings of the quantitative pilot study revealed the same directions as the findings of the actual study.
3.2 Conceptual model development
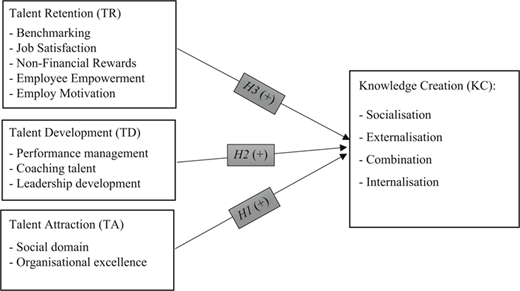
Figure 1 presents the designed conceptual model (developed from the qualitative study). In this model, each process from the three TM will test an effect of KC in Australian public and private universities. This investigation based on data gathered from nine public and private universities in Queensland, Australian. In order to understand the research model in greater detail, it is explained as follows, the model uses two key variables. An explanatory (independent) variable is represented as TMPs which will involve three constructs: TA, TD and TR. An effector (dependent) variable is addressed as KC.
3.2.1 Measures
Measurement in research is a process of describing empirical events that consist assigning numbers in a reliable and valid method (Cooper and Schindler, 2011; Zikmund et al., 2013; O’Dwyer and Bernauer, 2014). Based on the qualitative results of this research, the researchers designed the quantitative measurement of TMPs and KC for the Australian public and private universities (see Table AI). The survey questionnaire consists of four overarching constructs: TA, TD, TR and KC. Each construct operates across various sub-constructs. A construct is a term used to refer to concepts measured with multiple variables (Zikmund et al., 2013, p. 293). Two approaches conducted for quantitative data collection were in-person by hand or e-mail and an online survey. It rated on a standard five-point Likert scale (1 = strongly disagree, 5 = strongly agree). Based on the qualitative results of this research, the researchers designed the quantitative measurement of TMPs and KC for Australian higher education (see Table AI). This measure covers four composite variables which are the following:
TA is measured by 11 items (TA1–TA11) under two latent variables: social domain and organisational excellence. The social domain variable comprises five items. Three of these (TA2, TA3 and TA5) were derived from the qualitative study, one item (TA4) from Lyria (2014), and another single item (TA1) from both the qualitative study and Nogueira Novaes Southgate and Mondo (2017). Organisational excellence involves six items. Five items (TA6, TA7, TA8, TA9 and TA11) were adopted from the qualitative study, and one item (TA10) from Lyria (2014).
TD is measured by utilising 15 items (TD1–TD15) across three latent variables: performance management, coaching talent and leadership development. The performance management variable covers five items (TD1–TD5). Two of them (TD1 and TD2) were derived from both the qualitative study and AlKerdawy (2016), another two items (TD3 and TD5) from the qualitative study, and the final item (TD4) was derived from AlKerdawy (2016) as well. The coaching talent also involves five items (TD6–TD10), four of which (TD6, TD7, TD8, TD 10) were adopted from the qualitative study, and one item (TD9) from AlKerdawy (2016). Likewise, the leadership development variable contains five items (TD11–TD15). Four of them (TD11, TD12, TD14 and TD15) were adopted from the qualitative study, and one item (TD13) from Chami-Malaeb and Garavan (2013).
TR is measured utilising 25 items (TR1–TR25) under five latent variables: benchmarking, job satisfaction, non-monetary rewards, employee empowerment and employee motivation. The benchmarking variable contains five items (TR1–TR5), three of which ( TR1, TR2 and TR3) were derived from the qualitative study, one item (TR4) from (Lyria, 2014), and another single item (TR5) from Stahl et al. (2007). Job satisfaction and non-monetary rewards involve each of the same five items (TR6–TR15). Four of those (TR6, TR7, TR8 and TR9) were adopted from the qualitative study, with one item (TR10) adopted from Lyria (2014). Non-monetary rewards involve also five items. Four of them (TR11, TR12, TR13 and TR14) were adopted from the qualitative study, and one item (TR15) from Lyria (2014). Five items (TR16–TR20) of the employee empowerment variable were adopted from the qualitative study. The final latent variable of TR is employee motivation, which also comprises five items (TR21–TR25) adopted from the qualitative study of this research project.
KC is measured by four latent variables (KC1–KC20): socialisation, externalisation, combination and internalisation. The socialisation variable comprises five items (KC1–KC5), four of which were adopted from the qualitative study, with one item (KC5) adopted from Cao et al. (2012) and Offong and Costello (2017). The externalisation involves five items (KC6–KC10) which were all derived from the qualitative study. Similarly, the combination variable covers five items (KC11–KC15), three of which were derived from the qualitative study, with one item (KC14) derived from Rhodes et al. (2008), and another single item (KC15) from Li et al. (2009). The final latent variable (internalisation) consists of five items (KC16–KC20), four of which were adopted from the qualitative study, with one item (KC20) derived from Li et al. (2009).
Construct definitions and measures (operationalisation of constructs)
| No. | Conceptual definition (construct and sub-constructs) | Code | Questions | Sources | References |
|---|---|---|---|---|---|
| Construct 1: talent attraction (TA) | My university… | ||||
| 1 | Social domain (SD) | TA1 | Attracts more talented employees through providing them with social support in difficult times (e.g. maternity, paternity, death and financial difficulties) | L+Q | Nogueira Novaes Southgate and Mondo (2017); (IR3) |
| 2 | TA2 | Attracts more qualified employees through having a socially progressive work environment (e.g. multicultural) | Q | (IR1) | |
| 3 | TA3 | Supports the staff community through involvement in social, cultural or economic initiatives to attract more talented employees | Q | (B1P2; IR1) | |
| 4 | TA4 | Provides social networking activities to employees | L | Lyria (2014) | |
| 5 | TA5 | Has a good work-life balance (e.g. socialising with colleagues, proper location and amenities, recreation or lifestyle opportunities) to attract talented individuals | Q | (F1P9;IR3; IR6) | |
| 6 | Organisational excellence (OE) | TA6 | Have effective recruitment strategies for attracting the best academics and professional staff | Q | (IR1; IR3; IR4; IR6) |
| 7 | TA7 | Has a good reputation through high-quality research which enables the university to attract the best academic and professional staff | Q | (IR3) | |
| 8 | TA8 | Has a high university ranking enabling the university to attract the best academic and professional staff | Q | (IR3) | |
| 9 | TA9 | Has an innovative culture enabling it to attract more talented individuals | Q | (B1P1; IR6) | |
| 10 | TA10 | Has an appropriate organisational climate in order to attract the appropriate talents (e.g. having social friendships at work) | L | Lyria (2014) | |
| 11 | TA11 | Attracts more talented staff through having a high-quality working environment that encourages talented employees to realise creativity and innovation (e.g. physical aspects such as well-equipped workplaces). | Q | (IR6) | |
| Construct 2: talent development (TD) | My university… | ||||
| 12 | Performance management (PM) | TD1 | Has effective talent development strategies aligned with its organisational strategies | L+ Q | AlKerdawy (2016); (IR2) |
| 13 | TD2 | Determines training needs for talented individuals who have desired skills | L+ Q | AlKerdawy (2016); (IR5) | |
| 14 | TD3 | Facilitates employee performance and development with tailored training plans | Q | (IR1) | |
| 15 | TD4 | Uses human resource planning to ensure effective skill utilisation and development | L | AlKerdawy (2016) | |
| 16 | TD5 | Identifies areas needed for employee’s personal development (e.g. skills gap analysis) | Q | (B1P3) | |
| 17 | Coaching talent (CT) | TD6 | Facilitates internal job rotation to strengthen talented employees’ experiences and development in different faculties, departments, and divisions | Q | (IR5) |
| 18 | TD7 | Develops academic staff through sessions with learning and teaching training | Q | (F1P11) | |
| 19 | TD8 | Develops professional and academic staff with training and mentoring programs | Q | (IR5) | |
| 20 | TD9 | Develops its own online training materials for talented staff to gain required knowledge and skills | L+ Q | AlKerdawy (2016); (IR2) | |
| 21 | TD10 | Provides the staff with career development opportunities (e.g. further education, certifications, scholarships, etc.) | Q | (F1P11; F1P9; IR5) | |
| 22 | Leadership development (LD) | TD11 | Includes leaders’ development in the design of all job roles | Q | (F1P3) |
| 23 | TD12 | Develops leaders through further education | Q | (IR5) | |
| 24 | TD13 | Supports high potential employees to become leaders, in order to build a strong talent pool | L | Chami-Malaeb and Garavan (2013) | |
| 25 | TD14 | Assists leaders to be professionals through career development programs | Q | (IR5) | |
| 26 | TD15 | Develops succession planning, and identifies alternative talented employees for leadership positions | Q | (B1P1) | |
| Construct 3: talent retention (TR) | My university… | ||||
| 27 | Benchmarking (B) | TR1 | Determines which talent retention strategies are most effective | Q | (IR3; IR5; IR6) |
| 28 | TR2 | Benchmarks other universities inside Australia to evaluate talent retention strategies | Q | (IR3; IR5; IR6) | |
| 29 | TR3 | Benchmarks other universities outside Australia to evaluate talent retention strategies | Q | (IR3; IR5; IR6) | |
| 30 | TR4 | Has a competitive compensation system which is a motivating factor to retain our talented employees | L | Lyria (2014) | |
| 31 | TR5 | Provides a highly competitive compensation system for long-term to retain talent | L | Stahl et al. (2007) | |
| 32 | Job satisfaction (JS) | TR6 | Has a supportive learning environment which promotes employee job satisfaction to retain qualified employees | Q | (F1P8; IR2) |
| 33 | TR7 | Have high-quality working conditions to retain the high qualified talent | Q | (IR2) | |
| 34 | TR8 | Managers treat employees well through relationship building to retain talent | Q | (IR2) | |
| 35 | TR9 | Promotes equal opportunity to retain its qualified employees | Q | (IR6) | |
| 36 | TR10 | Ensures talented employees are satisfied | L | Lyria (2014) | |
| 37 | Non-financial rewards (NFR) | TR11 | Provides assistance with healthcare and safety issues to retain its qualified employees | Q | (IR3) |
| 38 | TR12 | Accounts for personal factors and life events (e.g. family responsibilities) to encourage its talented staff | Q | (IR6) | |
| 39 | TR13 | Provides fair acknowledgement of employee work efforts and achievements to better keep employees | Q | (IR2) | |
| 40 | TR14 | Provides flexibility for work hours, roles and tasks (e.g. for care of young children) to retain its qualified employees | Q | (IR1) | |
| 41 | TR15 | Has a good system of non-financial rewards to retain talented staff | L | Lyria (2014) | |
| 42 | Employee empowerment (EE) | TR16 | Encourages innovative thinking, and promotes creative ideas from talented employees | Q | (IR5) |
| 43 | TR17 | Keeps employees engaged and motivated to retain talented staff | Q | (F1P11) | |
| 44 | TR18 | Adopts management by career enrichment programs to increase talented employees’ confidence in themselves | Q | (F1P8; F1P1) | |
| 45 | TR19 | Retains its qualified employees by providing them with sufficient freedom to actively perform their jobs | Q | (IR2; F1P4) | |
| 46 | TR20 | Retains its talented staff by providing them enough authority to complete their work efficiently | Q | (F1P4; IR2) | |
| 47 | Employee motivation (EM) | TR21 | Retains its qualified employees by providing them opportunities to develop their careers | Q | (IR2; IR3; IR4; IR6) |
| 48 | TR22 | Retains its talented staff with financial rewards, high salaries or remuneration | Q | (IR2; IR3; IR6) | |
| 49 | TR23 | Retains its qualified employees through providing them with individual funding for academic research | Q | (IR2; IR5) | |
| 50 | TR24 | Monitors performance and suggests advice regularly (e.g. per semester) in an encouraging manner to retain its talented staff | Q | (IR2; IR4) | |
| 51 | TR25 | Utilises an employee growth programme for the development of motivation and engagement to retain its qualified employees | Q | (IR5) | |
| Construct 5: knowledge creation (KC) | In my university/ (my university)… | ||||
| 52 | Socialisation (S) | KC1 | The technology enables creativity and innovation through collaboration | Q | (IR6) |
| 53 | KC2 | The technology facilitates creative discussion through the learning process (e.g. exploring and understanding ideas) | Q | (IR6) | |
| 54 | KC3 | The technology facilitates skills development (e.g. learning by observation) | Q | (IR1) | |
| 55 | KC4 | Encourages social learning through employees’ discussion (e.g. social spaces such as dining rooms) | Q | (IR2; IR6) | |
| 56 | KC5 | Knowledge about how to use technology is learned effectively from colleagues | L | Cao et al. (2012), Offong and Costello (2017) | |
| 57 | Externalisation (E) | KC6 | Seeks external technology solutions for knowledge management problems (e.g. search ability or accessibility) | Q | (B1P1; B1P2; B1P4) |
| 58 | KC7 | Knowledge creation with external parties is well facilitated through collaborative tools (e.g. meetings, confluences, conferences, seminars and SharePoint) | Q | (IR3) | |
| 59 | KC8 | Is effective in creating new knowledge through research and publications. | Q | (IR6) | |
| 60 | KC9 | Employees share knowledge and best practices with staff from other organisations | Q | (IR1) | |
| 61 | KC10 | Acquires new knowledge from investigation of external sources | Q | (IR5) | |
| 62 | Combination (C) | KC11 | Relevant knowledge can be accessed in online databases | Q | (IR2) |
| 63 | KC12 | Has effective communication channels supported by technology to distribute knowledge | Q | (IR2) | |
| 64 | KC13 | My work is supported by the university technology and IT systems, software, and equipment | Q | (IR3; IR5) | |
| 65 | KC14 | The database provides employees with support and improvement to employee skills | L | Rhodes et al. (2008) | |
| 66 | KC15 | Adopts information repositories, best practices, and lessons learned | L | Li et al. (2009) | |
| 67 | Internalisation (I) | KC16 | Designs, develops and builds appropriate technological systems and solutions | Q | (IR2) |
| 68 | KC17 | Have effective methods for creating learning policies and procedures | Q | (IR2) | |
| 69 | KC18 | Is responsible for talented employees to manage and advise on learning processes | Q | (IR5) | |
| 70 | KC19 | Talented employees can access support when learning by practice (e.g. for teaching or course content development) | Q | (IR5) | |
| 71 | KC20 | Provides on-the-job training | L | Li et al. (2009) | |
Notes: Q = qualitative methods; L = literature; F1PX = focus group (a session one), participant X; B1PX = brainstorming (a session one), participant X; IRX=individual interview, participant X
3.3 Research sampling
In the scope of this study, professional and academic staff working in the Australian public and private universities were recruited. These individuals have become a competitive weapon and resource for organisations in obtaining a sustainable competitive advantage (Chadee and Raman, 2012; Ortlieb and Sieben, 2012; Thomas, 2015). These individuals provide accurate information about TMPs and KC due to their high level of expert knowledge (Ortlieb and Sieben, 2012; Thomas, 2015). In total, 6 participants for brainstorming, 11 in focus group session and 6 individual interviews respectively were conducted in the qualitative study. In terms of the quantitative study, the researchers initially sampled between 900 and 1,100 individuals among the various nine public and private universities in Queensland. In total, 357 questionnaires were received but only 286 were properly completed and used for further analysis.
3.4 Data analysis
This paper is focused only on the quantitative analyses and its findings, which has been detailed out in the empirical study section. This is because, in line with the objectives of this paper, it fits to discuss the analytical results of the quantitative data. This study conducted several quantitative analysis techniques. These methods are within SPSS software. A number of statistical techniques were utilised which included the following key techniques:
Exploratory construct validity (ECV): to identify the valid items to be included at this scale; to condense contained information of original variables from a larger number of factors into a smaller number without missing information (Tharenou et al., 2007; Osborne and Costello, 2009; Yong and Pearce, 2013; Zikmund et al., 2013; Jamil et al., 2014). In this regard, the numerical data were analysed using SPSS.
Correlation analysis: to assess the level of association between two variables (Remenyi et al., 1998; Collis and Hussey, 2013; Field, 2018) using SPSS.
Cronbach’s α test: to measure internal constancy (Hair et al., 2010; Zikmund et al., 2013; Peters, 2014; Field, 2018) using SPSS.
Simple regression analysis: to test the research hypotheses (Hair et al., 2010) using SPSS.
4. The empirical study
4.1 Exploratory construct validity
Prior to measuring the construct validity of the questionnaire instrument and multivariate data analysis, first the data file was screened to ensure the quality of the data analysis process. For this purpose, Mahalanobis distance within SPSS was used to identify multivariate outliers (De Maesschalck et al., 2000; Mertler and Reinhart, 2017). By this procedure, 49 survey questionnaires were identified and eliminated from further data analysis. The final sample size comprised 237 for further analysis. For achieving the purpose of this particular study, ECV as a method was utilised to measure the validity of the questionnaire instrument (Aladwani, 2014; Olufadi, 2015; Hajian et al., 2016; Olufadi, 2017). ECV of the measurement model was evaluated by conducting exploratory factor analysis (EFA) that is commonly used in statistical applications in the social sciences (Tharenou et al., 2007; Osborne and Costello, 2009; Yong and Pearce, 2013). Hence, this research used EFA within SPSS. The key aim of this technique is to summarise and reduce latent variables into a smaller number of generated factors that are greatly associated with them (Tharenou et al., 2007; Osborne and Costello, 2009; Schumacker and Lomax, 2010; Yong and Pearce, 2013; Zikmund et al., 2013). For determining the initial number of retained factors, there are two criteria which should be considered when using EFA (Hair et al., 2010; Field, 2018):
sampling adequacy and correlation between variables should exist; and
correlation coefficient of items should be ⩾ 0.40 to be statistically significant.
Thus, each element in the conceptual framework model of this research was calculated to obtain load factors. The data set being used consisted of 61 items that measured four latent constructs. However, items not meeting the considerations of the above criteria were eliminated.
4.1.1 Sampling adequacy and correlation between variables
For verification of sampling adequacy, Kaiser (1974) recommends to use Kaiser–Meyer–Olkin (KMO) measure of computing sampling adequacy; it ranges between 0 and 1 (Dimitrov, 2012; Gaskin and Happell, 2014; Field, 2018). The value 0 denotes a totality of partial correlations greater than the sum of total correlations. This also means that the correlation model is widespread, hence the use of EFA is not appropriate. If the value is close to 1.0, this indicates that the correlation model is reliable (more total correlations), and the EFA analysis will be credible (Field, 2018). Kaiser (1974) also emphasises that the accepted values should be greater than (0.50); if values are less than 0.50, a researcher should either collect more data (increase the sample size) or rethink included variables in their measurement (Somashekhar et al., 2016; Van Delft-Schreurs et al., 2016; Field, 2018). To verify the correlation between variables, the Bartlett test was used to examine null hypothesis. If the correlation matrix was an identity matrix, this indicates that all correlation coefficients are 0. The significance test will inform a researcher that a correlation matrix is not the identity matrix (Field, 2018). Table I provides the results of KMO and Bartlett’s test to the study scales.
KMO and Bartlett’s Test to the study scales
| Kaiser–Meyer–Olkin measure (KMO) sampling adequacy | 0.938 |
| Bartlett’s test of sphericity | |
| Approx. χ2 | 5,438.616 |
| df | 561 |
| Sig. | 0.000 |
As shown in Table I, the value of KMO is 0.938. This result confirms the verification of the first EFA criterion for the research measurement because the value of KMO is greater than 0.50. This indicates that the correlation model is reliable more total correlations, and the EFA analysis will be credible. In addition, the Bartlett test was significant (p < 0.000).
4.1.2 Principal components analysis (PCA)
To verify the second criteria that mentioned above, it requires using the PCA to decrease the data set (Yong and Pearce, 2013; Gaskin and Happell, 2014). PCA is considered one of the most accurate methods and common use of EFA methods (Gefen et al., 2000; Quiyono, 2014). The aim of using this analysis is to condense contained information of original variables into fewer factors without missing information (Hair et al., 2010; Bańbura and Modugno, 2014). In the current study, EFA was reiterated many times to reach final solutions of related items and achieve the four criteria above. A total of 30 items were eliminated from the preliminary set of 61 items. By conducting the EFA technique, Table II shows the variance explained of each component using PCA.
EFA results of the research scales (rotated component matrix)
| Component | |||||
|---|---|---|---|---|---|
| No. | Items | 1 | 2 | 3 | 4 |
| 1 | TD8 | 0.757 | |||
| 2 | TD2 | 0.698 | |||
| 3 | TD3 | 0.681 | |||
| 4 | TD13 | 0.671 | |||
| 5 | TD7 | 0.651 | |||
| 6 | TD14 | 0.625 | |||
| 7 | TD1 | 0.618 | |||
| 8 | TD10 | 0.568 | |||
| 9 | TD11 | 0.510 | |||
| 10 | KC1 | 0.718 | |||
| 11 | KC2 | 0.689 | |||
| 12 | KC3 | 0.655 | |||
| 13 | KC4 | 0.602 | |||
| 14 | KC5 | 0.577 | |||
| 15 | KC16 | 0.538 | |||
| 16 | KC17 | 0.523 | |||
| 17 | TR4 | 0.837 | |||
| 18 | TR5 | 0.792 | |||
| 19 | TR14 | 0.754 | |||
| 20 | TR22 | 0.680 | |||
| 21 | TA1 | 0.934 | |||
| 22 | TA8 | 0.932 | |||
| 23 | TA7 | 0.792 | |||
It is apparent from this table that correlation coefficient of items was significant because of values were greater than 0.40. Hence, this free exploration confirms the validity of the questionnaire instrument. The Cronbach’s α was to manger the reliability of the composite variables of the study (Table III).
The reliability test for each composite variable
| No. | Composite variables | Items included | No. of items | Cronbach’s α |
|---|---|---|---|---|
| 1 | TA | TA1, TA7 and TA8 | 3 | 0.915 |
| 2 | TD | TD8, TD2, TD3, TD13, TD7, TD14, TD1, TD10 and TD11 | 9 | 0.897 |
| 3 | TR | TR4, TR5, TR14 and TR22 | 4 | 0.868 |
| 4 | KC | KC1, KC2, KC3, KC, KC5, KC16 and KC17 | 7 | 0.896 |
As shown in Table III that values of the Cronbach’s α of the composite variables are ranged between 0.868 and 0.915. These indicate that the values are statistically acceptable. This is because the values are greater than the acceptable rate (0.70). Hence, this result insures the reliability of the whole measurement of both TMPs and KC.
4.2 Regression analysis and hypotheses testing
The key objective of this research is to investigate the relationship between TMPs and KC in the Australian public and private universities. Achieving this objective was through hypotheses testing using the simple regression analysis technique (Remenyi et al., 1998; Sekaran and Bougie, 2016). The simple (bivariate) regression analysis is a statistical method to examine relationships between one independent variable and one dependent variable (Hair et al., 2010; Jeon, 2015; Field, 2018). According to the conceptual model of this study, each composite variable of TMPs (independent variable) influences with each composite variable of KC (dependent variable) individually. Hence, simple regression is a suitable technique to test the research hypotheses (Hair et al., 2010). The regression analysis is a powerful method when the aim is to comprehend the relationships between independent composite variables and dependent composite variables (Chin, 1998; Baig, 2010; Jeon, 2015). To assess the regression analysis results in regard to description of the relationship between independent and dependent variables, there are two key indicators: coefficient of determination (R2) and t-value (Hair et al., 2010; Saunders et al., 2016; Sekaran and Bougie, 2016). Table IV provides the results of the research hypotheses using simple regression to investigate the relationship between TMPs and KC. It shows the values of regression paths: R2-value, F-value, estimate (β), standard error (SE), t-value and p-value of nine hypotheses.
The results of research hypotheses using the simple regression technique
| Regression weights using SPSS | |||||||||
|---|---|---|---|---|---|---|---|---|---|
| Hypothesis | The path | R2 | β | SE | F-value | p-value | t-value | p-value | Results |
| H10 or H11 | KC ← TA | 0.099 | 0.315 | 0.126 | 25.94 | 0.000 | 5.09 | 0.000 | Accepted alternative hypothesis (H11) |
| H20 or H21 | KC ← TD | 0.444 | 0.667 | 0.039 | 187.99 | 0.000 | 13.71 | 0.000 | Accepted alternative hypothesis (H21) |
| H30 or H31 | KC ← TR | 0.267 | 0.517 | 0.087 | 85.71 | 0.000 | 9.25 | 0.000 | Accepted alternative hypothesis (H31) |
Note: n=237
5. Discussion
The core objective of this study is to develop a theoretical model and investigate the relationship between TMPs and KC in the Australian public and private universities. This objective was achieved by testing three hypotheses. Regression paths conducting by regression analysis showed that all effect paths between TMPs (the independent composite variables) and KC (the dependent composite variable) in the Australian higher education sector are strongly significant and positive. Thus, the discussion of this investigation is detailed as the following.
5.1 Hypothesis 1
As shown in Table IV, it is apparent that the regression path is strong and sufficient to describe the relationship between TA and KC. This is demonstrated through accounted F-value 25.94 and t-value 5.09 which are significant (P< 0.05). However, R2-value is very weak (0.099) which is not enough to explain the variance between the two mentioned variables. This indicates that 9.9 per cent of variation in KC is contributed to TA. The remaining percentage (90.1 per cent) is unexplained variance by other factors that are not included in the regression path, and might be areas for future research. The value of β is 0.315 which means that when there is a rise of one unit in TA, KC is predicted to rise 0.315 units with a standard error of 0.126. These results confirmed that there was a strongly significant positive influence for TA on KC in a university, which in turn allowed the rejection of null hypothesis H10 and an acceptance of alternative hypothesis H11.
This means that social support in difficult times, as well as the university ranking and reputation, are significantly supported by encouraging social learning through employees’ discussion; using technology is effectively learned from colleagues; designing, developing and building appropriate technological systems and solutions; and having effective methods for creating learning policies and procedures. Also, a fore mentioned components of a social domain and organisational excellence are significantly influenced by KC through creativity and innovation, creative discussion by the learning process and skills development. This means that if a university’s intent is to enhance KC, the university should invest in attracting new talents. This outcome aligns with the results of previous research conducted in Malaysian private colleges by Khor (2017) which showed there was a significant positive influence of TA on KC. Such outcomes match the findings other prior research (conducted outside the higher education sector) by Rahimi et al. (2015) who found a significant effect of talent recruitment on KC in Amirkabir Petrochemical Company, Mahshahr. Furthermore, this result supports other researchers such as Whelan and Carcary (2011), Chadee and Raman (2012), Egerova et al. (2013) and Daraei et al. (2014) who have all stated that the advancement of KC can be achieved by conducting TA practices as an essential element of the TM system. In the same vein, Frank and Taylor (2004) and Scaringella and Malaeb (2014) have emphasised that TA assists organisations in enhancing their abilities in creating individual knowledge, by providing the best way to meet major challenges through reducing KC gaps among employees at various organisational levels.
5.2 Hypothesis 2
As shown in Table IV, it is clear that the regression model is reasonably satisfactory and sufficient to describe the relationship between TD and KC. This is through accounted F-value 187.99 and t-value 13.71 which are significant (p< 0.05). Although the R2-value is reasonably medium (0.444), it is not sufficient to explain the variance between the two stated variables. The R2-value indicates that 44.4 per cent of variation in KC is accounted for by TD. The remaining percentage (55.6 per cent) is unexplained variance by other factors that are outside of the regression path, and could be areas for future investigation. The value of β is 0.667 which means that when there is a rise of one unit in TD, KC is increased by 0.667 units with a standard error of 0.039. These results confirmed that there is a strongly significant positive impact for TD on KC in a university, which allowed for the rejection of null hypothesis (H20) and the acceptance of alternative hypothesis (H21).
To clarify, developing talent through training and mentoring programs; determining training needs; facilitating employee performance and development; supporting talents to become leaders; assisting leaders to be professionals; providing staff with effective talent development strategies and career development opportunities; and including leaders in the design of all job roles were all significantly and positively supported by:
encouraging social learning through employees’ discussion;
using technology is effectively learned from colleagues;
designing, developing and building appropriate technological systems and solutions; and
having effective methods for creating learning policies and procedures.
Likewise, the stated aspects of performance management, coaching talent and leadership development were positively and strongly affected by creating new information through creativity and innovation, creative discussion via the learning process, and skills development. This means that if a university’s intent is to improve KC, the university should invest in the development of talent.
This outcome aligns with previous investigations conducted in Malaysian private colleges by Khor (2017) which showed a significant positive effect of TD on KC. Such results underpin the thoughts of Whelan and Carcary (2011), Ling (2016) and Wu et al. (2016) who have suggested that KC can contribute to talent development through better communications amongst all the organisation’s employees. These results are further supported by the ideas of Scaringella and Malaeb (2014), Ling (2016) and Gateau and Simon (2017) who have stated that TD is an approach to building KC competencies in order to improve and develop innovation. Similarly, this finding is reinforced by previous studies conducted in the Indian information technology services sector by Kong et al. (2013) and the Nigerian higher education by Osigwelem (2017) both of which showed that TD through coaching and training assists in creating new knowledge.
5.3 Hypothesis 3
As shown in Table IV, it is obvious that the regression path is reasonably acceptable and sufficient to describe the relationship between TR and KC. This is demonstrated through accounted F-value 85.71 and t-value 9.25 with p-value 0.000 which is significant (p< 0.05). On the other hand, the R2-value is weak (0.267) which is not sufficient to explain the variance between the two mentioned variables. This ratio indicates that 26.7 per cent of variation in KC is accounted for by TR. The remaining percentage (73.3 per cent) is unexplained variance by other factors that are not included in the regression path, and should be researched in future investigation. The value of β is 0.517 which means that when there is an increase of 1 unit in TR, KC is predicted to increase 0.517 units with a standard error of 0.087. These findings emphasised that there is a strongly significant positive impact for TR on KC in a university, which allowed for the rejection of null hypothesis (H30) and the acceptance of alternative hypothesis (H31).
Providing a highly competitive compensation system and flexibility for work hours, roles and tasks; as well as monetary rewards, and high salaries are positively and significantly supported via:
encouraging social learning through employees’ discussion; using technology is effectively learned from colleagues;
designing, developing and building appropriate technological systems and solutions; and
having effective methods for creating learning policies and procedures.
Furthermore, the stated aspects of benchmarking, non-financial rewards and employee motivation were positively affected by creating new knowledge through creativity and innovation, creative discussion via the learning process and skills development. This means that if a university’s intent is to improve KC, the university should invest in the retention of talent. This outcome supports prior studies conducted in Malaysian private colleges by Khor (2017) which showed a significant positive effect of TR on KC. Moreover, these outcomes corroborate prior research conducted outside the higher education sector by Brockbank (1999), Kong et al. (2013) and Rahimi et al. (2015) who found that TR can be enhanced via greater learning capabilities through encouraging creativity and an innovation culture, as well as creating new knowledge and promoting continuous learning.
6. Conclusions, limitations and recommendations
The core conclusion of this study is that there is a strongly and significantly positive impact for TMPs (TA, TD and TR) on KC in Australian universities. All regression paths between TMPs (independent composite variables) and KC (dependent composite variables) in the Australian higher education sector are strongly significant and positive. There are three alternative hypotheses of the study that F-values and t-values are significant (p< 0.05). This means that TMPs play a core role in KC in Australian higher education. Academic talents consider the most valuable talent sources of the university which can be continuously developed, retained and utilised by creating knowledge from these talented individuals.
However, the principle limitation of this study was the scope. It only targeted one country (Australia), one state (Queensland) and a part of the higher education sector (the university). The research conceptual model was developed depending on the qualitative study. Then, the quantitative study was conducted in the mentioned scope and derived the final results. Hence, the generalisability of these results is limited to the Australian higher education sector in Queensland. It would be useful to investigate the current methodology and topic of this research in other Australian sectors such as industrial and commercial sector in order to generalise the results within the Australian environment.
Note
Following standard notation H0 (null hypothesis) and H1 (alternative hypothesis).

