This study aims to investigate how knowledge recombination contributes to innovation during digital transformation, focusing on business method (BM) patents. It introduces the concepts of dominant and spark technologies to capture different types of cognitive proximity in the innovation process. The research aims to reveal how these distinct knowledge types influence the creation of BM innovations across regions. By mapping knowledge interactions in patent networks, the study provides new insights into the mechanisms of technological emergence and highlights their strategic relevance for knowledge-intensive organizations and regions navigating digital change.
Using patent data from the European Patent Office (1981–2015), the study constructs co-occurrence-based knowledge spaces to map technological proximity and recombination. Two types of technologies are defined: dominant (widely combinable) and spark (highly BM-specific), measured via weighted centrality in network analysis. Regional-level indicators are developed, and fixed-effects negative binomial regression models are employed to evaluate their impact on BM patent output. This approach integrates cognitive proximity theory and evolutionary economic geography into empirical knowledge mapping, enabling analysis of regional innovation through a knowledge management lens.
The analysis shows that both dominant and spark technologies significantly contribute to the creation of BM patents, though their effects vary by regional innovation capacity. Dominant technologies, broadly used across patenting activity, support general recombination, while spark technologies are tightly linked to BM-specific innovations. Notably, spark technologies exert greater influence in metropolitan regions with stronger innovation ecosystems. These findings highlight the differentiated roles of knowledge types in innovation and demonstrate that knowledge recombination dynamics are context-dependent. The study also confirms the value of cognitive proximity metrics in predicting innovation outputs.
This study extends knowledge management theory by operationalizing and empirically testing cognitive proximity through patent-based knowledge spaces. It introduces actionable metrics – dominant and spark technologies – that offer new ways to evaluate knowledge recombination potential. Unlike traditional studies focused solely on knowledge stock or diffusion, this work emphasizes structural relationships between knowledge domains and their implications for business innovation. The findings offer valuable guidance for firms, regions, and policymakers seeking to foster innovation in the digital economy by aligning knowledge strategies with technological convergence patterns and local knowledge structures.
1. Introduction
Ideas that are both novel and valuable are getting harder to find, leading to falling research productivity across sectors (Bloom et al., 2020). As the source of technological innovation dries up, it is more important to understand the sources and mechanisms of technological emergence including its predictive and descriptive aspects (Burmaoglu et al., 2019). The current digital transformation occurring globally offers a unique opportunity to examine the process of technological emergence.
Recent advancements in ICT drive digital transformation by enabling businesses to move formerly analog business activities online. “Technological innovation and ICT represent a way for knowledge economic countries to foster economic development, exploit technology (ICT), improve levels of education and training and address social (societal) issues within a knowledge economy” (Choong and Leung, 2021, p. 1597). The development of new digital business designs create value for business model-related innovations (Chesbrough, 2002; Zott et al., 2011). Digital transformation-related business model innovations lead directly to the development of novel products and services (Zott and Amit, 2010) and models based on network technologies enable e-commerce, e-service and platform business models (An et al., 2017; Desyllas and Sako, 2013; Wagner, 2008). More importantly, digital transformation helps overcome one of the greatest challenges of recognizing business model innovation: the inability to capture its value (Rai and Jagannathan, 2012; Tyacke and Webb, 2007; Wagner, 2008). Digital transformation helps overcome this by making business methods more patentable (Spulber, 2011).
The aim of this study is to understand how digital transformation unfolds through the recombination of technological knowledge embodied in business method (BM) patents. Specifically, we investigate whether the value of knowledge recombination and the overall relatedness of technologies within a region affect BM-related innovation. In doing so, our study addresses the question: Do dominant technologies (DT; widely applicable knowledge elements) and spark technologies (ST; BM-specific knowledge elements) contribute differently to the creation of BM patents across European regions?
This regional perspective is essential. Using European Patent Office (EPO) data at the Nomenclature of Territorial Units for Statistics (NUTS) level 3, we focus on how metropolitan versus non-metropolitan regions differ in their capacity to mobilize knowledge for BM innovation. By highlighting the regional character of BM patenting, our study contributes to understanding the uneven geography of digital transformation.
Theoretically, we position our study within evolutionary economic geography (EEG). Building on prior work that emphasizes cognitive proximity and relatedness density in regional innovation (Boschma, 2005; Feldman et al., 2015; Kogler et al., 2017; Balland et al., 2019), we extend this perspective by distinguishing two forms of knowledge recombination: DT and ST. This distinction allows us to capture both general-purpose, combinable technologies and BM-specific, context-dependent ones, thereby refining the conceptual tools of EEG for analysing digital-era innovation in knowledge spaces. The knowledge space can embody different aspects and forms of knowledge by incorporating ownership of intellectual property and by defining separate technological categories, i.e. BM technological emergence.
Knowledge recombination can be studied through knowledge spaces represented by networks of publications using bibliometric data (Burmaoglu et al, 2019). The networks represent knowledge networks built using co-occurrence in science mapping to recognize patterns of subtopic fields based on network characteristics such as density and centrality, representing how well a topic is developed and changes across time periods (Martínez-Martínez et al., 2022). Studies have used these methods to identify radical discovery and innovation (Kostoff, 2006), algorithmically identifying early scientific breakthroughs or ‘hot spots’ of knowledge emergence without preconceived biases (Small et al., 2014; Winnink et al., 2019).
Other studies have adopted these approaches to recognize characteristics of recombination including identification and measurement of emergent technologies: fast recent growth, transitional, high commercial potential, and science-driven (Cozzens et al., 2010), or, radically novel, rapid growth, coherent, impactful, and uncertain/ambiguous (Rotolo et al., 2015); distinguish between disruptive and emerging technologies (Li et al., 2018). The focus of early studies has been on identifying how to accelerate radical innovation that occur along technological life cycles that build on past achievements (Bers et al., 2009). These approaches, however, use relative measures to define emergence and do not consider commercialization, an integral part of innovation. Innovation involves the creation of knowledge for a novel idea that emerges as a commercialized innovation generating value (Colombo et al., 2017).
While still imperfect, bibliometrics derived from patents represent a step closer to commercialization. The factors of innovation based on the knowledge landscape of patents are recently explored (Teodoridis et al., 2022). Bibliometric approaches are applied to patents to understand the knowledge space as well as the commercialization of technology. One common approach to analysing research discoveries is to model cross-disciplinary impact (Winnink et al., 2019). Playing an important role in the digital economy, BM patents represent a novel application of digital technologies, an anticipated commercial value, and a defined boundary of technological emergence. Patents provide the inventor with the exclusive right to prevent others from using their invention for a limited period, but the inventor must simultaneously risk exposing their core knowledge to the public. BM patents enable the transmission of novelty value to further novel BM inventions that are defined by technological areas (An et al., 2017; No et al., 2015; Rai and Jagannathan, 2012). By definition, BM patents relate to a new method of conducting business as incorporated by networks, software, and data-processing technologies (Bagley, 2001). Yet, filing for a patent also involves legal and administrative costs that suggest that the patent value should be higher. Thus, BM patents play an important role in the digital economy arena that can be modelled in the knowledge space.
Although the importance and value of BM patents have been discussed in previous studies, and the framework and conditions that might facilitate and excel the invention of BM patents and their characteristics have not been investigated so far, to the best of our knowledge. BM patents have been recognized as an important knowledge source for investigating knowledge diffusion (An et al., 2017; Chang et al., 2009; Jiang et al., 2019; No et al., 2015), evolutionary paths (Choi et al., 2008), valuations (Wu, 2005), and the strategic use of BM knowledge (Desyllas and Sako, 2013; Wagner, 2008). The interaction between the knowledge recombination of specific pairs of technological domains and a region’s knowledge relatedness has not been investigated systematically. How knowledge recombination occurs is highly relevant for novel knowledge production activities; however, recombination can focus on matching targeted knowledge domains to a specific specialization, i.e. BM in the present study, or consider broader characteristics of the entire regional knowledge space. Thus, the research question of this study is whether or not the value of knowledge recombination and the overall knowledge relatedness of a technology affect BM-related innovation within a region.
Furthermore, the debate on what kind of type of innovation is most useful in different environments and sectors such as metropolitan and non-metropolitan areas depending on patent metrics in specific technologies (Castaldi and Los, 2017; Fritsch and Wyrwich, 2021; OECD, 2025). Using a regional innovation perspective, the recombination of knowledge along peripheries enables spatial modelling of knowledge accumulation (Eder 2019). By examining the cognitive boundary, it is possible to describe the accumulation of different types of knowledge needed for the critical mass of technological emergence.
The proposed approach includes two steps:
creating a knowledge space utilizing the Cooperative Patent Classification (CPC) schema to generate co-occurrence networks to identify potentially valuable technologies for knowledge recombination activities; and
defining “dominant” and “spark” technologies, which are newly developed cognitive proximity measures, to illuminate the value of target knowledge for recombination at the regional level.
Theoretically, this is based on arguments put forward by the evolutionary economic geography literature (Boschma and Martin, 2010; Kogler, 2015), using key measures designed based on network theory and knowledge recombination (Xiao et al., 2022).
The empirical analysis utilizes EPO patent applications from 1981 to 2015 derived from the EPO Patent Statistical Database (PATSTAT). Inventor records were subsequently geocoded based on the NUTS standard. Subsequently, two there are two main data sets; one that contains all inventions to analyse the overall state-of-the-art of inventive activities, and another that only contains BM inventions. The separate knowledge spaces enable the evaluation of the relative position of BM knowledge within the overall knowledge landscape, which allows the measurement of the key indicators of interest. Then, the effect of dominant and spark technologies for the creation of BM inventions are examined.
Focusing on the BM knowledge domain, the study contributes to ideas of technology emergence as the recombination of knowledge across cognitive boundaries to address the following questions: Which BM classes are more widely used with other technologies (dominant BM-related technologies)? Which technologies are developed mostly driven by the BM class (spark BM-related technologies)? Do the BM-related dominant or spark technologies contribute to the creation of the new BM patents at the regional level?
The remainder of this paper is organized as follows: Section 2 provides a brief explanation on BM patents and related studies, and a theoretical explanation of the evolutionary framework regarding the diffusion of new technological knowledge. Section 3 explains the data and research model, and specifically, the status of BM patenting in the European Union with a comparison between the overall and the BM knowledge spaces. Section 4 presents methods, and Section 5 concludes with a discussion.
2. Literature review
2.1 BM patents
By transforming knowledge into intellectual property and enabling appropriation of value, patents have come to play an important role in innovation strategy. In the case of BM, a debate arose regarding patentability, as its boundary of “intellectual property” and as a standard for determining novelty and advancement are highly ambiguous (Rai and Jagannathan, 2012; Tyacke and Webb, 2007; Wagner, 2008). Wagner (2008) finds that BM patents require longer examination periods than other patents, and competitors have challenged 60% of them. Since their patentability is held to a higher standard and complexity, BM patents become indicators of patent value. Furthermore, since BM developments often accompany other technological innovations, Moehrle et al. (2018) argue that firms should consider the interaction between technological and BM patents during the formative stages of patentability.
Despite a series of debates and the distinctive rise of e-businesses that led to the sanctioning of BM patents (Hunt, 2010), the rise of BM patents is due to fundamental technological and industrial changes that transformed business areas into branches of engineering (Duffy, 2011). For BM patenting, all serial processes of a business function must be realized digitally, including those involving human cognitive decisions (Chen and Chang, 2021; Wu, 2005). Some patents that were designed to solve technical problems through software also became regarded as BM patents (Rai and Jagannathan, 2012). Moreover, BM patents tend to address either computer-, software-, or Internet-implemented BMs; subsequently, e-commerce activities became the key technological field studied using BM patents (Altuntas and Sezer, 2021). In terms of patent utility, Kimmel et al. (2017) discovered that investors in the late-1990s believed that BM patents would enable patentability in financial services and other service sectors. With digital transformation, the BM class patents evolved into financial technologies, which are found to improve profitability in the industry (Chen and Chang, 2021). By linking the BM patent class with service-related sectors, BM-related innovation expanded into ICT-based business activities beyond e-commerce into capital market, finance, and insurance (Mun et al., 2019).
From this perspective, past studies are still split on whether or not BM patents effectively induce new innovations. Hunt (2010) expressed scepticism regarding whether BM patents create value for the U.S. economy. More fundamentally, the intrinsic value of BM patents provide information enabling the identification of new opportunities for technology-driven services beyond simple business opportunities (Feng et al., 2021; Lee et al., 2016). The BM patent characterizes knowledge reflecting a vast amount of information about real-world technology-driven services that are identified as technological opportunities (Kim and Lee, 2020; Lee and Sohn, 2017).
Considering differentiated types of knowledge bases, past studies highlight the importance of analytical types of innovation (Asheim et al., 2011; Kang et al., 2022) or knowledge (Nonaka and von Krogh, 2009), which are captured through intellectual property rights, i.e. patents. Thus, since they classify the types of technologies through the CPC, patents chronicle the process in which knowledge types that are (re)combined for commercialization purposes. This study divides BM patents as dominant and spark technologies in the knowledge space.
2.2 Technology development from the recombination perspective
Early studies on spatial diffusion of innovation were developed into economic geography studies on geographical agglomerations of resources and knowledge-based firms (Feldman, 1994). By considering the recombination of various existing knowledge domains (Nelson and Winter, 1977) through of geographically proximate spill-over (Feldman et al., 2015; Kogler and Kim, 2021; Kogler et al., 2022; Whittle and Kogler, 2020), the evolutionary economics perspective has been applied to explore technological development, industry specialization, and the evolution of innovation clusters based on economic geography to explain how regions, industries, or technologies emerge and spatially aggregate (Boschma and Frenken, 2010; Boschma and Martin, 2010). In this regard, evolutionary economic geography offers a theoretical framework to examine how regions specialize in new technologies that emerge from the private assets and capabilities of economic agents and their partners, the maturity of the industry, and geographical clusters (Feldman et al., 2015; Kogler, 2015). In evolutionary economic geography, one of three proximities – spatial, social, or cognitive – have been used to explain adoption of new technologies in regions (Boschma, 2005; Boschma and Frenken, 2010; Feldman et al., 2015; Huber, 2012).
Differences in spatial variation still remain significant and determine knowledge creation and competitive advantage (Feldman and Kogler, 2010). Firms and industries benefit from knowledge spill-over depending on their location. In this regard, spatial or geographical proximity indicates the accessibility of resources needed to develop new technologies (Sonn and Storper, 2008). Moreover, geographical clusters can be regarded as the spatial analogue of firms’ strategic partnerships driven by common needs and goals (Feldman et al., 2015). Local economic actors form knowledge clusters in which knowledge flows and diffusion are likely to occur (Gertler, 2003). In addition to the social relationships of direct face-to-face contact, spatial proximity increases the knowledge flow indirectly by reinforcing other forms of proximity within the localized clusters of economic actors (Feldman et al., 2015; Kogler, 2015). Since social relationships of regional knowledge bases across spatial heterogeneity, adoption of knowledge through recombination depends on spatial, social, and cognitive proximity (Breschi and Lissoni, 2009).
Social proximity through collaboration relies on interpersonal relationships between individual actors (Boschma, 2005). Whether between individuals, firms, aggregate industries, or regions, collaboration is a determinant in successful innovation (Broekel, 2012) and developing competitive advantage (Ahammad et al., 2016). Collaborative activities allow individual actors to reduce uncertainty by sharing the risk and cost of developing new technologies (Cassiman and Veugelers, 2002). Moreover, when independent individuals conduct joint research, a variety of sources and complementary knowledge become available, creating synergy (Ivanova et al., 2019; Van Beers and Zand, 2014). In this regard, the spatial and social proximity influences access to knowledge creation through short social chains of localized actors based on the regional knowledge recombination perspective (Agrawal et al., 2008).
Cognitive proximity – the focus of this paper – refers to the strength of a common knowledge structure. Technological evolution is founded in the knowledge base (Malerba, 2000), which describes a set of knowledge related to the technological target of interest. Technology evolves through a knowledge-accumulation process that expands with new knowledge in a specific arena (Malerba and Orsenigo, 1996). This recombination drives dynamic changes in knowledge spaces and contributes to the creation of new products and superior economic growth (Weitzman, 1996, 1998).
The concept of cognitive proximity of technological components is extended to form spatial frameworks (Kogler et al., 2013; Rigby, 2015). From this perspective, cognitive proximity is used to explain how the regional knowledge space evolves and how new inventions depend on the cognitive proximity of technologies possessed in a region. The cognitive proximity evolves into a concept of relatedness that can identify cognitive distance in terms of technology and knowledge, supporting the growth of complex activities in which similar interacting activities rely on specialized combinations of complementary knowledge (Balland et al., 2020; Boschma, 2014; Davies and Maré, 2021). By extending the relatedness from a spatial perspective, the concept of relatedness density was developed to determine the relatedness between new and disappearing technologies and the existing structure of technological knowledge space at the regional level (Boschma, 2014; Neffke et al., 2011; Rigby, 2015). According to Balland et al. (2019) high relatedness density of a potential new technology among all technologies within the technology space of a region, signifies the presence of many technological capabilities for developing that technology in the region. When the relatedness density is relatively low, this implies that the regional technological capabilities to develop new technology domain are underdeveloped. From a knowledge recombination perspective, the relatedness density allows us to explain the technological trajectory to develop new technological possibilities within a region depending on the complexity and technological relatedness of knowledge bases (Boschma et al., 2015; Rigby et al., 2022). In addition, relatedness is relevant to regional innovation policies that aim to boost growth by focusing on regional strengths for specialization/diversification (Balland et al., 2019; Pintar and Scherngell, 2020).
Cognitive proximity focuses on the relatedness of regionally agglomerated knowledge, which mainly determines whether the relatedness of regional knowledge matters for knowledge diffusion (Feldman et al., 2015) or for specialization (Balland et al., 2015). While high overall knowledge or average relatedness in a region is generally favourable for new knowledge that leads to invention (Kogler et al., 2013, 2017), different forms of knowledge may be required for innovation-driven economic performance (Kang et al., 2022). Cognitive proximity in this context is more appropriate in discussing the regional adoption of new technologies. First, it does not only consider the knowledge space’s overall structure but also provides a technological observation of specific spaces (Feldman et al., 2015; Kalthaus, 2020). Second, it allows us to capture the convergence that occurs around a new technology (Hacklin et al., 2009; Moaniba et al., 2018). One valuable aspect of knowledge recombination is that it creates new inventions with multiple – rather than single – technological components. Cognitive proximity also can capture the potential value of convergence from a targeted technology to explain whether the advantage in this convergence leads to new inventions.
However, the literature rarely defines conditions to recombine technologies for new inventions. In regional studies, cognitive proximity has indicated the scale of specialized technologies but has not conveyed which kind of technology is important in adopting new technologies. This topic, to the best of our knowledge, is undiscussed from the knowledge-recombination perspective. Generally, the previous studies on relatedness density focused on regions regarded to have favourable contexts (e.g., large-city or metropolitan regions) for generating new inventions with an increased probability of incremental innovations (Davies and Maré, 2021; Fitjar and Timmermans, 2017; Galetti et al., 2021). However, this study starts with the question of whether it would necessarily be the case for the development of specialized technologies. In this regard, the following section examines the spatial innovation of BM class and develops new cognitive proximity measures that address the types of technologies – dominant or spark – needed to adopt new technology in a metropolitan or non-metropolitan region.
Recent research has also introduced more refined approaches to measuring knowledge recombination and novelty. For example, Nan (2024) shows that multidimensional forms of proximity – technological, geographical, organizational – and the structure of the knowledge base (e.g., decomposability and centrality) have distinct effects on recombination innovation at the collaborative dyad level. This work emphasizes that proximity is not uniformly beneficial but contingent on the configuration of knowledge networks, a finding that resonates with our distinction between dominant and spark technologies. Similarly, Gao and Lazarova (2024) propose the Knowledge Origin Re-Combination Index (KORCI), which simultaneously captures the recombination of existing technological components and the introduction of novel ones. Applying this measure to AI, computer technology, and pharmaceuticals, they reveal cyclical patterns of technological novelty across sectors, thereby offering a methodological framework that complements our BM-specific measures of recombination.
To synthesize prior contributions, Table 1 provides an overview of key studies on cognitive proximity, relatedness, and recombination. By juxtaposing older foundational works (e.g., Boschma, 2005; Feldman et al., 2015; Kogler et al., 2017; Balland et al., 2019) with recent methodological advancements (Nan, 2024; Gao and Lazarova, 2024), the table clarifies both continuity and novelty in this research stream. Our study builds on this trajectory by introducing BM patents as an empirical domain, distinguishing between dominant and spark technologies, and applying these concepts within a regional innovation framework.
3. Data and research model
3.1 Data
For empirical analysis, EPO PATSTAT is used. This patent database provides extensive information regarding patent information including patent application, publication, inventor, technology classification, citation, and address. Among all, the inventor address enables the unit of analysis in this study to be defined at the regional level. Due to this fact, the address information from the PATSTAT was geo-coded to the European regional level to update and improve the existing ones (Kedron et al., 2020). In addition to this, only granted patents were used for the empirical analysis. Previous studies have already pointed out that only the small number of BM patents are granted (Karvonen and Kässi, 2013; Wagner, 2008) because of the difficulty of patenting business method. Knowing this fact, considering only the granted patents can help us to avoid the overestimation of BM patenting.
In this sense, our investigation identifies the key factors for creating BM patents from a knowledge recombination perspective at the regional level. For this purpose, the new approach further elaborates the evolution of knowledge combination by considering the correspondence between knowledge sources available in a region but specified on BM patents. In our study, BM patents are defined by the CPC subclass “G06Q – systems or methods that involve significant data processing operations”. Furthermore, with focus on the knowledge recombination aspect of BM patents, the technological knowledge of BM patents is divided into two categories: BM class (“G06Q” subclass) and BM-related classes (subclasses in patents that feature the subclass, “G06Q”).
In sum, two different patent sets obtained from the updated patent database are used: BM and overall patent sets. This study defines the BM patent as any patent-containing BM and related technology components. Earlier studies demonstrated that the classification of BM was a key issue (Chang et al., 2009; Wagner, 2008) because no such classification types strictly demarcated BM. In patent systems, the simplest way to classify the technological area of invention involves using patent classification rules, such as international patent classification (IPC) or CPC. This practical problem has been solved nearly since the 8th revision of the IPC announced a new class, G06Q, in 2006, which contains applications regarding the BM. Following this rule for classification, the BM patent set contains any patents including the “G06Q” IPC sub-class (hereafter it is defined as BM technology), and overall patent set includes all patents including BM patents. In our version of PATSTAT published in 2019, all older IPC symbols are reclassified to the latest IPC 8 version; thus, patents invented before 2006 can also be incorporated. In the overall and BM patent sets, all patents and BM patents granted, respectively, in Europe between 1981 and 2015 are included.
Prior to the data analysis, the following data preparation steps were conducted. First, we avoid double-counting multiple IPC subclasses assigned to a single patent by measuring the proportion of IPC subclassifications at the 4-digit level assigned to each patent. In a similar sense, inventor share is measured with the inventors’ NUTS information to geo-locate the technology (Lee et al., 2016). For instance, if patents were invented by three different inventors from the three different regions, all three regions will equally share the values (1 / 3). A patent’s geo-location is determined by its NUTS-3 classification and metropolitan concordance table; thus, patents with missing NUTS codes or with lower than NUTS-3 codes are excluded.
In sum, our final data set includes 878,084 granted patents, which covers 1,135 regions from 33 European countries [1], including 273 metropolitan regions and 862 NUTS-3 regions. This includes 2,375 BM-granted patents from 453 regions, 181 metropolitan regions and 272 NUTS-3 regions. Table 2 presents the summary of BM patents changing over the time periods. As shown, the number of BM patents and regions producing them increased from 1996 to 2000 and decreased afterwards.
3.2 Overall knowledge space and BM knowledge space
The knowledge space is an IPC co-occurrence network built from patent and IPC relationships that addresses a certain technology’s value in creating new inventions. This study constructs two knowledge spaces (the overall and BM knowledge spaces) with a five-year window [2]. The overall knowledge space was created using a full list of patents and their subclass IPCs, while the BM knowledge space was created by using BM patents and their subclass IPCs. Thus, the BM knowledge space is a subset of the overall knowledge space, which only includes BM patents.
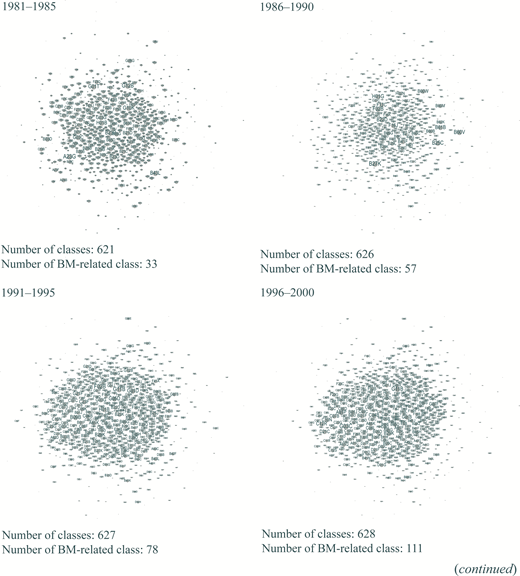
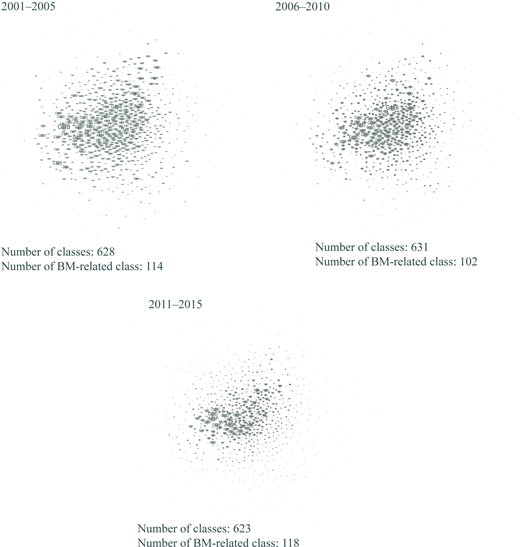
Figure 1 illustrates the evolution of both knowledge spaces; this also uses different colours to present the overall knowledge space and its centrality measures, distinguishing BM and BM-related technologies (green) and the rest (pink). The node size indicates that a certain technology is more frequently used with other technologies. From this, we can observe how BM and BM-related classes have been developed within the overall knowledge space. Initially, BM and BM-related classes were widely distributed, and most of them were located far from the centre of the network. This means that the development of BM was not active and only a few technologies were used for BM invention. Starting from the 1990s, BM patents began to be developed with more diverse technologies, including centrally located technologies, which reveals that BM classes gained greater opportunities for development with other technologies. This indicates that BM became a technology recognized with potential value, with greater fields of application. At the same time, some of BM-related classes were either isolated from the centre or less frequently used with other technologies. These technologies are more narrowly applicable than the centred ones. In other words, if these technologies are used more frequently used with BM patent, we can consider them as important technologies for BM innovation.
Referring to this observation, the following section introduces the new cognitive proximity indicators capturing these two knowledge recombinant features, and the measuring methods.
3.3 New cognitive proximity: Dominant technology and spark technology
From the knowledge recombination process of BM and BM-related classes, two technological types could be found. First, there are technologies that are widely used also in overall patenting activity. As observed from the knowledge space’s evolution, some BM-related classes are centrally located in the overall knowledge space, showing that they are also largely used in other (non-BM) inventions. The fact that they are already frequently used for other inventions indicates that they are complementarily applicable with different classes and easy to implement. This implies that such BM-related classes exhibit a greater value for further BM invention as they have potential to be recombined with other classes. In this study, these classes are defined as “dominant technologies” as they are being used dominantly across overall patenting activities. Second, there are inventions that are mainly developed for BM. Among BM-related subclasses, some of them are mainly used with BM class but not with others. For instance, if a technology class is used only with BM class, we may assume that it is technologically bounded to the BM class. Such BM-related classes are complementary to BM classes; thus, they have a significant value for the development of the relevant classes. Here, they are defined as “spark technologies” as they are being used mainly in BM invention.
Regarding this, the new measures that can capture the new aspects of cognitive proximity are introduced. Prior to the main calculation, we measured the weighted degree centrality (hereafter, WDEG) of the overall knowledge space (hereafter, the “overall_WDEG”) and of the BM knowledge space (hereafter, the “BM_WDEG”). The WDEG is a well-known network centrality index that adds the total weights assigned to the nodes’ connected edges. From a knowledge recombinant perspective, WDEG tells us how frequently a certain class has been used in patenting activity. For instance, a greater WDEG indicates that the class is used with a greater number of classes with stronger ties. In this respect, we manipulate WDEG values from overall and BM knowledge space to capture the level of “dominance” and “spark”.
The first measure, the dominance of BM-related class i at time t, is calculated by dividing class i’s overall_WDEG by the maximum overall_WDEG [equation (1)]. In the knowledge space, a technology more frequently used with others has a greater importance or greater centrality values than that is not. For instance, if a BM-related class is already widely used with diverse technologies, it is more likely to be used with any other technologies. In this regard, greater dominance value of BM-related class indicates that it is connected with higher number of technology classes in the overall knowledge space. This indicator, thus, allows us to find which BM-related class has greater potential of knowledge recombination in a general sense. Thus, if a BM-related class has a greater value of dominance, we may anticipate that such technology classes will have not only a greater potential for use with other technologies, but also a greater opportunity to extend their technological scope:
The second measure, the spark of BM-related class i at time t, is calculated by dividing the BM_WDEG by the overall_WDEG [equation (2)]. This measure represents the proportion of BM-related classes within the overall knowledge space; in other words, it shows the BM-related class’s level of contribution in creating new inventions. For instance, if a BM-related class has a spark value of 0.5, then it means that 50% of its development has been primarily developed with parts involving BM class. Thus, a technology class with the greater spark value can be regarded as one that mainly developed by BM knowledge:
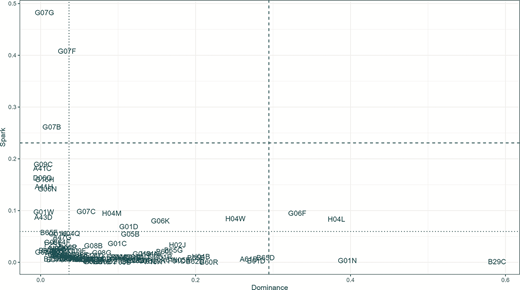
In sum, these two measures allow us to find the list of BM-related classes that are either dominantly used in a general perspective or those mainly developed by the BM class. Figure 2 illustrates the position of BM-related classes in the dimension of dominance and spark from 2011 to 2015 to show the relationship and general tendency between these two measures. As shown, some BM-related classes are positioned as outperforming outliers compared to the rest in the dominance (such as B29C and G01N) and spark values (such as G07G and G07F). This indicates not only a general pattern of skewness for knowledge creation, but also the fact that there are no overlapped cases, meaning no BM-related classes show high values in both measures.
Thus, BM-related classes that their either dominance or spark value are comparatively higher than others can be found. To distinguish such outperforming cases, thresholds are set up for each. In case of dominance, dominant class is defined by those with a BM-related class above 50% of its maximum value. For instance, in case of Figure 2, BM-related classes with dominance value greater than 0.29 (which is the 50% of its maximum) are regarded as the dominant class. In other words, they can be considered technology classes with a greater possibility of use with other classes to create new inventions. Under this assumption, DT of a region r at period t is measured by counting the number of patents consisting of dominant classes [equation (3)]:
Similarly, spark technology is classified by BM-related class above 50% of the maximum value of spark for the following reasons: First, the proportion of spark BM class is less than 1%, which makes it unlikely that there any classes above 0.5 [3]. Second, our observation indicates the average spark value is approximately 0.05, but the majority of classes fail to reach this threshold. Technology classes within our sample that surpass 50% are considered spark technologies, and those within the absolute range encompass 20% of overall development. Therefore, ST of a region r at period t is measured by counting the number of patents consist of spark classes [equation (4)]:
Table 3 presents the list of dominant and spark technology classes in each period. As shown, the threshold value and the lists of dominant and spark classes change over time. Although it is possible that both classes are used in a single patent, such cases are found to be less than 1%. This aligns with our finding from Figure 2 that none of the technology classes show high values of both measures, and more importantly, tells us that dominant and spark classes are more likely to be used separately and represent different knowledge recombination aspects.
3.4 Variables
3.4.1 Dependent variables.
The main interest of this study is to find out the factors contributing to the creation of BM patent at the technology-region-time level. In this regard, the number of BM patent developed in each region at a given period, BM patent (BM), is used as the dependent variable.
3.4.2 Independent variables.
For independent variables, the new regional-level variables called DT and ST are measured based on the dominance and spark values measured for each BM-related class. For calculation, the summation of share of listed classes in Table 3 is used for each region and period. To recap, dominant class includes the list of BM-related classes that play an important role in general patenting activity. In this respect, DT implies the amount of potential BM-related classes for BM patenting activity that each region has in each period. In the case of spark classes, it refers to the list of BM-related classes that are mainly developed with BM, in other words, that are important in relevant BM patenting activities. In a similar sense, ST refers to the size of essential BM-related classes for BM patenting activity in each region and period. Since this approach may cause endogenous changes of both measures over time, the accumulated value is used.
3.4.3 Control variables.
This study controls for several other covariates that likely influence the spatial innovation of BM patent. To control the technological aspects of each region, three technology-related variables are included: relatedness density, technological coherence, and revealed technological advantage of BM. First, relatedness density measure demonstrates the extent to which the technology produced within each region clusters around a technological field. Following the approach of Hidalgo et al. (2007) and Boschma et al. (2015), the relatedness density (RD) around given technology i in region r at time t is measured. Equation (5) divides the technological relatedness (of technology i by all other technologies j available in region r at time t by the sum of the technological relatedness of technology i to all other technologies j available in the reference region – or specifically, the European Union in this instance – at time t. The technological relatedness between each pair of technologies in this case is measured for each period’s knowledge space by calculating the frequency of the two technologies appearing in the same patent (Boschma et al., 2015; Rigby, 2015). This variable is aggregated to a regional level by taking the average for each region r at period t (equation (6)):
Technological coherence (TC) is included to consider the degree of regional diversification of a region’s patenting activities. A region’s technological coherence lowers the barrier for novel innovation and exploitation (Frenken et al., 2007). Following Rocchetta and Mina (2019), TC is measured as follows:
where WAR indicates the weighted average relatedness, and the second part indicates the average number of patents available in region r. This measure evaluates each region’s degree of technological diversification by considering the patenting activities covering diverse technological classes as weighted by technological proximity.
The revealed technological advantage (RTA) provides information on each region’s advancement in each technology by comparing the share of technology in the region’s technological production with the average share of that technology in the reference region, as noted in equation (8). If the RTA is greater than one, then a region’s technology is specialized in comparison with the same technology in other European regions. Therefore, the RTA in this study demonstrates whether the BM class in region r at time t has a competitive advantage compared to other regions. This allows us to capture the difference in the level of BM class already available in a region. In our model, logarithm of BM class’s RTA is used:
In addition, region specific socio-economic variables are included. The GDP per capita, GDP.pct, is added to consider the heterogeneous economic conditions among regions. Since patenting activity is mostly concentrated in knowledge-intensive sectors, the logarithms of manufacturing employment, Manuf.emp, is included. Overall, Table 4 summarizes the overall descriptions of the variables used in this study.
4. Methods
For empirical analysis, a fixed-effects negative binomial regression analysis is used. To assess over-dispersion in our data, we calculated the Pearson dispersion statistic (Pearson chi-square divided by degrees of freedom), which ranges from 1.78–2.16 across our models. Since these values are clearly greater than 1, this provides evidence of over-dispersion. Under such conditions, the standard Poisson or Poisson-GLM would underestimate standard errors and potentially bias inference. The fixed-effects negative binomial specification is therefore more appropriate, as it not only corrects for over-dispersion but also controls for unobserved, time-invariant regional characteristics that may otherwise confound the results. In our model, all time-varying independent variables are lagged by one period to mitigate potential endogeneity. This approach is particularly suitable in our context because it reduces the risk of simultaneity bias: BM patenting activity in period t cannot contemporaneously affect the explanatory variables when these are measured at t–1. By temporally separating the explanatory variables from the outcome, the lagged specification ensures a clearer causal ordering, a strategy widely employed in empirical studies of patents and regional innovation. All specifications are estimated at the region-time level, which includes metropolitan and non-metropolitan (NUTS-3) regions, and time refers to the specific five-year period. Although NUTS-3 regional level is a legally formulated classification, some NUTS-3 regions are often regarded as one because they are closely related to each other. In this regard, using aggregated regional level of metropolitan and non-metropolitan regions can account for possible spatial autocorrelation in our data (Giudici et al., 2019).
5. Results
5.1 Descriptive statistics
Table 5 presents the descriptive statistics and correlation matrix between variables. On average, regions have more than one patent containing ST and around 32 patents with DT. Considering the meaning of dominant class, a greater number of DT than that of ST makes sense as they include more frequently used BM-related classes. Similarly, a comparably low number of ST is expected due to the higher difficulty of inventing BM. The correlation levels are low except between the DT and ST. Although these two variables refer to different lists of technologies with different criteria, a high correlation between them may cause an unexpected problem; thus, the model is estimated separately for each and both.
5.2 Regression analysis
Table 6 reports the results of the overall sample (Columns 1 through 3), Metropolitan sample (Columns 4), and NUTS-3 sample (Columns 5). As previously mentioned, DT and ST are estimated in separate models to avoid multicollinearity; however, our results demonstrate that the results are consistent even when used together in the same model. The estimator of control variables indicates consistent, reasonable results. Positive and significant coefficients of ARD aligns with the existing literature; a region with greater relatedness to specialized technologies indicates a greater potential for the invention in a general knowledge recombination perspective. Further, the coefficient of TC is reported to be positive and significant, and thus, greater regional specialization by considering a region’s patenting activities provides better conditions for new innovation activities. Interestingly, the RTA exhibits negative, significant effects on the creation of BM patents, which reveals that the regions with above-average levels of BM class are likely to produce less in the following period. In case of region-specific economic indicators, the coefficients of both GDP.pct and EMP.ind turn out to be insignificant. In addition, the sectoral employment ratios show heterogeneous effects on BM patenting. The coefficient of Emp.svc.ratio is positive and significant in most specifications, indicating that service-oriented regions are more conducive to BM patent creation. In contrast, both Emp.agr.ratio and Emp.cst.ratio are negative and significant, suggesting that regions with higher reliance on agriculture or construction exhibit lower levels of BM patenting. These results highlight that while service-based economies provide fertile ground for developing new business models, agriculture- or construction-heavy regions tend to lag in BM-related innovation activities.
In the case of our explanatory variables, DT shows a positive, statistically significant coefficient; thus, regions with more dominant classes used with BM patents are more likely to create new BM patents. Also, ST exhibits positive and statistically significant effects. This indicates that a region’s greater number of spark classes related to BM class induces the invention of new BM patents. When DT and ST are estimated together in the same model, the same results are observed. To recall, DT is the one with greater potential and usability in the general knowledge-recombination process, and ST is the one that is more focused on BM. From a region’s knowledge recombination perspective, this result highlights the importance of dominant and spark classes that are being used with BM class for developing BM patents.
However, when the estimation is made separately for the Metropolitan and non-Metropolitan regions, different effects are observed. In case of Metropolitan regions, both DT and ST show the same positive and significant effects. In non-Metropolitan regions, however, only DT cause a positive and significant effect while the coefficient of ST is not statistically significant. This can be understood with the difference between Metropolitan and non-Metropolitan regions where the former has relatively rich technological resources and innovation-friendly environments than the latter. Compared to DT, ST is unlikely to be developed without BM. Considering the difficulty of developing BM, this reminds us that there may be a very few or no ST in a region while DT is more applicable besides BM. From this aspect, we may assume that developing DT is better to be prioritized to ST. In addition, the insignificant effect of ST in non-Metropolitan regions further suggests that ST require a more advanced BM environment and complementary innovation resources to generate an impact. While Metropolitan areas provide such conditions, non-Metropolitan regions often lack institutional support, skilled labour, and market opportunities necessary for BM-driven innovations, especially when they are digital transformation-related. In contrast, DT has broader applicability and can yield positive effects even in resource-constrained contexts, which explains why only DT remains significant outside Metropolitan regions.
5.3 Robustness check
To examine the sensitivity of our findings to the threshold for dominance classification, we applied alternative cut-offs of 40% and 60%. The 40% threshold yields the same set of dominant and leading technologies as the baseline (50%), resulting in identical regression outcomes. The 60% threshold alters the composition of dominant technologies, while the set of leading technologies remains unchanged. The regression results under the 60% threshold remain robust and consistent with our main specification. Additional regression results under the 60% threshold are reported in Appendix 1. For brevity, only the 60% threshold results are reported in Appendix 2.
In addition, we use the average dominance and spark values to check that our two explanatory variables are objective (see Table 7). As DT and ST calculate the number of patents containing specific BM-related classes that satisfy our given threshold, the measured value might be influenced by this threshold, which leaves the possibility of arbitrary manipulation. Instead of using DT and ST, we measure each region’s average DT and ST values to avoid any arbitrary exclusion of certain values. The results confirm our findings, in that both DT and ST positively influence a region’s adoption of new BM invention.
In addition, we re-estimated our models by including both region and time fixed effects (Table 8). This specification allows us to control not only for unobserved, time-invariant regional heterogeneity but also for common temporal shocks that may simultaneously affect all regions. The results are largely consistent with our main specification. In particular, DT remains positive and significant, confirming its role as a region-specific driver of BM patenting activity. By contrast, ST loses statistical significance once time fixed effects are introduced. This result is consistent with the conceptual definition of ST, which measures the proportion of BM-related classes within the overall knowledge space – that is, the contribution of BM-related classes to new inventions. Because this contribution tends to evolve in line with broad technological shifts (e.g., the diffusion of BM-related technologies across periods), its effect is largely absorbed by the time fixed effects. This indicates that the contribution of ST is more closely linked to specific temporal or metropolitan innovation environments rather than representing a consistent driver across all regions and periods.
Taking together, these robustness results reinforce our main conclusion: DT operates as a distinct, region-specific determinant of BM patenting, while ST reflects broader temporal patterns that are common across regions. This distinction provides a nuanced understanding of how different technological factors shape BM innovation at both regional and temporal dimensions.
6. Conclusion
The rise of e-commerce and platform businesses has drawn the attention of both researchers and developers of BM patents. While previous studies have focused on the importance and value of BM patents, this study examines how knowledge recombination factors influence the creation of BM patents at the regional level. To this end, new indicators are introduced that capture the unique features of BM patents and address the limitations of existing approaches to studying knowledge recombination.
With the new measures, specific types of BM-related classes that are more beneficial in creating the new BM patent in a region are found, confirming their significant contribution to new BM patenting activity. Our results highlight a nuanced pattern: DT consistently foster BM patenting regardless of model specification, while the effect of STs appears more context dependent. STs matter under region fixed-effects specifications – particularly in metropolitan regions with rich innovation environments – but their influence diminishes once common temporal shocks are fully accounted for. This suggests that STs are not universal drivers of BM innovation but operate under specific regional or temporal conditions.
From a theoretical perspective, this study advances the discussion in evolutionary economic geography by reframing proximity through the concept of knowledge recombination. Previous research has highlighted the role of cognitive proximity in facilitating new inventions (Feldman et al., 2015), and many studies have explained innovation potential using cognitive proximity or relatedness density (Boschma, 2005; Kogler et al., 2017; Balland et al., 2019; Kang et al., 2022; Rigby et al., 2022; Nan, 2024; Gao and Lazarova, 2024). This study, however, disaggregates proximity into two technological forms: DT and ST. DT represent general-purpose, widely recombinable technologies, while ST function as BM-specific and context-dependent resources. This distinction provides a new lens for understanding the differentiated roles of technologies in the knowledge space and offers empirical evidence that moves beyond the polarized debate on the value of BM patents.
From a methodological standpoint, this study extends the application of knowledge space through the integration of network indices. Previously, knowledge space has been used primarily to depict the structure of regional knowledge and its evolution (Kang et al., 2022; Kogler et al., 2017; Kogler et al., 2022). By applying these indices to both overall and BM-specific knowledge spaces, this study identifies DT and ST as distinct forms of knowledge recombination. This approach shifts the role of knowledge space from mapping broad technological structures to tracing the specific contributions of technology classes to BM patenting, thereby providing a more precise methodological framework for analysing innovation dynamics.
This study offers important implications for both firms and policymakers. Firms should design BM patenting strategies that reflect regional innovation contexts: those located in metropolitan areas can actively exploit ST to pursue BM-specific opportunities, while those in non-metropolitan regions are better positioned to build on DT, which provide broader applicability and recombination potential. At the same time, firms need to guard against excessive specialization in BM technologies, as our findings show that regions with above-average BM concentration tend to experience diminishing returns in subsequent patenting. From a policy perspective, governments should strengthen institutional, human, and market conditions that enable ST-driven innovation in metropolitan regions, while supporting non-metropolitan regions in expanding their general-purpose technological capabilities through DT. The negative effect of RTA further suggests that policies should promote diversification rather than narrow specialization, ensuring more resilient and sustainable regional innovation trajectories.
Nevertheless, this study has certain limitations. The data set used for the analysis mainly covers the period prior to 2015 and therefore does not fully capture the rapid expansion of the BM field in later stages of digital transformation. While this temporal scope still provides important insights into the formative stage of BM development, future research with more updated data would be valuable to examine whether the patterns identified here persist in more mature stages of BM innovation. In addition, the dependent variable counts all BM patents regardless of whether they are ultimately commercialized. Although not all patents lead to market applications, patenting itself reflects innovative efforts and strategic positioning. Future studies could extend our analysis by incorporating commercialization indicators such as patent renewal, licencing or transaction data to better capture the economic impact of BM patents. Moreover, BM patent data should be interpreted with caution because they are shaped not only by inventive activity but also by institutional and strategic considerations. In some jurisdictions, legal restrictions limit the scope or enforceability of BM patents, and firms may file such patents strategically as part of defensive or positioning practices rather than purely for innovation. These factors imply that BM patent counts may partly reflect institutional settings and strategic behaviour, which future research could better disentangle by combining patent data with complementary indicators such as litigation records or policy analyses. Finally, although the data set spans multiple countries, this study does not provide a detailed comparison across national contexts. Since institutional and policy differences may also shape BM patenting, future research could extend our framework to examine cross-country heterogeneity, offering comparative insights into how institutional contexts influence BM innovation.
Notes
Austria, Belgium, Bulgaria, Switzerland, Cyprus, Czech, Germany, Denmark, E235stonia, Greece, Spain, Finland, France, Croatia, Hungary, Ireland, IS, Italy, Liechtenstein, Lithuania, Luxembourg, Latvia, Malta, Netherland, Norway, Poland, Portugal, Romania, Sweden, Slovenia, Slovakia, Turkey, UK.
Period 1: 1981 to 1985; Period 2: 1986 to 1990; Period 3: 1991 to 1995; Period 4: 1996 to 2000; Period 5: 2001 to 2005; Period 6: 2006 to 2010; and Period 7: 2011 to 2015.
A value greater than 0.5 indicates that one of two inventions using those technologies are generated from the BM knowledge space. Only two technologies in our sample were greater than 0.5 in the period spanning 1996 to 2000 (G07G and G07F).
References
Appendix 1
Business method patent classification
G06Q: Data processing systems or methods specifically adapted for administrative, commercial, financial, managerial, supervisory, or forecasting purposes; or systems or methods specifically adapted for administrative, commercial, financial, managerial, supervisory or forecasting purposes that have not been otherwise provided for. (Source: Link to the cited article.)