
1-20 of 9690
Keywords: SOR
Close
Follow your search
Access your saved searches in your account
Would you like to receive an alert when new items match your search?
Journal

A forum for those in business and management modelling.
Journal Articles
Journal:
Journal of Modelling in Management
Journal of Modelling in Management 1–25.
Published: 07 October 2026
in Demystifying black-box machine learning in supply chain risk management: from prediction to intervention via explainable AI
> Journal of Modelling in Management
Published: 07 October 2026
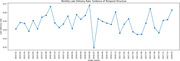
Figure 1. Monthly late-delivery rate showing temporal variation in the target variable across the observed order period A line graph tracks monthly late delivery rates from January 2015 to January 2018, fluctuating around 0.54 to 0.56 with a sharp drop in July 2016. The line graph plots late d... More about this image found in Monthly late-delivery rate showing temporal variation in the target variabl...
in Demystifying black-box machine learning in supply chain risk management: from prediction to intervention via explainable AI
> Journal of Modelling in Management
Published: 07 October 2026
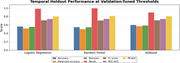
Figure 2. Temporal holdout performance using validation-tuned thresholds across classification and ranking metrics A grouped bar graph compares seven performance metrics for Logistic Regression, Random Forest and X G Boost, with recall highest for all three models. The grouped bar graph compar... More about this image found in Temporal holdout performance using validation-tuned thresholds across class...
in Demystifying black-box machine learning in supply chain risk management: from prediction to intervention via explainable AI
> Journal of Modelling in Management
Published: 07 October 2026
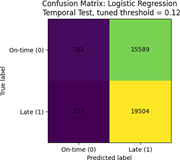
Figure 3. Confusion matrix for logistic regression on the temporal test set using the validation-tuned threshold. The tuned logistic regression threshold produces very high recall (0.9884) but low specificity (0.0478), indicating a substantial false-positive burden A confusion matrix for Logist... More about this image found in Confusion matrix for logistic regression on the temporal test set using the...
in Demystifying black-box machine learning in supply chain risk management: from prediction to intervention via explainable AI
> Journal of Modelling in Management
Published: 07 October 2026
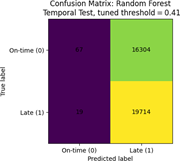
Figure 4. Confusion matrix for Random Forest on the temporal test set using the validation-tuned threshold. The tuned Random Forest threshold classifies nearly all orders as late (recall = 0.9990; specificity = 0.0041), limiting its operational usefulness at this setting A confusion matrix for ... More about this image found in Confusion matrix for Random Forest on the temporal test set using the valid...
in Demystifying black-box machine learning in supply chain risk management: from prediction to intervention via explainable AI
> Journal of Modelling in Management
Published: 07 October 2026
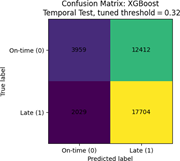
Figure 5. Confusion matrix for XGBoost on the temporal test set using the validation-tuned threshold. Tuned XGBoost retains greater separation than the other tuned models, although its recall gain is accompanied by lower specificity A confusion matrix for X G Boost at a tuned threshold of 0.32 ... More about this image found in Confusion matrix for XGBoost on the temporal test set using the validation-...
in Demystifying black-box machine learning in supply chain risk management: from prediction to intervention via explainable AI
> Journal of Modelling in Management
Published: 07 October 2026
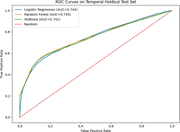
Figure 6. ROC curves for the three models on the temporal holdout test set A R O C curve graph compares Logistic Regression, Random Forest and X G Boost on a temporal holdout test set, with A U C values near 0.74. The R O C curve graph compares Logistic Regression, Random Forest and X G Boos... More about this image found in ROC curves for the three models on the temporal holdout test set A R O ...
in Demystifying black-box machine learning in supply chain risk management: from prediction to intervention via explainable AI
> Journal of Modelling in Management
Published: 07 October 2026
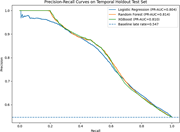
Figure 7. Precision-recall curves for the three models on the temporal holdout test set A precision-recall graph compares Logistic Regression, Random Forest and X G Boost on a temporal holdout test set, with P R A U C values around 0.81. The precision-recall graph compares Logistic Regression,... More about this image found in Precision-recall curves for the three models on the temporal holdout test s...
in Demystifying black-box machine learning in supply chain risk management: from prediction to intervention via explainable AI
> Journal of Modelling in Management
Published: 07 October 2026
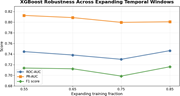
Figure 8. XGBoost robustness across expanding temporal training windows A line graph compares X G Boost robustness across four expanding training fractions using R O C A U C, P R A U C and F 1 score. The line graph plots Score against Expanding training fraction for X G Boost. The horizontal a... More about this image found in XGBoost robustness across expanding temporal training windows A line gra...
in Demystifying black-box machine learning in supply chain risk management: from prediction to intervention via explainable AI
> Journal of Modelling in Management
Published: 07 October 2026
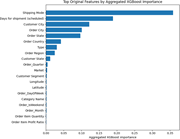
Figure 9. Top original features by aggregated XGBoost importance A horizontal bar graph ranks 20 original features by aggregated X G Boost importance, with Shipping Mode highest and scheduled shipment days second. The horizontal bar graph ranks 20 original features by Aggregated X G Boost Impo... More about this image found in Top original features by aggregated XGBoost importance A horizontal bar ...
in Demystifying black-box machine learning in supply chain risk management: from prediction to intervention via explainable AI
> Journal of Modelling in Management
Published: 07 October 2026
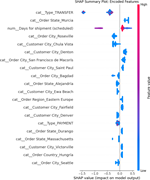
Figure 10. SHAP summary plot for encoded XGBoost features on a representative temporal test sample A SHAP summary plot compares encoded features by impact on model output, with Type TRANSFER and scheduled shipment days having the widest SHAP value ranges. The SHAP summary plot lists 20 encod... More about this image found in SHAP summary plot for encoded XGBoost features on a representative tempora...
in Demystifying black-box machine learning in supply chain risk management: from prediction to intervention via explainable AI
> Journal of Modelling in Management
Published: 07 October 2026
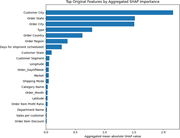
Figure 11. Aggregated SHAP importance mapped back to original feature groups A horizontal bar graph ranks 20 original features by aggregated mean absolute SHAP value, with Customer City highest, followed by Order State and Order City. The horizontal bar graph ranks 20 original features by ag... More about this image found in Aggregated SHAP importance mapped back to original feature groups A ho...
in Demystifying black-box machine learning in supply chain risk management: from prediction to intervention via explainable AI
> Journal of Modelling in Management
Published: 07 October 2026
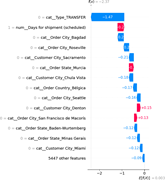
Figure 12. Local SHAP waterfall explanation for a high-risk sampled order with predicted late-delivery probability of 0.9941 A SHAP waterfall plot traces feature contributions from an expected model output of 0.003 to a final f of x value of negative 2.37. The SHAP waterfall plot traces cont... More about this image found in Local SHAP waterfall explanation for a high-risk sampled order with predi...
Journal Articles
Journal:
Journal of Modelling in Management
Journal of Modelling in Management 1–26.
Published: 30 September 2026
in Monetizing demand forecasts in an e-commerce supply chain: da-ta-product pricing and information-sharing strategies
> Journal of Modelling in Management
Published: 30 September 2026
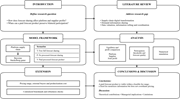
Figure 1. Research design Source: Author’s own work A flow diagram outlines research stages covering research questions, literature review, model framework, analysis, extension, and conclusions and discussion for forecast sharing. The flow diagram begins with Introduction, which defines two... More about this image found in Research design Source: Author’s own work A flow diagram outlines res...
in Monetizing demand forecasts in an e-commerce supply chain: da-ta-product pricing and information-sharing strategies
> Journal of Modelling in Management
Published: 30 September 2026
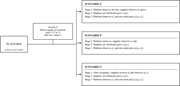
Figure 2. Decision sequence and decision variables Source: Author’s own work A flow diagram presents platform selection at stage zero followed by three scenarios, T, P and V, each with three sequential pricing stages. The flow diagram begins with Platform, identified as the scenario-choice ... More about this image found in Decision sequence and decision variables Source: Author’s own work A ...
in Monetizing demand forecasts in an e-commerce supply chain: da-ta-product pricing and information-sharing strategies
> Journal of Modelling in Management
Published: 30 September 2026
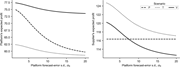
Figure 3. Expected profits versus the platform forecast-error standard deviation Source: Author’s own work Two line graphs compare platform and supplier expected profits across platform forecast-error standard deviation under scenarios P, T and V. The two line graphs share a horizontal axis... More about this image found in Expected profits versus the platform forecast-error standard deviation So...
in Monetizing demand forecasts in an e-commerce supply chain: da-ta-product pricing and information-sharing strategies
> Journal of Modelling in Management
Published: 30 September 2026
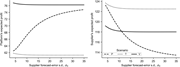
Figure 4. Expected profits versus the supplier forecast-error standard deviation Source: Author’s own work Two line graphs compare platform and supplier expected profits across supplier forecast-error standard deviation under scenarios P, T and V. The two line graphs share a horizontal axis... More about this image found in Expected profits versus the supplier forecast-error standard deviation So...
in Monetizing demand forecasts in an e-commerce supply chain: da-ta-product pricing and information-sharing strategies
> Journal of Modelling in Management
Published: 30 September 2026
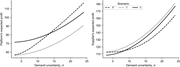
Figure 5. Expected profits versus demand uncertainty Source: Author’s own work Two line graphs compare platform and supplier expected profits as demand uncertainty increases under scenarios P, T and V. The two line graphs share a horizontal axis labelled Demand uncertainty, sigma, with labe... More about this image found in Expected profits versus demand uncertainty Source: Author’s own work ...

