Contribution by J. R. Martí-Vargas
An interesting study to determine a relationship between transmission length (Lt) and failure shear load (VEd) is presented (Elliott, 2014). The author should be complimented for producing a detailed paper, which proposes an equation for the ultimate shear capacity of prestressed hollow core slabs manufactured using long-line techniques. This is acknowledged by the discusser, who would like to offer some comments for consideration and response.
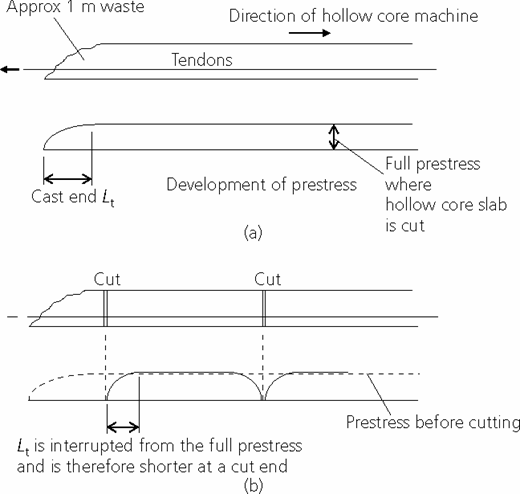
The author states that most past research has shown that Lt is longer at the end where the prestress is released at a cast end compared to the remote dead end, and also that, with hollow core units, prestress never develops at a ‘cast' end, but always at a ‘dead' end during cutting. However, it seems that this is the opposite to the test results obtained: as can be seen in Figures 8(a) and 8(b), the three tested precast T-beams clearly show Lt = 295 mm and 399 mm for the ‘cut' and ‘cast' ends, respectively, which is a main conclusion.
Experimental Lt was determined according to Figure 2. However, Figure 2 depicts a tendon stress profile plotted against distance from end, whereas Figures 6–8 depict concrete strain profiles plotted against distance from end. It is noteworthy that concrete strains are reflected with a certain retard compared to the build-up of prestress, which perhaps has not been noted by the author in order to determine Lt.
The strain gauges were located on the bottom surface along the length of each specimen at several distances, starting at 300 mm from the end. However, as observed in Figure 8(b), all the concrete strains seem to be within the constant strain plateau. Therefore, Lt may be shorter in these cases and strain gauges should be placed at shorter distances from the end for more accurate Lt determination.
The author states in the abstract that the ratio of Lt to the predicted length goes from 0·99 to 1·21 and that the ratio of Lt to the Eurocode 2 design value goes from 0·51 to 0·67. These ranges coincide with the data included in Table 2, which were obtained by averaging the Lt results for each unit type tested.
However, the discusser notes that these ranges vary considerably if one considers directly all the Lt results from Figures 24 and 25: 0·7 to 1·4 instead of 0·99 to 1·21, and 0·4 to 0·76 (0·8 is detailed in the ‘Conclusions' section) instead of 0·51 to 0·67. The same can be stated for VEd: according to Table 3 as the test/predicted ratio goes from 1·09 to 1·17 and the test/design ratio goes from 1·95 to 2·13, whereas the corresponding ranges are 0·9–1·3 and 1·7–2·6 from Figures 24 and 25, respectively.
Finally, the author provides the details that, even when Lt is up to 1·5 times its mean value, VEd/VU > 1 (Figure 24). However, Figure 24 does not cover beyond 1·4 and displays cases with VEd/VU < 1 for the Lt ratios of 1·15 and 1·3. Perhaps there are cases with no correspondence between Lt and the expected VEd, as in allowable free end slips with the corresponding Lt (Martí-Vargas et al., 2007; Martí-Vargas and Hale, 2013; Viula Faria et al., 2013), and the consideration of possible Lt changes with time (Caro et al., 2013) is suggested.
Authors' reply
The author would like to respond to all of the contributor's comments in turn. In response to the first two paragraphs (‘An interesting study…, which is a main conclusion.'), the results in Figure 8 confirm Lt is shorter in a ‘cut' end where the original prestress in the as-cast beams has been interrupted. This is also the case for hollow core slabs, where the development of prestress never takes place at a ‘cast' end, but always at a ‘cut' end, as shown in Figure 30.
In response to the third paragraph (‘Experimental Lt … in order to determine Lt.') in the contribution above, could the contributor please confirm the meaning of ‘a certain retard compared to the build-up of prestress' and is this significant? The difference between strain and stress in the tendons was not considered by the author.
In relation to the fourth paragraph (‘The strain gauges… accurate Lt determination.'), the author agrees; this was noticed after the experiments were concluded. It was not expected that almost the full strain plateau would be reached at 300 mm.
The author agrees with the comments in the fifth paragraph (‘The author states in the abstract… Figures 24 and 25, respectively.'), but it seemed reasonable to quote averages of six tests, and the reader can still see the scatter in the results.
The author agrees with the final paragraph of the contributor (‘Finally, the author provides… is suggested.') that the line of regression in Figure 24 shows Lt not more than 1·35 (not the 1·5 claimed in the paper). No slippage of wire was reported, as pull-in was not more than 1 mm, but that is not to say there was reduced prestress in some of the specimens.
The lone result where VEd/VU = 0·88 was the first X-beam test in the series with a shear failure load of 13·4 kN compared to 15·3 to 20·3 kN for the remainder, which could suggest an experimental explanation to that result. If the highest and lowest results in this set of eight tests are ignored, the mean value of VEd/VU remains 1·10.