
Contribution by Zeng and Mo
Measurements of moisture content for a series of concrete were conducted to analyse the impacts of water to cement (W/C) ratio and temperature on the moisture content–relative humidity (RH) curves (Jiang and Yuan, 2013). Based on the experimental results and the multi-layer molecules adsorption Brunauer-Emmett-Teller (BET) analysis, the authors proposed a three-parameter model to capture the relationship between moisture content, temperature and RH in concrete (Equation 7 in Jiang and Yuan, 2013)
where S is the pore water saturation, H is the RH in concrete, and λ1, λ2 and λ3 are the adjustable parameters. Through regression analysis, the authors obtained functions of λi = 1,2,3 to temperature and W/C ratio (Equations 7a–7c in Jiang and Yuan, 2013). Then the established model was verified by an independent water vapour sorption test. However, the physical meanings of Equation 8 have not been elucidated clearly. As a matter of fact, Equation 8 has an expression very similar to the Guggenheim-Andersen-Boer (GAB) model (Timmermann, 2003)
where Wm is the GAB monolayer capacity, C and K are respectively the energy constants related to the first monolayer's sorption energy and the further layers' sorption energy. As a matter of fact, the GAB model was developed from the BET model, and shares with it the two original BET constants (Wm and C). The only difference is that the GAB model introduces an extra term K based on the assumption that the sorption state of the sorbate molecules in the layers beyond the first is the same, but different to the pure liquid state (Timmermann, 2003; Pradas et al., 2004), see Figure 9 for mechanism illustration.
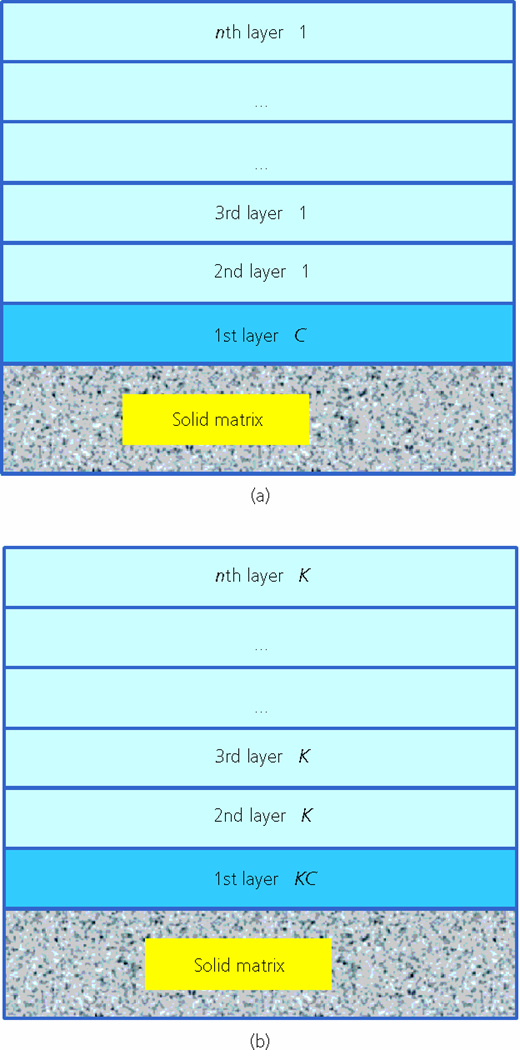
Schematic illustration of (a) the BET and (b) the GAB multilayer sorption mechanisms
Schematic illustration of (a) the BET and (b) the GAB multilayer sorption mechanisms
Comparing Equations 8 and 9, one can find that
Note that both the first monolayer sorption energy term C and the further layers' sorption energy term K are associated with temperature (Pradas et al., 2004)
where C0 and K0 are the pre-exponential coefficients, μ1 and μ2 are the energy (or chemical potential) of the adsorbate in the first adsorption layer and that of the pure sorbate in the saturated state respectively, μ0 is the energy in a reference state, R is the ideal gas constant and T is the Kelvin temperature. In fact, μ2–μ1 denotes the adsorption energy. Combining Equations 10 and 11, one obtains
From Equations 12b and 12c, one can also have
Fitting the values of λ1, λ2(= K) and λ3 obtained by Jiang and Yuan through Equations 12 and 13, one can obtain the quantities of the energy terms μ0–μ1, μ0–μ2 and μ2–μ1. Figures 10, 11 and 12 show the variation of λ1, λ2(= K) and C with temperature and the fitting curves for all the used three series of concrete. Results of water vapour sorption on quartz in Timmermann (2003) showed that both the K and C have much higher values than those in Jiang and Yuan (2013). Obviously, it can be found that all the fitting curves can capture the data in Jiang and Yuan (2013). Clearly, the parameter λ1 and the first monolayer sorption energy term C decrease and the parameter λ3 increases with increasing temperature, indicating that μ0–μ1 > 0, μ2–μ1 > 0 and μ0–μ2 < 0, or μ2 > μ0 > μ1. The values of μ2–μ1, μ0–μ1 and μ0–μ2 for concrete with different W/C ratios are displayed in Figure 13. Note that the values of μ2–μ1 (19–22 kJ/mol) extracted directly from Equation 13 are much lower than those of [(μ0–μ1)–(μ0–μ2)] (27–33kJ/mol) from Equations 12a and 12b, which is probably due to the suspected non-equilibrium data in Jiang and Yuan (2013). The values of the sorption energy (μ2–μ1) increase as the W/C ratio increases, probably because more porous CSH gels form for concrete with higher W/C ratio. However, the values of all the sorption energy terms for porous concrete are significantly lower than those for water vapour adsorption on other porous materials, such as silicate glass (Leed and Pantano, 2003), activated carbons (Muller et al., 1996), disordered mesoporous silica (Puibasset and Pellenq, 2005) and high-silica zeolites (Bolis et al., 2006). More importantly, the obtained values are even lower than the latent heat of liquefaction of water in the bulk phase (44 kJ/mol), implying that the adsorption would not occur spontaneously. This result could be misleading. Again, the tests by Jiang and Yuan conducted under the non-equilibrium condition may be a crucial reason to underestimate the adsorption energy. It is thus expected that, with the water vapour sorption test at sufficient equilibrium condition, the adsorption energy of water vapour in cement-based material can be evaluated appropriately.
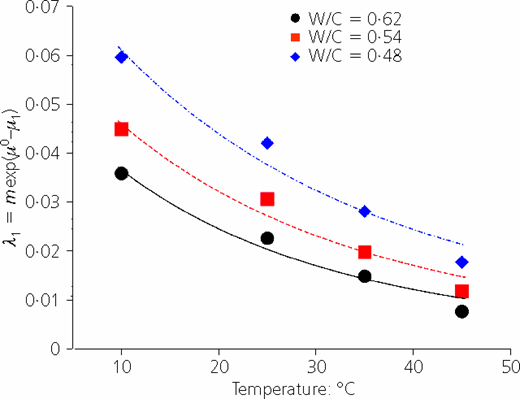
Variation of λ1 with temperature for concrete samples with different initial W/C ratios. Points represent data from Jiang and Yuan (2013) and lines are fitting curves by Equation 12a
Variation of λ1 with temperature for concrete samples with different initial W/C ratios. Points represent data from Jiang and Yuan (2013) and lines are fitting curves by Equation 12a
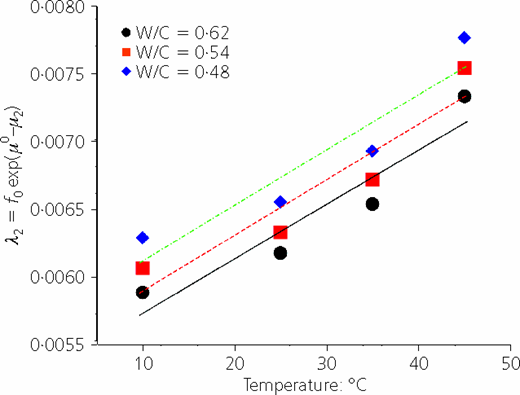
Variation of λ2 with temperature for concrete samples with different initial W/C ratios. Points represent data from Jiang and Yuan (2013) and lines are fitting curves by Equation 12b
Variation of λ2 with temperature for concrete samples with different initial W/C ratios. Points represent data from Jiang and Yuan (2013) and lines are fitting curves by Equation 12b
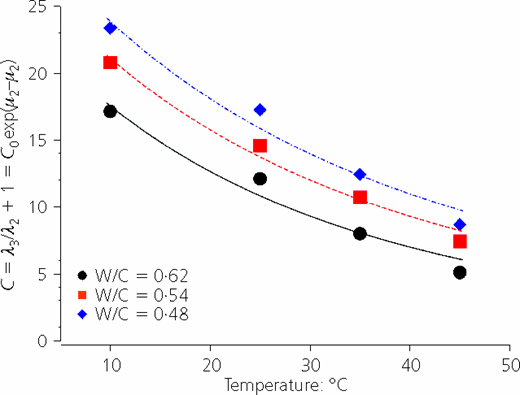
Variation of the monolayer sorption energy constant C with temperature for concrete samples with different initial W/C ratios. Points represent data from Jiang and Yuan (2013) and lines are fitting curves by Equation 13
Variation of the monolayer sorption energy constant C with temperature for concrete samples with different initial W/C ratios. Points represent data from Jiang and Yuan (2013) and lines are fitting curves by Equation 13
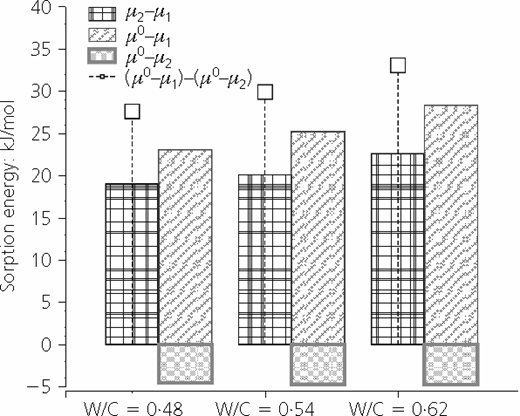
Sorption energy in terms of W/C ratio: (μ2–μ1) extracted from Equation 13, (μ0–μ1) and (μ0–μ2) from Equations 12a and 12b respectively
Sorption energy in terms of W/C ratio: (μ2–μ1) extracted from Equation 13, (μ0–μ1) and (μ0–μ2) from Equations 12a and 12b respectively
Authors' reply
This paper (Jiang and Yuan, 2013) aims to predict the moisture content of concrete under a natural climate environment, not to study the equilibrium moisture content of concrete under ambient relative humidity. The moisture content of concrete is in fluctuation owing to the effects of climatic factors in the natural environment, which is not an equilibrium condition. Therefore, the temperature and relative humidity presented in this paper are those in the concrete's micro-environment, not those in the climatic environment.
