Accurately predicting local scour around marine structures is vital for ensuring foundation stability and guiding effective protection measures. This study uses an Eulerian three-phase computational model that concurrently resolves sediment, water and air phases to simulate scour around a cofferdam under steady current forcing with an explicitly resolved free surface. The model incorporates advanced granular physics through a rheology, providing a realistic description of dense sediment behaviour and internal stresses. Numerical results are validated against cofferdam flume experiments, showing reasonable agreement in the time evolution of the maximum scour depth and in the development of the bed profiles. The simulations reproduce key scour features, including the formation of a localised scour hole and associated downstream deposition. The results demonstrate that three-phase, physics-based computational fluid dynamics can predict cofferdam scour evolution and support improved scour risk assessment and mitigation design in offshore and coastal engineering.
Notation
carrier-phase strain-rate tensor (s)
sediment-phase strain-rate tensor (s)
median grain size (m)
gravitational acceleration vector (m/s2)
still-water depth above the initial sand bed (m)
- I
inertial number
reference inertial number for rheology
- k
turbulent kinetic energy in the k- model (m2/s2)
interface curvature (1/m)
interphase momentum exchange term (N/m3)
unit normal at the air–water interface
carrier-phase pressure (Pa)
solids (particle) pressure (Pa)
maximum local scour depth (m)
- t
time (s)
air-phase velocity vector (m/s)
water-phase velocity vector (m/s)
carrier (air+water) phase velocity vector (m/s)
sediment-phase velocity vector (m/s)
imposed approach-current velocity magnitude (m/s)
streamwise component of sediment-phase velocity (m/s)
volume fraction of air
volume fraction of sediment
volume fraction of water
VOF indicator
sediment-phase shear rate (second invariant of ) (s)
bed-level change relative to the initial bed (m)
effective dynamic viscosity of sediment phase in the closure (Pas)
critical Shields parameter
swirl-strength criterion (s)
friction coefficient as function of inertial number
high-shear friction coefficient (granular rheology)
quasi-static friction coefficient (granular rheology)
effective (laminar+turbulent) dynamic viscosity of carrier phase (Pas)
kinematic viscosity of water (m2/s)
density of air (kg/m3)
density of water (kg/m3)
density of sediment particles (kg/m3)
local carrier-phase density (air+water mixture) (kg/m3)
surface tension coefficient (N/m)
bed shear stress (Pa)
critical shear stress (Pa)
deviatoric stress tensor of carrier phase (Pa)
deviatoric stress tensor of sediment phase (Pa)
sediment volume fraction ()
initial packed-bed sediment volume fraction
specific dissipation rate in the k- model (s)
1. Introduction
Scour – the erosion of sediment around structures driven by flowing water – poses a significant risk to infrastructure stability in riverine, coastal and offshore environments and can lead to serviceability loss or structural failure if not adequately accounted for in design (Melville and Coleman, 2000; Construction Industry Research and Information Association (CIRIA), 2015; Whitehouse, 1998). Accurate scour prediction is therefore essential for safe and economical engineering practice. However, scour development results from strongly coupled interactions between hydrodynamics, sediment properties and structural geometry, which makes reliable prediction challenging across a wide range of flow conditions and structure types (Fredsoe and Sumer, 2002; Whitehouse, 1998).
Empirical design approaches, such as those summarised by Fredsoe and Sumer (2002) and Construction Industry Research and Information Association (CIRIA) (2015), remain widely used due to their simplicity and ease of application. These methods typically derive empirical relationships between scour depth, structural geometry and driving hydrodynamic conditions from limited experimental datasets, which can reduce reliability when applied outside the original calibration range (Hoffmans, 2017; Whitehouse, 1998). Physical modelling in laboratory flumes has provided important insights into scour mechanisms, but interpretation and extrapolation are often affected by scale effects, measurement uncertainty and the cost of long-duration experiments (Ettema et al., 1998; Huang et al., 2009; Lee and Sturm, 2009; Wang et al., 2021).
Advances in computational resources have enabled numerical approaches with varying levels of modelling fidelity. Depth-averaged and three-dimensional Reynolds-averaged Navier–Stokes (RANS) -based morphodynamic models coupled with empirical sediment-transport relations are computationally efficient and widely used in engineering practice. However, their main limitation in local scour applications is not necessarily the representation of three-dimensional hydrodynamics, but the reliance on empirical transport closures and simplified bed-update formulations, which may not adequately capture dense sediment behaviour, bed failure and strong phase coupling near structures (Liu and García, 2008; Tafarojnoruz et al., 2010; Zhao and Cheng, 2010).
Eulerian two-phase computational fluid dynamics (CFD) models improve physical realism by resolving two-way coupling between the fluid and sediment phases, enabling more detailed analysis of sediment transport and scour evolution (Chauchat et al., 2017; Liu, 2021; Liu et al., 2016). Many two-phase approaches neglect explicit free-surface dynamics; this omission is often acceptable for flows in deep water with low Froude numbers. However, free-surface variations become important in shallow flows or low submergence conditions, where free-surface adjustment influences the near-bed pressure field and shear stresses that control sediment mobilisation.
Eulerian three-phase CFD models represent a further development because they resolve air, water and sediment phases within a single framework, allowing free-surface effects and sediment dynamics to be modelled concurrently. The recent development of sedInterFoam, a three-phase solver built on OpenFOAM, enables fully Eulerian simulation of free-surface flow and sediment transport with two-way phase coupling (Mathieu et al., 2024).
In this framework, dense sediment behaviour is represented using granular rheology, notably the formulation (Jop et al., 2006). In such approaches, the sediment phase is treated as a continuum whose stress depends on the local deformation rate and granular pressure, allowing transitions between quasi-static and sheared regimes to be captured within a unified constitutive law. This is particularly relevant for local scour, where the bed experiences strong shear, sediment mobilisation and continuous rearrangement, processes that are not fully represented by empirical transport relations alone.
By incorporating granular rheology within a three-phase Eulerian formulation, the model provides a more process-based description of sediment transport and bed evolution, while retaining the ability to simulate free-surface flow and near-structure hydrodynamics in a coupled manner. In the present study, this model is applied to clear-water scour around a cofferdam under steady-current forcing in a laboratory flume configuration, and realism is assessed by direct validation against measured scour-depth evolution and bed morphology from cofferdam experiments (Whitehouse et al., 2021). For the present case, the approach-flow Froude number is low (), so free-surface effects are expected to be secondary; the air-water coupling is retained for consistency of the three-phase formulation and general applicability.
Although three-phase Eulerian modelling is computationally demanding and sensitive to numerical resolution and constitutive assumptions, it provides improved physical completeness for cases where near-structure turbulence and free-surface effects materially influence sediment mobilisation and redistribution. Here, the objectives are to assess the model’s ability to reproduce (i) the temporal evolution of maximum scour depth; (ii) the development of bed profiles and depositional patterns for cofferdam scour under steady current; and (iii) to highlight the new insights that the model offers. Model performance is evaluated against flume measurements, and remaining discrepancies are interpreted in the context of methodological limitations (e.g. turbulence closure, grid resolution and granular rheology parameterisation).
2. Model description
2.1 Governing equations
A fully Eulerian three-phase formulation is adopted to model the coupled evolution of (i) free-surface hydrodynamics; and (ii) sediment mobilisation and bed deformation. Air, water and sediment are treated as interpenetrating continua with volume fractions , and satisfying
Each phase has a phase-averaged velocity, , and . To reduce the number of transported phase indicators, the formulation is expressed in terms of the sediment volume fraction and a volume-of-fluid (VOF) indicator for the air–water interface. The physical phase fractions are then recovered as
The combined fluid occupying the non-sediment volume fraction is referred to below as the carrier phase (air + water mixture).
Mass conservation:
For each incompressible phase (no phase change), continuity reads
where t is time (s) and is the density of phase i. In practice, transport is solved for and for the VOF field ; defining as the velocity of the carrier phase, the conservative transport of liquid mass is written as
A standard VOF interface-compression term is used to maintain a sharp air–water interface. Material properties of the carrier phase vary across the interface through (e.g. ).
Momentum conservation:
Momentum is solved for (i) the sediment phase; and (ii) the carrier phase, coupled through interphase momentum exchange (e.g. drag and related interaction forces). The sediment-phase momentum equation reads
and the carrier-phase momentum equation is
Here, is the gravitational acceleration vector (m/s2); and are the sediment (granular) and carrier-phase pressures, respectively; and are deviatoric stress tensors; is surface tension; is interface curvature; and is the unit normal at the air–water interface. Treating air and water as a single carrier phase reduces the fluid momentum balance to one equation, while the VOF method captures the sharp transition in fluid properties (density and viscosity) and interfacial forces at the free surface (Hirt and Nichols, 1981; Jacobsen et al., 2012).
Constitutive models and granular rheology:
For the carrier (air + water) phase, the deviatoric stress tensor is modelled as
where is the effective (laminar + turbulent) dynamic viscosity, and is the rate-of-strain tensor of the carrier phase. Dense sediment behaviour is represented using a local granular rheology. Following Jop et al. (2006), the friction coefficient is expressed as
where is the quasi-static friction coefficient, is the high-shear limit and controls the transition between regimes. The inertial number is defined as
with the median grain size, the granular pressure and the second invariant of the sediment-phase strain-rate tensor . In the sedFoam/sedInterFoam framework, the granular closure is implemented via an effective-viscosity form (i.e. with ) to provide numerical closure (Chauchat et al., 2017; Jop et al., 2006).
Turbulence modelling:
Turbulence is modelled only for the carrier phase (the air + water mixture occupying volume fraction ). In this work, a k-twoPhaseRAS model is solved for , providing the eddy viscosity contribution within and accounting for turbulence modulation by the presence of sediment through mixture properties and interphase coupling (Chauchat et al., 2017; Mathieu et al., 2024). No turbulence transport equations are solved for the sediment phase; sediment stresses are given by the granular rheology, and sediment motion is coupled to the carrier flow through .
2.2 Numerical setup
A three-dimensional numerical flume was configured to reproduce a baseline cofferdam scour experiment under steady-current, clear-water conditions. The reference configuration used for the CFD simulations comprises a square cofferdam with planform m installed within an erodible sand bed of thickness 0.5 m (median grain size mm) and subjected to an approach current velocity of 0.244 m/s with a still-water depth above the initial flat bed of m. The following subsections describe the experimental basis, computational domain, mesh, boundary conditions and numerical controls in sufficient detail to allow replication of the model setup.
2.3 Experimental configuration
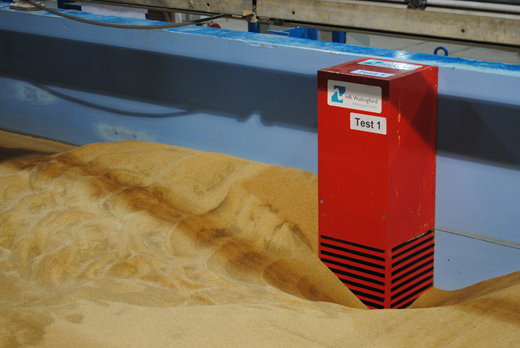
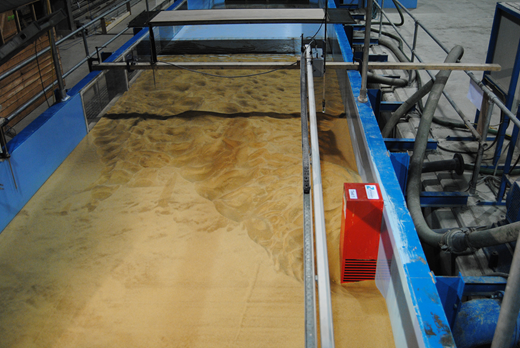
The numerical model was configured to reproduce the baseline cofferdam experiments reported in Whitehouse et al. (2021). The experiments were conducted in a recirculating flume with overall dimensions of approximately 25 m in length, 2.4 m in width and 0.9 m in depth. The cofferdam structure was installed within an erodible sand bed of thickness 0.5 m, composed of well-sorted, medium-grained quartz sand with characteristic grain sizes mm, mm and mm (uniformity coefficient ). During the baseline test, the still-water depth above the initial sand bed was m, and the same water depth was imposed in the numerical simulations (Figure 1).
A series of tests investigated scour response for different cofferdam planform geometries under steady currents with approach velocities in the range 0.15–0.244 m/s, selected to remain within clear-water conditions (i.e. below the threshold for general bed mobility). Bed evolution was quantified from repeated laser line scans (Figure 2), enabling extraction of bed profiles and scour/deposition patterns over test durations of approximately 50–75 h.
For the CFD simulations presented in this study, a baseline case with an approach current velocity of 0.244 m/s and a square cofferdam cross-section of m was adopted as the reference configuration.
2.4 Computational domain and coordinate system
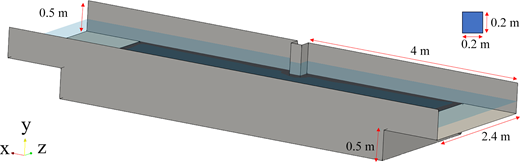
The computational domain was aligned with the experimental flume, with x in the primary flow direction, z across the flume and y vertical (positive upward). The domain dimensions were 8.0 m in the streamwise direction, 2.4 m in the spanwise direction and 1 m in height (Figure 3). The vertical extent comprised a 0.5 m erodible sand layer, a 0.2 m water column and a 0.3 m air layer above the initial still-water level.
To minimise sensitivity to boundary conditions, the cofferdam was placed at mid-length in the domain and attached to the sidewall, ensuring sufficient upstream and downstream distances for approach-flow development and wake/scour evolution, without direct interference from inlet/outlet treatments. With the cofferdam located at mid-length in the 8.0 m streamwise domain, the structure is approximately 4.0 m from each boundary (i.e. about 20B, where m is the cofferdam width); accounting for the 1.0 m relaxation zones at the inlet and outlet, approximately 15B separates the cofferdam from the active forcing regions (Figure 3).
2.5 Initialisation of phases (sand, water and air)
The lower 0.5 m of the domain was initialised as an erodible sand bed by prescribing a packed-bed sediment volume fraction within the bed region (set to ) and in the overlying water and air regions. The air–water interface was initialised using the VOF indicator field , with below the still-water level and above it. The still-water depth above the initial flatbed was set to m, consistent with the experiments. Phase fractions are initialised according to Equation 2. All regions below the initial bed level contain a continuous sediment layer.
2.6 Mesh generation and grid-sensitivity assessment
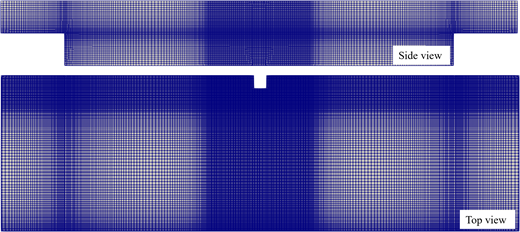
A predominantly hexahedral mesh was constructed using a structured background grid with local refinement around the cofferdam and within the near-bed region. Refinement was concentrated in regions expected to control scour initiation and evolution, including the upstream face/corners of the structure and the sand–water interface (Figure 4). Three systematically refined meshes (coarse, medium and fine) were generated to assess grid sensitivity while keeping the same refinement strategy, resulting in approximately , and control volumes, respectively (Table 1).
Grid sensitivity was quantified using the maximum local scour depth, , evaluated at s. The maximum scour depth occurred at the upstream edge of the cofferdam. The quantity was extracted from the computed bed surface as the maximum bed lowering relative to the initial flatbed within the near-structure region (i.e. the cofferdam footprint and immediate vicinity). In addition to this scalar metric, qualitative comparison of the bed morphology indicated that the main erosion-deposition patterns were consistent across mesh resolutions.
Table 1 summarises the mesh levels and the corresponding . The predicted scour depth increases with mesh refinement, and the medium mesh differs from the fine mesh by less than 5%, indicating reduced sensitivity of at finer resolutions. The fine-resolution mesh was therefore selected for the production simulations to ensure maximum accuracy, as it provides the most spatially resolved representation among the tested grids. Discretisation uncertainty was estimated using a grid convergence index (GCI) assessment; the fine-grid uncertainty for is (approximately m), indicating near grid independence for the scour-depth metric considered.
2.7 Boundary conditions and current forcing
Boundary conditions were defined to represent a steady, uniform approach current together with an explicitly resolved free surface. Steady-current forcing at the inlet and outlet was applied using a relaxation-zone (sponge-layer) approach, in which prognostic fields are blended towards prescribed target values within a finite-length zone.
Inlet: An inlet relaxation zone of length m was used to drive the carrier-phase (air + water) velocity towards a uniform target current, with m/s. The target free surface was defined by a still-water level with depth m (i.e. below the free surface and above). The target current was verified at the cofferdam location (mid-domain) by sampling the approach flow at the x-location corresponding to the cofferdam centreline.
Outlet: An outlet relaxation zone of length m was applied to maintain the target current and to minimise spurious reflection of free-surface disturbances. At the outflow boundary, a zero normal gradient condition was applied for the carrier-phase velocity, , consistent with a Neumann-type outflow treatment.
Top boundary: The top boundary represented an open atmosphere. A reference (gauge) pressure was imposed at the top boundary, and the velocity was permitted to switch between inflow and outflow depending on the local solution (i.e. a mixed in/outflow condition). This allows the free movement of the water–air interface.
Cofferdam and flume walls: No-slip conditions were applied at solid boundaries for the phase velocities (carrier phase and sediment), with standard wall functions used for the turbulence closure. Zero normal gradients were applied for the granular pressure at solid boundaries.
The gravitational acceleration vector was aligned with the vertical axis, and the densities and viscosities of air and water were set to their experimental values. Sediment properties were specified according to the experimental material, with kg/m3 and mm. The granular rheology parameters were adopted from literature-based values used in sediment-transport applications. Chauchat et al. (2017) report parameter sets in the ranges − 0.52, −0.96 and for their validation cases. Based on this range, the present simulations use , and . A limited sensitivity study varying within the above ranges indicated only a minor influence on the predicted scour metrics for the present configuration. Variations in , and resulted in changes to of no more than 2% (corresponding to ) at representative times (e.g. ), and did not significantly alter the spatial location of peak scour or deposition. The influence of granular rheology parameters over longer simulation times and under different flow conditions needs further investigation.
2.8 Numerical controls and post-processing
Simulations were performed in transient mode. No separate hydrodynamic spin-up phase was applied prior to enabling sediment mobility; therefore, early-time scour development includes the adjustment of the flow field from the initial conditions. The time step was adjusted automatically to satisfy stability limits based on Courant numbers for both the momentum and volume-fraction transport, with a target maximum Courant number of 0.5. The time step was initialised at s and capped at s. Each run was advanced from to s, and solution fields were written every 25 s of simulated time.
Post-processing focused on (i) the time evolution of the maximum local scour depth in the vicinity of the cofferdam; and (ii) bed profiles and scour/deposition patterns. The instantaneous bed surface was reconstructed from the sediment volume-fraction field by extracting an iso-surface representing the sediment-water transition, and bed-level change and scour depth were computed relative to the initial bed elevation.
3. Results and discussion
3.1 Validation against experiments
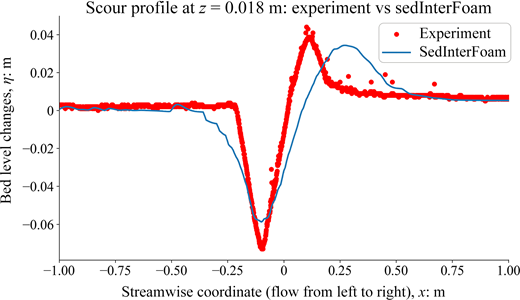
Figure 5 shows the streamwise scour profile along the cofferdam centreline, comparing the bed level from the laboratory experiment with the numerical prediction at s. Bed level change is plotted relative to the initial flat bed, with negative values denoting erosion and positive values denoting deposition.
The three-phase model reproduces the main characteristics of the measured scour pattern. Both profiles exhibit a pronounced local minimum close to the upstream face of the cofferdam. From Figure 5, the measured minimum bed-level change is approximately m at m, whereas the numerical prediction gives m at a similar location, corresponding to an under-prediction of the maximum scour depth by about 0.011 m (15%). The downstream depositional feature is also captured: the experimental depositional crest reaches m at m, compared with m at m in the simulation (difference m, 15%), with the numerical prediction showing a noticeable downstream shift of the depositional peak. This under-prediction is non-conservative from a design perspective if the peak scour depth alone is used for safety checks. In practical applications, CFD-predicted peak scour depths should therefore be interpreted in conjunction with an appropriate design margin or safety factor, as well as model-form uncertainty. Notably, the approximately 15% discrepancy is smaller than the typical scatter reported for widely used empirical scour predictors, which often exhibit substantially larger uncertainty across different geometries and flow regimes.
These differences are nevertheless evident in the detailed shape of the scour hole and depositional hump. The numerical profile exhibits a smoother and broader scour depression: for example, the region with spans approximately 0.14 m in the measurements but approximately 0.19 m in the simulation. The largest local mismatch occurs on the downstream shoulder of the scour hole near m, where the experiment shows rapid recovery and local deposition ( m) while the simulation predicts m (difference m). Over the full transect shown (), the root-mean-square difference between the numerical and experimental profiles is approximately 0.013 m.
These discrepancies result from the modelling assumptions and numerical limitations: the use of a RANSk– closure filters high-frequency vortex dynamics and tends to smooth near-bed shear; the granular closure uses fixed bulk friction parameters and does not represent grain-size sorting and armour-layer formation that can stabilise scour-hole side slopes; and finite grid resolution introduces numerical diffusion in both momentum and volume-fraction transport. Additional differences may also arise because the numerical profile is an idealised centreline slice, whereas the experimental curve is derived from three-dimensional laser scans and may include measurement scatter and small-scale bedform variability. Despite these limitations, the agreement in the position and magnitude of the dominant scour and deposition features indicates that the three-phase model provides a physically consistent representation of cofferdam scour under steady current.
3.2 Bed evolution and sediment pathways
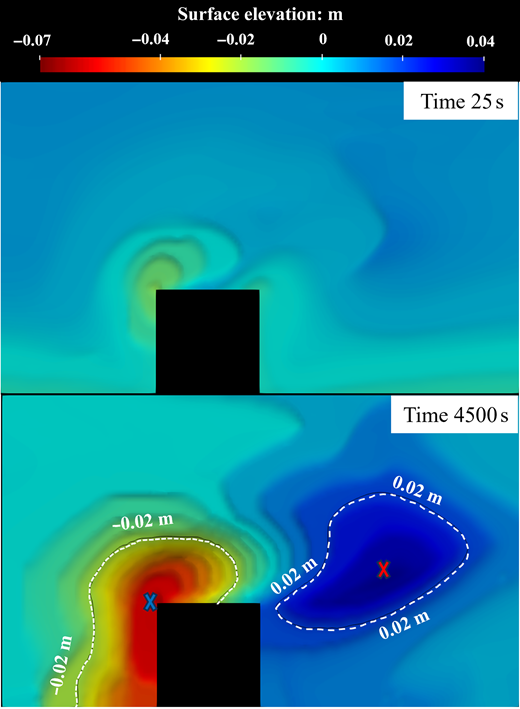
Figure 6 illustrates the predicted evolution of bed level change around the square cofferdam at an early stage ( s) and at the end of the simulation ( s). Bed level change is reported relative to the initial flat bed, with negative values denoting erosion (scour) and positive values denoting deposition.
At s, scour initiation is already evident and is localised near the upstream corner region, although the magnitude of bed-level change remains small at this very early time. By s, a pronounced scour hole has formed adjacent to the upstream edge (blue marker), with a maximum bed lowering approaching m on the plotted scale. A distinct depositional region develops in the wake (red marker), with peak deposition approaching m. The m isolines in Figure 6 highlight the spatial extent of the core erosion and deposition regions, demonstrating the characteristic paired scour-deposition morphology associated with wake separation and near-bed recirculation. A direct quantitative comparison with measured spatial scour maps is not included because comparable gridded experimental bed-elevation data were not available; spatial validation is therefore based on centreline profiles and the temporal evolution of .
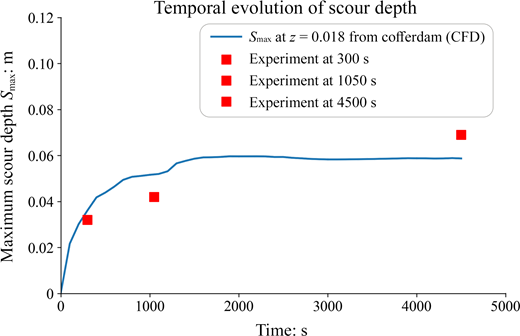
Figure 7 summarises the transient development of scour through the maximum local scour depth, , extracted from the computed bed surface at each output time over the full simulated duration ( s). The bed surface was obtained from the three-phase solution by identifying the sediment–water interface from the sediment volume fraction field . The maximum scour depth was defined as the maximum bed lowering relative to the initial flat bed. Experimental values of at , 1050 and 4500 s are included for comparison.
The prediction exhibits a rapid initial growth of , with the scour rate reducing over time and approaching a near-asymptotic depth by the end of the simulation, consistent with morphodynamic feedback under steady currents. Over the later period (t ≳ 1050 s), the increase in is modest, indicating progressive adjustment towards a quasi-equilibrium scour depth for the imposed forcing. During the early stage, flow stagnation at the upstream face and curvature of streamlines around the upstream corners drive near-bed downflow and the development of a junction-vortex/recirculation system at the structure–bed interface, together with separated shear layers in the wake. For a wall-attached cofferdam, these vortical features are asymmetric and truncated by the sidewall, rather than forming a fully developed horseshoe vortex around an isolated pier. Nevertheless, the resulting near-bed recirculation and shear-layer forcing locally amplify bed shear stress and promote sediment entrainment.
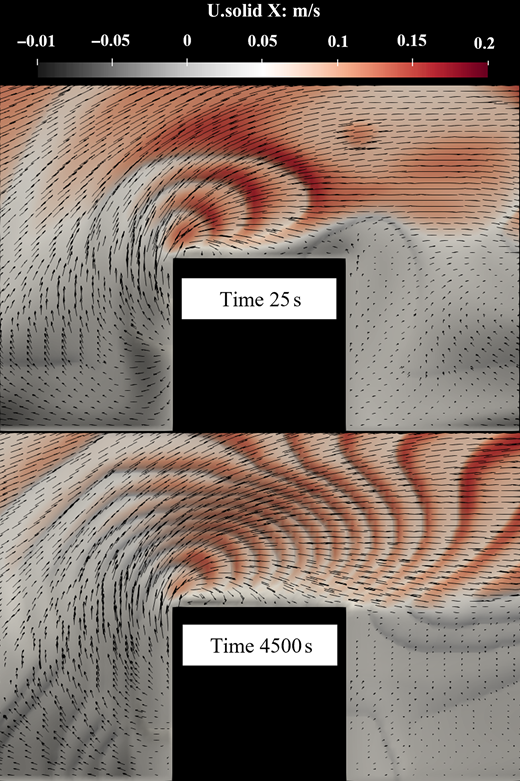
Figure 8 visualises sediment transport pathways at the same time instances using sediment-phase velocity vectors (arrows) and the streamwise sediment velocity component (colour). At s, the sediment motion is already localised near the upstream corner where the approach flow accelerates and turns around the structure. By s, coherent transport pathways develop around the upstream corner and along the cofferdam sides into the wake region, consistent with export of mobilised sediment from the primary scour zone and accumulation within the low-momentum downstream area. The vector field further indicates near-wall return flow (negative ) associated with recirculation cells on the flanks and in the wake: the stoss-side (upstream) recirculation is stronger and promotes sediment export from the vicinity of the cofferdam, whereas the lee-side (downstream) recirculation is weaker and is consistent with deposition in the sheltered wake.
The comparison between the early- and late-time snapshots also highlights morphodynamic feedback between the evolving bed and the flow field. With progressive deepening and widening of the scour hole, the near-bed flow reorganises within the depression. The transport pathways and the transport rates adjust accordingly, leading to a reduced local scour growth rate and a gradual approach towards a quasi-equilibrium bed morphology over the simulated period.
3.3 Bed shear stress
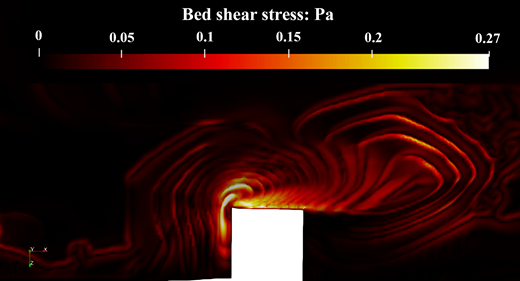
Figure 9 shows the instantaneous distribution of bed shear stress magnitude at s. The reported bed shear stress is computed from the carrier-phase instantaneous velocity field and effective viscosity at the sediment-water interface within the RANS framework, and therefore represents an instantaneous-flow diagnostic, while turbulent fluctuations are represented through the turbulence closure rather than explicitly resolved. The field exhibits a pronounced high-shear footprint concentrated at the upstream corner and along the leading edge of the cofferdam. Based on the plotted scale, peak values reach −0.27 Pa in the immediate vicinity of the upstream edge, indicating regions of elevated near-bed forcing associated with scour initiation. For reference, an empirical estimate of the incipient-motion threshold gives a critical Shields parameter of , corresponding to a critical shear stress Pa (Fredsoe and Sumer, 2002; Construction Industry Research and Information Association (CIRIA), 2015). The peak value Pa therefore yields , indicating local exceedance of the mobilisation threshold in the primary scour zone.
Downstream of the structure, an elongated band of elevated extends into the wake, aligned with the separated shear layer evident from the streamline pattern. In contrast, the wake core exhibits comparatively low shear, consistent with reduced near-bed forcing and the formation of a depositional region. The spatial organisation of therefore provides a mechanistic explanation for the paired erosion-deposition morphology observed in the bed-evolution results: localised high shear at the upstream edge promotes sediment entrainment, while reduced shear within the wake favours settling and accumulation.
3.4 Vortex core evolution
For a wall-attached cofferdam, the streamline pattern indicates an asymmetric near-bed junction-flow/recirculation system at the upstream corner and a truncated wake-separation region, rather than a fully developed horseshoe vortex around an isolated pier. These flow features influence the location and extent of peak shear stress and hence the primary scour zone.
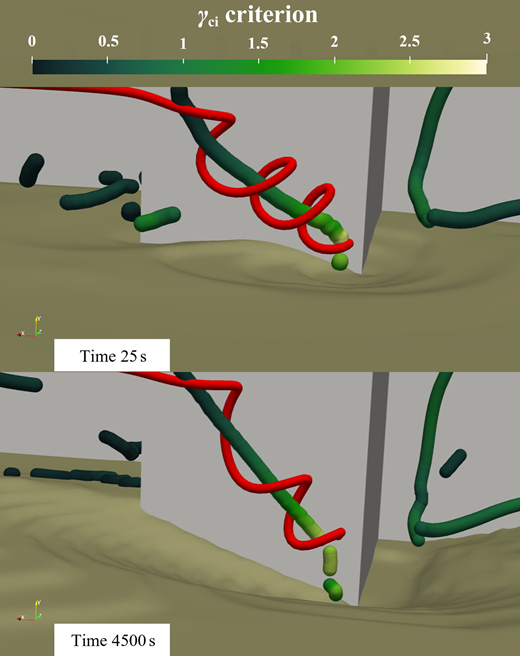
Figure 10 highlights the near-field vortical features associated with corner scour by showing vortex-core lines extracted from the carrier-phase velocity field using the swirl-strength criterion , together with a representative streamline for flow visualisation (red). Because the carrier-phase turbulence is modelled using a RANS closure, these structures should be interpreted as vortical features extracted from the instantaneous carrier-phase velocity field, while turbulent fluctuations are represented through the closure rather than explicitly resolved.
At s, a compact corner-attached vortex core is already present near the structure-bed junction, indicating the rapid establishment of three-dimensional recirculation that concentrates near-bed forcing at the upstream corner. At this early stage, the maximum swirl strength is s.
By s, the dominant vortex core elongates, penetrates deeper and aligns with the developed scour depression, indicating that the near-bed vortical structure reorganises as the bed morphology evolves. Secondary weaker cores are also visible in the near-field and wake regions. The maximum swirl strength at s is s, comparable to the early-time value and indicating persistent vortical activity throughout the simulation. Despite this persistence, the deepening scour geometry progressively shelters the bed: the dominant vortex structure migrates downward into the depression and acts on sloped surfaces, reducing the effective near-bed shear available for additional entrainment. This morphodynamic feedback explains the reduced scour growth rate at late times.
4. Conclusions
This paper assessed the capability of a fully Eulerian three-phase solver to predict clear-water local scour around a wall-attached square cofferdam under steady-current forcing. The numerical setup reproduced the laboratory configuration (including an explicitly resolved free surface) and represented dense sediment behaviour using a granular rheology.
Validation against the measured bed profile shows that the model reproduces the location and overall morphology of the dominant scour and deposition features. At s, the maximum scour depth is under-predicted by approximately 0.011 m (15%), while the downstream depositional crest magnitude differs by approximately 0.007 m (15%) with a downstream shift in its predicted location. While the model slightly under-predicts peak scour depth in this baseline case, it captures the principal erosion-deposition morphology, providing spatially resolved insight that complements single-value empirical estimates. The predicted time development of is consistent with the observed rapid initial growth followed by a progressive reduction in scour rate, reflecting morphodynamic feedback as the scour hole deepens and the near-bed stress redistributes.
Process-based diagnostics support a physically consistent interpretation of cofferdam scour. Bed-elevation and sediment-pathway visualisations show that erosion initiates at the upstream corner/leading edge and that mobilised sediment is routed around the structure into the wake, where deposition develops in the low-momentum region. The bed shear-stress field exhibits a concentrated high-shear footprint at the upstream edge (peak −0.27 Pa), consistent with local exceedance of an incipient-motion threshold for the present sediment ( Pa using ). Vortex diagnostics indicate persistent vortical features extracted from the instantaneous carrier-phase velocity field that evolve with the developing scour hole, linking near-bed flow organisation, the spatial distribution of shear stress and the observed sediment transport pathways.
Remaining discrepancies in detailed bedform shape are attributed primarily to (i) turbulence-model limitations associated with a RANS closure (which filters unsteady turbulent fluctuations and can smooth near-bed shear); (ii) idealisations in the granular closure (e.g. no grain-size sorting or armouring); and (iii) finite grid resolution in the near-bed/high-shear region.
From an engineering perspective, the results demonstrate that three-phase, process-based CFD can provide spatially resolved insight into scour development, complementing traditional empirical design methods that rely on single-value predictions. The ability to capture coupled flow-sediment interactions and evolving bed morphology offers potential for improved assessment of scour risk and the design of mitigation measures for marine and coastal structures.
Future work should extend validation across a wider range of flow conditions, sediment properties and structural geometries, and assess performance under combined wave-current forcing. Further investigation of turbulence modelling approaches and granular rheology parameterisation would also help to refine predictive accuracy and improve robustness for engineering applications.
Acknowledgements
This project has received funding from the Horizon Europe Marie Skłodowska-Curie Actions under Grant Agreement No. 101072443 (SEDIMARE). Experimental data were obtained from the General Purpose Flume at the Froude Modelling Hall, HR Wallingford Ltd. The numerical simulations were performed using the HYDRA2 high-performance computing cluster at HR Wallingford.