
N. W. H. Allsop, HR Wallingford and University of Southampton, UK
9. INTRODUCTION
While welcoming the emphasis of this paper on probabilistic analysis of wave overtopping, this discussion seeks to correct important mistakes that have arisen here and elsewhere in the interpretation of tolerable overtopping limits.
Many users of the guidance manuals by Owen, Besley and CIRIA/CUR,10,12,15 have chosen the most pessimistic interpretation of the limits suggested, without appreciating the origins of those limits, or taking account of other research, particularly on the safety of pedestrians and vehicles. These misinterpretations have led to use in the UK of over-pessimistic overtopping targets in practice and in this paper. It is therefore important to use more realistic limits to avoid expensive and harmful over-design, irrespective of the method used to predict the overtopping.
Most of the overtopping limits cited by the authors, particularly in sections 4 and 6 of the paper, derive from analysis by Japanese port engineers concerned by overtopping of steep or vertical seawalls – see Fukuda et al.21 Although some field measurements of overtopping were made, much of their analysis of tolerable limits derive from comparisons of perceived hazards with overtopping predictions using (graphical) methods by Goda.22,23 Three important qualifications therefore apply to the use of those limits.
Overtopping discharges used for those limits were defined at the crest of the defence, not at the recipient.
Most of these discharges would have arisen from violent (sometimes impulsive24) overtopping of steep or vertical walls.
The port engineers necessarily took a conservative stance in the absence of any better information.
There have been many improvements in the 30+ years since that era, some more field data and considerably more experience of overtopping in practice. This note therefore seeks to identify those new data and to highlight guidance being developed for the EurOtop Manual, intended to replace both the EA and TAW Overtopping Manuals12,13 during 2007.
10. WAVE OVERTOPPING PROCESSES AND HAZARDS
The main (marine) hazards on or close to sea defence structures are of death, injury, property damage or disruption from direct wave impact or by drowning. On average, approximately two to five people are killed each year in each of UK and Italy through wave action, chiefly on seawalls and similar structures (although this rose to 11 in UK during 2005). It is often helpful to analyse wave and overtopping effects and their consequences under three general categories.
Direct hazard to people immediately behind the defence.
Damage to property, infrastructure or activities in the area defended, including economic, environmental or other resource, or disruption.
Damage to defence structure(s), either short-term or longer-term.
This note primarily discusses hazards to people (category (a)).
Hazards driven by overtopping can be linked to a number of simple direct flow parameters
mean overtopping discharge, Q
individual and peak overtopping volumes, Vi and Vmax
overtopping velocities over the crest or promenade, horizontally and vertically, vxc and vzc or vxp and vzp
overtopping flow depth, again measured on crest or promenade, dxc or dxp.
However, field (or model) data on overtopping flow velocities and depths are sparse, so this note deals with mean overtopping discharges and peak volumes.
11. TYPES OF OVERTOPPING
Wave overtopping which runs up the face of the seawall and over the crest in (relatively) complete sheets of water is often termed ‘green water’. It is this form of overtopping that is most naturally predicted by the authors’ approach. In contrast, ‘white water’ or spray overtopping tends to occur when waves break seaward of the defence structure or break onto its seaward face, producing non-continuous overtopping, and/or significant volumes of spray. Spray may be carried over the defence under its own momentum or driven by an onshore wind. Additional spray may be generated by wind acting directly on wave crests, particularly collisions with reflected waves.
Spray will seldom contribute substantially to overtopping volumes, but may cause local hazards. Intermittent spray may reduce visibility on coastal highways, which can cause drivers to veer suddenly–for example see Kimura et al.25 The effects of wind and generation of spray have not often been modelled. Some research has suggested that the effects of onshore winds on large green water overtopping are small–for example see de Waal et al.26,27–but that overtopping under Q = 1 l/s per m (approximately) may increase under strong winds, especially where much of the overtopping is as spray–see Pullen et al.28 and de Rouck et al.29 – suggesting that wind effects may influence overtopping at and near acceptable limits for these hazards.
12. SUGGESTED LIMITS TO OVERTOPPING
Guidance on discharges that can be tolerated by pedestrians, quoted previously by Owen, Besley or CIRIA/CUR,10,12,15 were derived from the analysis by Fukuda et al.21 updated by De Gerloni et al.30 and Franco et al.31 Further guidance from Iceland32 suggests limits for damage to equipment or cargo on a quay. Other guidance distinguishes between pedestrians or vehicles, and between slow and faster speeds for vehicles.33
In most instances the overtopping discharge (or volumes) discussed here are those at the point of interest, for example at the roadway or footpath or building. It is noted that the hazardous effect of overtopping reduces with distance backwards from the defence crest. As a rule of thumb, the hazardous effect of an overtopping discharge at a point x m back from the seawall crest will be given by the overtopping discharge reduced by a factor of x, probably within a range of 5–25 m. So the effective overtopping discharge at x (in metres), Qeffective, is given by
The overtopping limits to be suggested by the EurOtop Manual, developed from those in the CLASH research project,33,34,35 derive from a generally precautionary principle informed by previous guidance, and by observations/measurements made by the CLASH partners and other researchers. Limits for pedestrians in Table 3 show a logical sequence, with allowable discharges reducing steadily as the recipient's ability or willingness to anticipate or receive the hazard reduces.
Limits for overtopping for pedestrians
| Hazard type and reason | Mean discharge Q: l/s per m | Max. volume* Vmax: l/m |
|---|---|---|
| Trained staff, well shod and protected, expecting to get wet, overtopping flows at lower levels only, no falling jet, low danger of fall from walkway | 1–10 | 500 at low level |
| Aware pedestrian, clear view of the sea, not easily upset or frightened, able to tolerate getting wet, wider walkway.† | 0·1 | 20–50 at high level or velocity |
These limits relate to overtopping velocities well below vc ≈ 10 m/s. Lower volumes may be required if the overtopping process is violent and/or overtopping velocities are higher.
Not all of these conditions are required, but nor should a single condition on its own require application of a more severe limit.
A further precautionary limit of Q = 0·03 l/s per m might apply for unusual conditions where pedestrians have no clear view of incoming waves; or may be on a narrow walkway or in close proximity to a trip or fall hazard. Research studies have, however, shown that this limit is only applicable for the conditions identified, so it should not be used as the general limit for which a higher limit in Table 3, say Q = 0·1 l/s per m, is appropriate.
For vehicles, the suggested limits are rather more widely spaced as two very different situations are considered. The higher overtopping limit in Table 4 applies for low vehicle speed and where overtopping generates pulsating flows at roadway level, akin to driving through slowly-varying fluvial flow across the road. The lower overtopping limit in Table 4 is, however, derived from considering more impulsive flows, where overtopping might travel above the roadway, with overtopping volumes being projected at speed and with some suddenness.
Limits for overtopping for vehicles
| Hazard type and reason | Mean discharge Q: l/s per m | Max. volume Vmax: l/m |
|---|---|---|
| Driving at low speed, overtopping by pulsating flows at low flow depths, no falling jets, vehicle not immersed | 10–50* | 100–1000 |
| Driving at moderate or high speed, impulsive overtopping giving falling or high-velocity jets | 0·01–0·05† | 5–50† at high level or velocity |
These limits relate to overtopping defined at highway.
These limits relate to overtopping defined at the defence.
Fewer generic data are available on the effects of overtopping on structures, buildings and property. Site-specific studies suggest that pressures on buildings by overtopping flows vary significantly with the form of wave overtopping. Effects of overtopping can be substantially modified by use of sea defence elements intended to disrupt overtopping momentum (not necessarily reducing discharges). Guidance derived from the CLASH research and previous work suggests limits in Table 5 for damage to buildings, equipment or vessels behind defences.
Limits for overtopping for property behind the defence
| Hazard type and reason | Mean discharge Q: l/s per m | Max. volume Vmax: l/m |
|---|---|---|
| Significant damage or sinking of larger yachts | 50 | 5000–50 000 |
| Sinking small boats set 5–10 m from wall. Damage to larger yachts | 10* | 1000–10 000 |
| Building structure elements | 1† | — |
| Damage to equipment set back 5–10 m | 0·4* | — |
These limits relate to overtopping defined at the defence.
This limit relates to the effective overtopping defined at the building.
13. CONCLUDING REMARKS
Analysis of the safety of people close to sea defences should balance potential hazards35,36 with the population's desire for access, economic activities and the costs of defence structures to investors (public or private). Any assessment of safety under overtopping conditions should dispassionately contrast potential hazards with local vulnerability. For many roads, footpaths or promenades, users have a clear view of the sea, are able to judge whether the sea is rough, and are likely already to be clothed for inclement weather. It is then quite inappropriate to use the extraordinary limit of Q = 0·03 l/s per m or less, when Q = 0·1 or 1·0 l/s per m may easily be tolerated. These latter limits are likely to cover the majority of conditions around the UK and Europe, and so they should provide more realistic limits for the simulations described by the authors. In contrast, the unusual case (say) of a workshop area constructed directly against the back face of a seawall crest, where workers cannot see the sea and so have no warning, and where the overtopping may fall onto them from above, then the limit of Q = 0·03 l/s per m may be entirely appropriate.
Authors' reply
Professor Allsop suggests that many users of the current guidance manuals have chosen the most pessimistic interpretation of the suggested limits for mean wave overtopping rates. Some, and possibly many, of these users are well aware of the origins of the recommendations as, presumably, were the authors of the manuals. Therefore, if the guidance has been misinterpreted, even by experienced engineers, then at least part of the responsibility must rest with those who formulated the guidelines. Perhaps they lacked clarity. Furthermore, if things are unclear, then it is natural to apply the precautionary principle.
Consequently, we thank the contributor for his very useful discussion and we look forward to reading clearer recommendations on tolerable overtopping rates in the European Overtopping Manual.
Table 3 in the discussion relates to an ‘aware pedestrian’ who has a ‘clear view of the sea’, is ‘not easily upset or frightened’ and is ‘able to tolerate getting wet’. It is, however, doubtful whether these descriptions can readily be applied to the many children who visit the seaside, either accompanied by adults or on their own. Furthermore, the needs and rights of individuals with disabilities and of the elderly must also be considered. It is agreed that the extraordinary limit of 0·03 l/s per m would be inappropriate if a mean discharge of 0·1 or 1·0 l/s per m could easily be tolerated. On the other hand, it remains unclear what levels of overtopping could be endured by children, disabled people and the elderly. The elderly, in particular, may make up a very significant proportion of those resident in, or visiting, UK seaside resorts during winter. Consequently, it may be worthwhile differentiating between sites open to the general public and sites from which they are excluded. Increasingly, the media report rescues by the emergency services, be it at the seaside, in mountains or elsewhere, which suggest that members of the general public who put themselves in danger often do not fully appreciate the risks they are taking and are not suitably equipped to deal with difficulties. In contrast, workers in ports and at other restricted sites who have suitable training, regular reminders of the dangers involved and appropriate clothing, should be able to tolerate conditions unacceptable to the general public.
Professor Allsop also suggests that, when the sea is rough, pedestrians are likely to be clothed for inclement weather. This assertion may be generally true for the UK and some other parts of Europe, but it will not always be the case. Fig. 11 shows waves overtopping into a station on the Lisbon to Cascais railway line during a hot summer day. There was little, if any, wind. The swell may well have taken several days to reach the Portuguese coast from the area in which the waves were generated. Hence, even if the people using the station had been aware of the existence of a severe but distant storm, they may still have been surprised by its local impact some considerable time later.
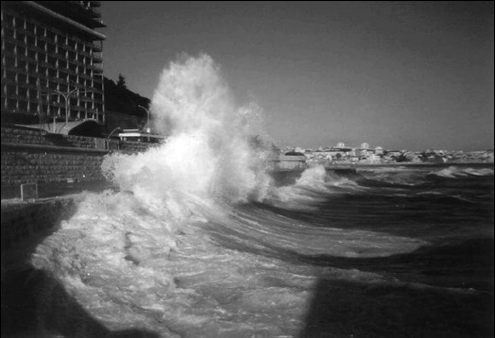
Swell waves overtopping into a station on the Lisbon to Cascais railway line during a hot, windless, summer day
Swell waves overtopping into a station on the Lisbon to Cascais railway line during a hot, windless, summer day
The aim of the authors’ paper was to illustrate the different results obtained in probabilistic calculations from two models used to describe wave overtopping. These differences generally remain, regardless of the tolerable overtopping rate. Table 6, which complements Fig. 10 in the original paper, shows that, for the case study considered, the Hedges and Reis overtopping model does not give hugely different recommended crest levels as the permissible overtopping discharge falls below 0·1 l/s per m. This outcome is in marked contrast to that for the Van der Meer and Janssen model which, because of its exponential form, requires an increase in crest level of about 1·3 m for every order-of-magnitude decrease in the permissible mean overtopping discharge. Finally, it is interesting to note that, in this particular example, both models give the same required crest level of 8·7m OD for Q = 1·0 l/s per m.
Required crest levels, with a probability of failure of 0·5%/year, to restrict wave overtopping to the values specified
| Probability of failure, Pf = 0·5%/year | ||
|---|---|---|
| Required crest levels: m OD | ||
| Permissible (tolerable) overtopping rate Q: m3/s per m | Hedges and Reis | Van der Meer and Janssen |
| 0·000001 | 9·7 | 12·6 |
| 0·00001 | 9·6 | 11·3 |
| 0·0001 | 9·3 | 10·0 |
| 0·001 | 8·7 | 8·7 |
| 0·01 | 7·8 | 7·3 |
| 0·1 | 6·1 | 5·9 |
REFERENCES
ACKNOWLEDGEMENTS
Funding from the UK Government's Department for Environment, Food and Rural Affairs (Defra) / the Environment Agency (EA) under SC050069, from the EC under EVK3-CT-2001-00058 and Defra / EA under FD2412, is gratefully acknowledged. VOWS was supported by the UK Government's Engineering and Physical Sciences Research Council (EPSRC) under GR/M42312 and GR/R42306, and built on earlier research by H R Wallingford (HRW) supported by the UK Government's Ministry for Agriculture, Fisheries and Food and EA. Additional input was given by the EPSRC project on Participation in Public Awareness ‘Safe at the Seaside’ under GR/S23827/01. The contributor is also grateful for helpful discussions with Ian Cruickshank, Tim Pullen, Steve Richardson and John Alderson (HRW) and within the EurOtop team, particularly Mark Klein Breteler (WL Delft) and Dick Thomas (Faber Maunsell and EA advisor).
