The main goal of graphical modelling is to communicate information clearly and effectively through graphical means. Little research has been undertaken in the domain of construction scheduling. It can be noted that there is no standard graphics protocol; therefore, it is up to each individual planner to set his or her own standard. This paper develops a new chronographical conceptual framework that describes all the elements required to perform construction operations, their processes, their logical constraints and their association and organisational models. The protocol studies the suitable visual parameters and their associated values in order to define a standard graphical presentation using shapes, sketches, codes, text, textures and colours. This protocol aims to overcome the current difficulties with graphical visualisation of the considerable amount of data needed for effective planning and to increase the effectiveness of visual research based on human visual habits. The validation process was performed using case studies that evaluated visual data and assessed the necessary mental effort required to find information on the schedule. The graphical convention of textures and colours has already been validated. The results have clearly demonstrated that this convention helps to simplify the process of searching for information on the schedule.
1 Project modelling
Over time, graphic modelling has become an essential tool for project managers. A model is a form of representation designed to aid in the visualisation of an item that cannot be observed directly, either because it has not yet been constructed or because it is abstract (Wideman, 2003). To construct a model, a class of phenomena is isolated and the reproduction of their behaviour is attempted using a certain number of hypotheses and laws (Legay, 1997). Being a simplification of reality, any model has its limitations. Thus, it is essential that the user be aware and be conscious of the validity of the results. Facing increasingly complex processes and procedures as well as multidisciplinary infrastructures, a model with a clear visualisation can facilitate the demonstration of the necessary information and becomes a useful tool for decision making. Karavakis et al. (2010) mention that the extraction of the desired data is facilitated when using simple graphical interfaces.
Visual representation usually allows for faster data exploration and often provides better results, especially in cases where automatic algorithms fail (Keim, 2002). Graphs are understood differently than text – that is, the former is understood globally, whereas the latter is understood sequentially. In addition, graphs can act as both a type of artificial memory and as a research tool in that they allow for the simultaneous display of the general structure as well as the details and exceptions: they can show the leaves, the branches and the whole tree at the same time (Bertin, 2005). According to Friedman (2008), the main goal of data visualisation is to communicate information clearly and effectively through graphical means. Graphical modelling is considered to be a suitable approach because of its ability to both effectively communicate information and encourage user participation during the visual optimisation process.
The human visual system is accustomed to receiving and processing information in specific ways, and the exploitation of these evolutionary habits has the potential to facilitate the interpretation of information (Ware, 2013). Several researchers have worked specifically on visual perception based on hue, saturation and lightness of colour (Sève, 2009). Healey and Enns (1999) suggests considering three separate effects for the selection of colours: the distance between colours on the visual spectrum, their linear separations and the colour category. Bertin (2005) notes that visual perception has three sensitive variables: the two planar dimensions and the variation of the mark on the plane. For comparison, sound perception and its representations (such as scriptural or mathematical) possess only two variables.
In order to model project design and construction processes, several recent studies have attempted to develop four-dimensional (4D) models by combining timeline data with a three-dimensional (3D) model. The latter represents the architectural, structural, mechanical and electrical dimensions of the project in question. These 3D models generally focus on the visualisation needed to detect and solve conflict during the design and construction phases and to help with site, resource and work location management. However, these models usually use traditional timeline schedules, showing activities and constraints on a calendar. These traditional representations of the fourth dimension have several shortcomings that will be discussed in the next section.
The chronographical model is considered the fourth dimension in a 4D system. This research does not propose a new 4D model, nor does it compete with other research in this area in recent years. Instead, over the last 15 years, the chronographical model has focused on graphical scheduling modelling, which represents the fourth dimension of time often overlooked by these 4D models.
2 Existing graphical scheduling methods
Traditionally, construction operation modelling based on the graphical approach has been scheduled using networks, bar charts or Gantt/precedence diagrams, line charts, simulation techniques, and through the introduction of site layout management. These methods are described below.
The critical path networks (arrow diagram method and precedence diagram method) are based on graph theory that represents constraints between activities in order to determine the project’s duration, indicated by the longest sequence of activities. The weaknesses associated with these non-time-scaled networks were discussed in a previous paper (Francis and Miresco, 2002, 2006).
The Gantt/precedence diagram is a timeline schedule method that combines the graphical representation of the bar chart diagram with precedence dependencies logic. Fisk and Reynolds (2010) discussed the visual complexity associated with this method. They reported difficulty reading the dependency lines, which are often extremely close together and cross over other activities, making them confusing to follow without a magnifying glass and a coloured pencil to trace the lines.
Line charts were developed to schedule linear and repetitive projects, providing work continuity for crews and resources. This method is applied for horizontal linear projects, such as road projects. However, its application to non-repetitive or vertical repetitive projects, such as building projects, presents some limitations, such as the difficulty of showing task relationships and parallel activities graphically.
Simulation technique models are a powerful way to simulate and optimise a repetitive cycle of construction operations. However, they cannot easily represent complex project schedules, since they can show only a limited amount of information clearly and are not time-scaled models.
Site layout management studies workspace conflicts, workspace planning and resource constraints, in addition to tracking space needs, timing and locations using 2D, 3D or 4D modelling. Chronographic modelling (Francis, 2004, 2013) belongs partially to this category.
None of these scheduling methods seems individually able to meet all of a planner’s needs. Planners must manage various project types and specialities and are confronted with a variety of problems. Each method addresses specific issues – that is, the linear schedule method is appropriate for planning linear infrastructure projects, while a bar chart is more suitable for building projects (Francis, 2013). In addition, most software programs use the Gantt/precedence method. In addition to their visual complexity, these software programs do not take into consideration many schedule aspects and constraints. The interaction between variables, such as availability of labour and equipment, management of limited workspaces, and circulation and flow of materials, dictates project duration. Letting traffic occur randomly without foresight or control causes congestion and wait times, resulting in loss of time and money. Effective management should therefore consider all these aspects.
Tory et al. (2013) presented a visual comparison tool for construction schedules. Their research addressed three main components: the graphical representation of constraint types (Echeverry et al., 1991; Koo et al., 2007), the interactive representation of precedence networks and the comparison of different planning alternatives. Stott et al. (2005) were inspired by a subway system, representing the project plan using lines, colours and shapes. Aigner et al. (2005) proposed a graphics system called ‘planning lines’ to represent uncertainty in the time attributes of activities. These methods represent a first step towards improving graphical planning representations. However, they only consider some aspects of planning and do not provide full graphical modelling protocols based on production elements, the organisation of these elements, their modelling approaches or their execution processes. It can be observed that there is no standard protocol for the graphical representation of the schedule; therefore, it has been up to the individual planner to set his or her own standard.
The development of new visualisation scheduling methods must also take into account the following three approaches: (i) technology-driven: what can be done with current technology; (ii) perception-driven: what makes sense considering the constraints on human visualisation; and (iii) task-driven: what the user wants (Encarnacao et al., 1994). Considerable effort has been put forth towards the technology-driven approach, where advancements in terms of information technology are remarkable. However, little attention has been given to the perception-driven and task-driven approaches. The fact remains that the current planning methods and software only partially meet the demands of managers.
In conclusion, the standardisation of graphical modelling for construction project schedules, especially for building projects, is several decades behind other fields. To cite some examples, in 1935, the infrastructure sector already had its first standard manual for the representation of road signs (Hawkins, 1992). The geotechnical sector refers to the ASTM D2487-11 standard (ASTM, 2011), using textures and colours to represent different kinds of soil. Urban planning has been using a standard convention of colours for land use classification since 1965 (APA, 2013).
3 Research objective and methodology
According to Tufte (1983), graphical quality is what gives the reader the greatest number of ideas in a minimum time period with the least possible amount of writing in the smallest possible space. In the case of construction scheduling, the model represents a simplified visual representation of the future unfolding of operations. Due to the availability of a large amount of data, the project planning involves the use of complex information and, therefore, the model becomes more and more elaborate in scope. The main purpose of the present work is based on exactly these ideas. The chronographical model’s main objective is to use graphical means to improve data visualisation and communicate information clearly and effectively for construction project schedules, replacing the traditional Gantt/precedence method.
This paper adds to the existing body of knowledge on this topic by introducing a new conceptual framework for chronographical modelling and establishing a standard protocol for planning and monitoring construction projects.
The conceptual framework is based on the entity-relation model. This model describes all the elements required to perform the construction operation–processes as well as logical, association and organisation models. The proposed protocol shows graphical representation elements for the construction operation using shapes, sketches, codes, text, textures and colours with distinct hues, saturation and brightness. This protocol aims to overcome current difficulties with graphical visualisation of the considerable amount of data needed for effective planning, and to increase the effectiveness of visual research based on human visual habits.
Over a period of 15 years of research and industrial collaboration, the chronographic method has been developed for project planning. Many aspects of the method have been developed and published in the past, while many others are still under development. This paper explains the overall conceptual framework and the related standard protocol, but not each element in detail. It was important to consider the general picture of the conceptual framework in one publication in order to state and consolidate the knowledge developed for the chronographic method in the past and to indicate future developments.
To achieve these objectives, the research methodology of the chronographic approach involves the following.
Analyses of the graphical interface of the schedule. The chronographic approach analyses the graphical representation of the schedule in entities, attributes, directions and scales and discusses the suitable visual parameters and approaches. The approach simulates the construction operation and the Cartesian axes and scales. The graphical approach describes how the schedule information can be communicated using tabular and graphical interfaces in order to manage specialties, locations, means, processes and constraints on different strata and show them either separately or together using layering, sheeting, juxtaposition, alterations or permutations while allowing for groupings, hierarchies and classification of project information. The result is the presentation of the same project schedule using various compatible approaches. These analyses are detailed in the papers by Francis (2013, 2015a, 2015b).
The proposal of a new conceptual framework and study of the suitable visual parameters and their associated values in order to define a standard graphical protocol. The research methodology followed the steps recommended by Lam et al. (2012), described below.
Setting a goal. The need for visual development and standardisation is recognised by professionals in the construction industry and through many years in research and development. The development includes the improvement of visual clarity due to the complexity of the graphical representation of the schedule and the obligation to manage partial and heterogeneous data and incompatible software. Since there is no standard protocol for the graphical representation of a construction project schedule, it has previously been up to the individual planner to set his or her own standard.
Picking suitable scenarios and considering applicable approaches. The scenario selection and the consideration of applicable approaches were primarily made based on previous research, experience and trial and error over a period of 15 years, as well as through industrial collaboration on the chronographic model.
Creating evaluation design and planned analyses. In addition to applying some chronographical approaches to real projects, the colour and texture conventions have been tested in the laboratory. The laboratory tests were conducted with case studies by evaluating visual data analyses, reasoning and communication through visualisation.
4 The conceptual framework of the chronographic standard protocol
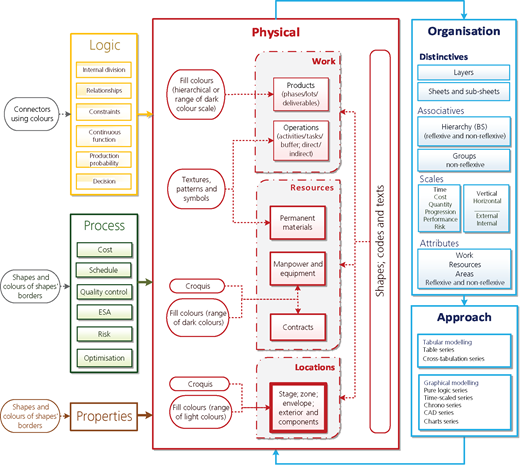
The conceptual framework of the chronographic standard protocol (Figure 1) defines the graphical protocol for the physical (productions) entities (PEs), their properties and the logical constraints which determine the relationships between these entities and the execution process. The conceptual framework also defines the organisation model and the representation approaches of these entities.
4.1 The physical entities
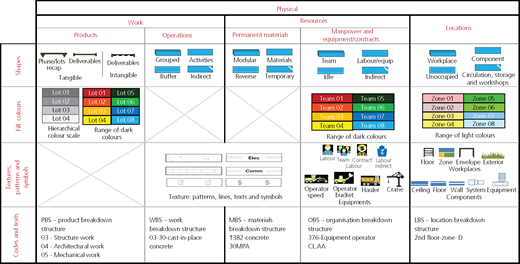
The PEs are the core of the chronographical conceptual framework. They represent all the elements required to perform the construction operations. The central box in Figure 1 and the matrix table (Figure 2) illustrate the graphical protocol for three groups of PEs: (a) work, (b) resources and (c) locations. The graphical protocol of these PEs is constructed using (i) shapes, (ii) fill colours, (iii) texture patterns and symbols and (iv) codes and texts.
The work to be executed is composed of products and operations.
Products represent tangible work packages such as construction lots, tangible deliverables such as reports and intangible deliverables such as management activities. The graphical protocol is constructed using shapes; a hierarchical or range of dark-fill colour scale; codes (PBS – product breakdown structure) and texts.
Operations consist of the project’s detailed work and execution process (e.g. direct and indirect activities and tasks, groups of activities). This group also covers the buffers that represent idle periods. The graphical protocol is constructed with shapes; texture using patterns, lines, texts and symbols; codes (WBS – work breakdown structure); and texts. Ardila and Francis (2015) demonstrate the detailed texture patterns and symbols protocol.
Resources: including permanent materials, manpower, equipment and contracts.
Permanent materials include raw materials, intermediate and assembled components and equipment that are permanently installed on the work site. Reverse logistics cycles for reused, recycling and waste materials must also be considered. This group also covers the temporary materials as scaffolding. The graphical protocol is constructed with shapes; texture using patterns, lines, texts and symbols; codes (MBS – materials breakdown structure) and texts.
Manpower and equipment which are renewable resources based on time, including (i) direct and indirect labour and teams and (ii) equipment (blade operators based on speed (e.g. grader), bucket operators based on cycle (e.g. shovel), hauler (e.g. concrete mixing truck), vertical transportation (e.g. cranes), horizontal transportation (e.g. conveyors) and equipment combining more than one operation (e.g. scrapers)). This group also covers the idle periods such as the time required for the maintenance of equipment. The graphical protocol is constructed with shapes, a range of dark-coloured fills, sketches (rough sketch/icon), codes (OBS – organisation breakdown structure) and texts.
Contracts represent the work done by others (subcontractors and fabricators). Contracts may be lump sum, unit price, build–operate–transfer, public–private partnership or any other type. The graphical protocol is constructed with shapes; a range of dark-coloured fills; sketches (rough sketch/icon); codes (OBS) and texts.
Locations: placements that include workplace, components and temporary placements.
Workplaces that represent floors, stairs, zones, envelope and exterior works.
Components represent systems, equipment and the project elements (e.g. ceiling, floor and wall).
This group also covers the temporary placements needed for circulation, storage and workshops.
The graphical protocol is constructed using shapes, a range of light-coloured fills, sketches, codes (LBS – location breakdown structure) and texts.
In summary, the PEs represent all the production elements required to perform a construction operation, such as work, resources and locations. The chronographical method is able to present these elements graphically at the same time. The protocol proposes the following graphical representation for the PEs.
Activities are coded using architectural textures, while deliverables are coded using natural textures.
Resources are associated with normal hues, saturation and brightness and subdivided into warm and cold categories.
Work locations are represented by colours with low saturation and by increasing the brightness. These light colours allow layering of other elements like textures and text (Carrier-Fraser et al., 2013)
New PEs not yet covered by this research could be added in the future without a need to modify the chronographical conceptual framework.
4.2 Organising the project information
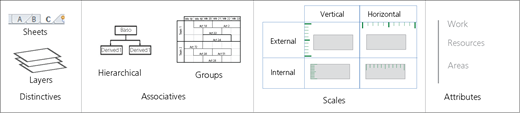
PEs can be arranged graphically using various organisational means of distinction, association, scales and attributes (Figures 1 and 3).
Distinctive organisations are manipulated in order to filter the information using layers and sheets.
Layering and sheeting: the use of multiple sheets, such as spreadsheets and sub-sheets in order to manage lots separately, as well as multiple layers, such as those used in computer-aided design (CAD), in order to plot data and constraints on different layers and help the manager to improve the graphical visualisations of the schedule.
Associative organisations serve to group or to prioritise the project information.
Hierarchy: to prioritise the project information using the hierarchical decomposition of the PEs, for example, WBS, OBS and LBS.
Grouping: the PEs can be grouped in order to categorise and report the project information in a variety of ways, for example, grouping the work by teams or by locations.
Scales entities
Scales such as time, costs, work progress, quantity, risk and performance represent the measurement unit. Scales may be vertical or horizontal, external or internal.
External scales may designate the measuring unit of the orthogonal axis system. For example, time defines the external horizontal axis of the bar chart diagram and units define the external vertical axis for linear projects.
Internal scales may designate the internal measurement of the PEs. For example, activities may have an internal scale as a function of quantities to be performed. The internal scales are specific to each PE. For example, an activity (as PE) can have its internal scale based on the amount of work to be done in m3, while a second activity can have its internal scale related to the number of units to be executed.
Chronographic modelling allows for internal divisions of activities related to the internal or the external scales. For more details of internal scale, see (Francis and Miresco 2006a, 2010).
Attributes
Attributes serve to assign one type of PE to another (a non-reflexive relation). For example, labour and permanent materials can be attributed to activities. The planner can also divide the project into different zones and assign a range of light-coloured fills to each zone. Activities can be shown graphically as boxes while the site locations can be shown as the activities’ attributes using the defined light-coloured fills.
4.3 Project planning modelling approaches
The project schedule can be modelled through tabular (Francis, 2015b) and graphical (Francis, 2015a) means (Figure 1).
Table series: a table that shows the detailed information of an element, for example, the detailed information of activities such as start dates, resources and so on.
Cross-tabulation series: a table that presents analytical interrelations between different PEs, for example, the interrelations between activities and locations.
Pure logic series: graphical methods that group deterministic or probabilistic schedule networks based on the graph theory or on simulation models.
Time-scaled series: deterministic or probabilistic time-scaled graphical schedule models.
Chrono series: scheduling based on chronographical modelling (Francis, 2004, 2013).
CAD series: a model that links a CAD with a schedule by representing time as the fourth dimension.
Chart series: a graphical representation of data using column, line, pie, bar, area, XY, bubble or radar charts.
The result is the presentation of the same project schedule through different compatible approaches (for further explanation, please see Francis (2013, 2015a, 2015b)). The planner has the ability to switch from one approach to another by changing the graphical parameters. In this way, graphic representation becomes a living, transformable image, thus assisting planners in solving problems of a variable nature, and simplifying site management while simultaneously using the visual space as efficiently as possible.
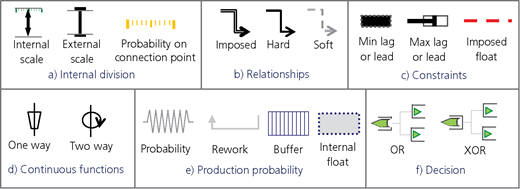
4.4 The schedule logic
The schedule logic (Francis and Miresco, 2000) indicates the relational constraints and dependencies among PEs from the same type (reflexive relation). A planner usually applies schedule logic on activities. However, the chronographic modelling permits logic between other PEs (e.g. teams, equipment, locations). The chronographic modelling allows scheduling projects using internal divisions, relationships, constraints, continuous functions, production probability and decisions (Figure 4). The graphical protocol is presented using connectors and dividers of various colours.
Point-to-point relationships
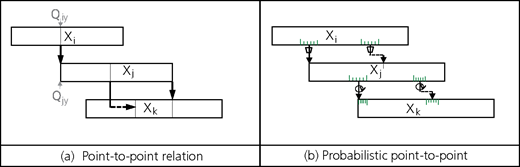
In the chronographic logic, the PEs (by default the activities) can have one or more internal divisions (Figure 4(a)) related to the internal or external scales (see point (c) in Section 4.2). Internal divisions could be probabilistic, using point-to-point probability connections (Figure 4(a)), which means that they permit gaps in the interdependence between activities allowing for flexibility in the work yet to be accomplished (for more detail, see Francis et al. (2013)).
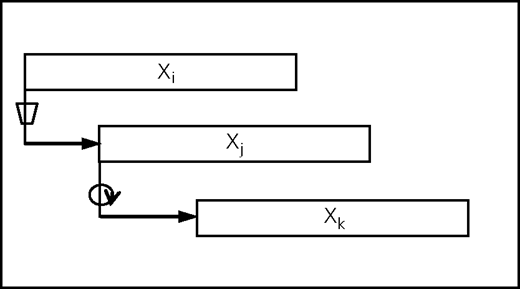
Traditional relationships (e.g. finish-to-start and start-to-start, finish-to-start and start-to-finish) are replaced by point-to-point relationships using a new type of connection called ‘temporal functions’ (Francis and Miresco, 2006). Temporal functions (Figure 4(b)) can represent a precedence relationship between activities by connecting each of them at any point, called a connection point. Connection points may be located on activities start or end dates, on any internal division (Figure 5(a)) or any point-to-point probability connection (Figure 5(b)). These dynamic relationships can represent a one-way dependency represented graphically by a trapezoid, while the successor activity depends on the production rate of the predecessor activity, as between activities Xi and Xj in Figure 5(b). They can also represent cases of two-way dependency represented graphically by a loop, while the two activities depend on each other, as between activities Xj and Xk in the same figure (Francis and Miresco, 2010).
Constraints can be added to the relationships between activities (Figure 4(c)) as minimum or maximum lead or lag or imposed float. Minimum lag and imposed float define the minimum time between the two connected points on the predecessor and successor activities. The difference is that the minimum lag imposes a minimum duration between the connected activities throughout the project starting from the planning up to the implementation, while the imposed float acts as the probability of delay of the predecessor activity and serves only to impose a minimum duration during the planning phase. This duration will be reduced if the predecessor activity is delayed during the implementation phase.
The use of multiple relations permits the tracking of interdependencies between two in-progress activities. The challenge with this approach is that it requires detailed preparation work, which is less appropriate when several activities are interlinked together throughout their execution.
Production-based dynamic function
In order to propose a practical solution, the production-based dynamic function concept (Francis et al., 2013) proposes replacing the multiple internal interdependencies between activities with one continuous mathematical function associated with a single temporal function (Figure 6). These functions contain the rules that manage the continuous interdependencies between the two in-progress activities. Functions (Figures 4(d) and 6) are represented graphically by a trapezoid in the case of one-way dependency, where activity Xi is independent activity and activity Xj is a dependent one; or by a loop in the case of two-way dependency, where the two activities Xj and Xk depend on each other throughout their execution. Any adjustment in the productivity of one affects the other.
Generalised time-scale network: execution alternative and decision point
In some situations, some decisions concerning execution alternatives can be delayed so that the evaluation is made according to the requirements of the situation. Chronographical modelling provides an appropriate response to this need by proposing the generalised time-scale network (Francis and Miresco, 2011). The temporal functions (relations between activities) contain the following.
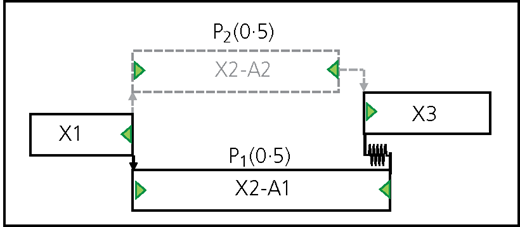
Decision points in order to allow alternative tasks. Decision points, drawn as green triangles (Figure 4(f) and Figure 7), are integrated within the activity representation. In Figure 7, the manager chooses alternative X2-A1 to be executed. This alternative is integrated into the schedule for critical-path calculation purposes. The other alternative X2-A2 is placed on hold to serve for possible implementation based on future decisions.
Probability entities that contain all time, cost and quality variations due to the chosen alternative. The probability entity adjusts the overall project duration and is represented graphically by a spring icon (Figure 4(e) and Figure 7). The probability, due to any overspending or reductions in the cost, is integrated with the probability entity.
Rework entities and buffers (Figure 4(e)) which associate uncertainties with the expected quality, whether it is due to overlapping or compression of an activity, an incomplete design, poor execution of work, or a lack of coordination on site.
4.5 Processes
Processes are systematic and continuous actions and operations directed to specific goals.
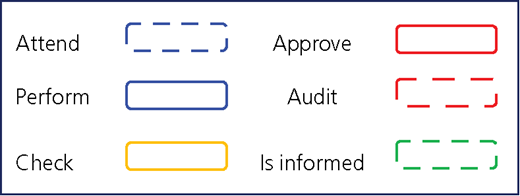
These processes can be used for scheduling and managing time, cost, quality and risk; progress monitoring and controls; material flow management, reverse flow and recycling; horizontal and vertical circulation optimisation, and so on. Processes may be graphically represented through different shapes and the border type, colour, thickness and type of line of these shapes. Figure 8 presents the graphical protocol of the quality control process.
4.6 Properties of PEs
The properties of the PEs define all the characteristics of the PEs as the necessary quantity of an activity (m3) of concrete to pour the second floor, the unit-price ($/t) for the steel reinforcing bar no. 25, the number of years of experience of an electrician, the productivity of a shovel or the surface area of the East zone. The graphical protocol of the properties can be modelled through different shapes and the border type, colour, thickness and type of line of these shapes.
5 Validation of the chronographic standard protocol
The validation of the chronographic standard protocol is a long-term process that evaluates the visual data analysis and reasoning in order to assess the suitability of the convention and its visual clarity. The process also evaluates communication through visualisation and the necessary mental effort required for finding information on the schedule.
Some elements of the chronographic standard protocol have been validated in the past. A case study was conducted in order to validate the proposed texture convention and assess its acceptability to planners (Ardila and Francis, 2015), and for a range of light and dark fill colours (Francis and Ardila, 2015).
The previous validation process was composed of two parts: a questionnaire that evaluated the suitability of the convention, followed by a case study in which the tested convention was applied to the construction schedule of a building. The validation phase evaluated the application of the proposed graphic convention. The case study was conducted in two stages by following two of the seven evaluation scenarios proposed by Lam et al. (2012), namely, the VDAR (evaluating visual data analysis and reasoning) and the CTV (evaluating communication through visualisation). The first stage assessed the suitability of the texture convention and its visual clarity and the second stage evaluated the mental effort required to find the desired information on a building construction schedule. The aim is to evaluate the capability to identify intuitively the meaning of textures and distinguish between colours, to evaluate the ease of memorisation and to express opinions and offer suggestions for improvement. The results of these case studies demonstrate clearly that the use of textures, shapes and colours helps to simplify the information search process on a schedule. Future phases will integrate the validation of the other graphic elements. The standard protocol is a long-term process that will take years of evaluation and validation through several planners and projects.
6 Conclusion
It is indisputable that construction project success depends on efficient communication of the scheduling information. Clear and effective communication of the project schedule through graphical means could help to increase project success. The necessary improvements are not a simple task, especially considering the visual complexity associated with Gantt/precedence diagrams, the most common scheduling method. The Gantt/precendence method neglects many important aspects of project management, such as limited workspaces, circulation and flow of materials. Studies on improving the graphical representations of project plans have failed to provide full graphical modelling protocols. It can be concluded that there is currently no standard protocol for the graphical representation of the schedule.
The chronographical method analyses the graphical modelling parameters for construction project scheduling and proposes a new chronographical standard protocol. The proposed protocol demonstrates the construction operations using standard shapes, sketches, codes, text, textures and colours. This paper illustrates the conceptual framework of the standard graphical protocol for the PEs, their properties, their execution processes and their logical constraints. The framework also defines the organisation models and the representational approaches. Establishing a conceptual framework and a standardised protocol will facilitate communication of the schedule information. Project planning domains will be improved. Standardisation will promote industry development and individual planners will no longer have to set their own standard.
The main limitation of the proposed method is a consensus among industry players. It will definitely require a long break-in period to improve the proposed standard. A second restriction that will limit the use of the proposed protocol is the requirement for commercial software to take possession and apply the proposed protocol. Despite this, this method remains attractive and offers a visual communication method that meets the needs of planners and resolves the limitations of existing methods. This method will also positively impact construction projects by helping planners to present their schedule in a clear and comprehensive manner in order to solve various problems; present a multitude of project types, phases or lots; and facilitate site management. It can therefore be concluded that the chronographic modelling attribute method is an appropriate decision-making tool for project managers.
The validation process was performed through case studies that evaluate the visual data and assess the necessary mental effort for finding information on the schedule. The graphical convention of textures and colours has already been validated. The results demonstrate clearly that the convention helps to simplify the information search process on the schedule. Future phases will integrate the validation of other graphic elements of this protocol. The standard protocol is a long-term process that will take years of evaluation and validation through several planners and projects.