This study aims to develop a maturity model to assess manufacturing companies’ adoption of digital technologies for energy efficiency and to formulate strategies to facilitate progress toward higher maturity levels. To achieve this goal, the study will identify and analyze the challenges inherent in the adoption and implementation of digital technologies for energy efficiency.
This study used a mixed methodology, combining analysis of the literature for building a maturity model and a questionnaire for validating the model and developing strategies for advancing maturity. The questionnaire was answered by 101 Swedish manufacturing companies.
The findings reveal that the aluminum industries and iron and steel industries exhibit higher maturity levels in adopting digital technologies. Most companies are intermediate adopters utilizing core technologies such as the Internet of things, cloud and big data for energy use monitoring, analysis and reporting. A smaller subset of companies, identified as leading adopters, reached the highest maturity level, integrating artificial intelligence, predictive analytics and machine learning into their energy management systems to optimize both production and energy use. A key challenge identified is the “lack of knowledge” regarding the adoption and implementation of these technologies.
It is essential to emphasize that the developed maturity model does not prioritize the adoption of multiple types of digital technologies. From a maturity standpoint, what truly matters is how effectively the information obtained from digital technologies is utilized in energy efficiency and energy management work to create knowledge and, thus, add value to the organization.
The maturity model and the strategies for advancing maturity related to the adoption of digital technology for energy efficiency are designed to be applicable to all types of manufacturing industries regardless of what sector or country the company is active in. The model can also be used by academia or other actors interested in evaluating the maturity level for the adoption of digital technologies for energy efficiency in companies in the manufacturing industry. The developed strategies offer guidance on determining which activities to undertake within the organization based on its current level of maturity.
This study’s main contributions are: (1) the maturity model to assess digital technology adoption for energy efficiency, (2) a set of strategies to advance maturity in adoption and (3) empirical investigation of maturity levels in the adoption of digital technologies for energy efficiency in 101 Swedish manufacturing companies.
Quick value overview
Interesting because: The current rate of energy efficiency improvement falls short of meeting the climate targets. Industry 4.0 technologies offer opportunities to unlock untapped energy efficiency potential in manufacturing, but their adoption is hindered by various challenges. This study developed a novel maturity model tailored to assess and enhance the adoption of Industry 4.0 technologies for energy efficiency. Using data from 101 Swedish manufacturing companies, it identifies key challenges and provides actionable strategies, offering both theoretical insights and practical tools to advance the green and digital twin transition.
Theoretical value: This study introduces a novel maturity model specifically designed to assess the adoption of digital technologies for energy efficiency in manufacturing. The model reveals, for example, that organizations at higher maturity levels demonstrate a stronger alignment between I4.0 technology adoption and strategic EE goals, indicating the importance of organizational readiness and cultural factors in driving innovation. Additionally, the findings highlight key challenges, such as lack of practical and theoretical knowledge, risk aversion and technological complexity, in hindering progress.
Practical Value: This study provides practical guidance for managers through a maturity model that assesses their organization’s current level of digital technology adoption. The model helps identify gaps and prioritize actions for digital transformation. It also offers tailored strategies for both initial and advanced maturity levels. For example, at the initial stages, managers are guided to focus on setting goals, evaluating the I4.0 technology potential for specific processes, allocating resources and addressing challenges. These foundational steps enable organizations to advance their maturity and effectively drive energy efficiency improvements.
1. Introduction
The European Commission (2022) stresses the importance of digital transformation of the energy system to address the climate crisis and achieve a successful energy transition. Industry 4.0 (I4.0) technologies are recognized as critical enablers of the green transition, with the European Commission promoting the twin transition—a strategic framework linking green and digital transformations—to achieve climate goals (Muench et al., 2022). This dual transition aims to achieving sustainability while leveraging I4.0 technologies such as Internet of Things (IoT), cyber-physical systems (CPS), autonomous robots, big data analytics (BDA) and artificial intelligence (AI) to optimize processes, reduce emissions and drive innovation (Muench et al., 2022).
The manufacturing industry is essential in reaching the EU vision since industry is one of the highest energy-using sectors, accounting for about 25% of the total final energy use and approximately one-fifth of EU’s total greenhouse gas (GHG) emissions (Eurostat, 2020). However, improving energy efficiency (EE) is a challenging task due to the complexity and diversity of industrial energy systems (Schulze et al., 2016), and the current rate of EE improvements falls short of what is required to meet the climate targets (IEA, 2021).
Digital technologies (DiT) present significant opportunities for unlocking untapped EE potential, fostering sustainable industrial practices (IEA, 2017; IPCC, 2022) and enhancing the performance of manufacturing industries (Hasan and Trianni, 2023). For example, Keramati Feyz Abadi et al. (2025) highlight how AI methodologies can enhance EE in manufacturing processes. Similarly, studies by, e.g. Lin and Huang (2023) and Husaini and Lean (2022) show that digitalization reduces energy use while improving EE. Moreover, when integrated with a focus on sustainability, resilience and human empowerment, I4.0 technologies can align with the principles of Industry 5.0 (EC DG RTD, 2022; Narkhede et al., 2024).
However, the potential for I4.0 technologies in manufacturing depends on internal and external factors, including production complexity, financial capacity and organizational culture (IEA, 2017). Despite their transformative potential and the ongoing trend toward increased industrial digitalization (Andrei et al., 2022), their adoption of I4.0 technologies in the manufacturing sector remains limited due to different challenges, such as technological, organizational and social (Olabi et al., 2023). Successful implementation of DiT requires a well-planned strategy that aligns with the organization’s digital transformation maturity and readiness (Mittal et al., 2018; Santos and Martinho, 2020).
While previous studies have developed maturity models for assessing I4.0 technologies implementation in manufacturing, e.g. Santos and Martinho (2020) and Schumacher et al. (2016), these models primarily focus on improving competitiveness and creating new business opportunities. To date, no maturity model specifically evaluates the adoption of DiT for EE improvements in the manufacturing sector. This lack of tools limits firms’ ability to assess their current maturity, identify challenges and strategize effectively to achieve higher maturity levels in EE improvements. To address this research gap, this study seeks to answer the following questions:
How can a maturity model be developed to assess and advance DiT adoption for energy efficiency in manufacturing companies?
What is the current maturity level of Swedish manufacturing companies in adopting DiT for EE improvements?
What are the key challenges in adopting and implementing DiT for EE?
What strategies can be formulated to facilitate progress toward higher maturity levels in adopting DiT for EE?
This study contributes to both theory and practice. The contribution to the literature is by (1) the development of a maturity model for assessing the adoption of DiT for EE and (2) identification of key challenges that hinder the adoption and implementation of DiT for EE. In regard to its practical contribution, the study and its results can benefit industrialists by (1) providing actionable strategies for advancing maturity in DiT adoption for EE, (2) empirical validation of the maturity model using data from 101 Swedish manufacturing companies, ensuring the model’s real-world relevance and applicability, and (3) a practical assessment tool to evaluate the maturity and improve EE efforts.
2. Methodology
This study used a mixed methodology, combining analysis of the literature for building a maturity model and a questionnaire for validating the model and developing strategies for advancing maturity.
Step 1: Design of I4.0EEMM
The I4.0 EE Maturity Model (“I4.0EEMM”) developed in this study is inspired by de Bruin et al. (2005) and designed to assess and guide organizations in adopting and implementing DiT for EE.
Model’s scope:
The scope of the model is to address the specific domain of I4.0 EE by helping organizations better understand their maturity level and enabling them to improve their domain maturity, particularly by identifying and addressing challenges to adoption. The model provides a description of the “as-is” position within the domain and moves into a prescriptive phase by facilitating the determination of the desired “to-be” position, as seen in de Bruin (2005). This progression from “as-is” to “to-be” is supported by the development of strategies aimed at overcoming challenges and advancing toward a higher maturity level with greater potential for EE. The model is designed to serve both academia and industry, providing a valuable tool for evaluating and advancing the adoption of DiT for EE.
Model’s composition:
This step includes the construction of the model and its content, defining what to measure and how to assess. A literature review was conducted using databases such as Scopus and Web of Science, with search streams “digital technologies,” “industry 4.0,” “energy efficiency,” “energy management,” “maturity model,” “assessment” and a combination of them, informed its development. References were also explored via the snowball method. Three relevant maturity models (Lee et al., 2017; Lichtblau et al., 2015; Schumacher et al., 2016) were identified and compared.
M1 (Lichtblau et al., 2015) integrates both technical and organizational dimensions to advance intelligent structures and resources. On the technical side, it emphasizes digitalization of processes and systems, smart products and data integration. From an organizational perspective, it highlights the role and operationalization of an I4.0 strategy and employee skills. M2 (Schumacher et al., 2016) integrates technologies, processes, products and organizational strategy and culture to drive digital transformation. Processes focus on decentralization, collaboration and efficient data flow. Organizationally, it emphasizes strategic roadmaps, leadership commitment, and fostering a culture of innovation and employee autonomy, supported by governance frameworks. M3 (Lee et al., 2017) assesses smart factory maturity through leadership, processes, and technology. From these models, three key dimensions emerged as common: a technical dimension, an organizational dimension and a dimension related to processes or products.
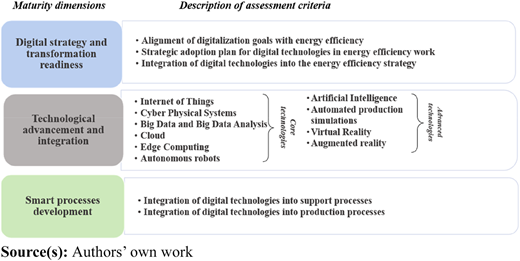
From the literature review and the analysis, the I4.0EEMM illustrated in Figure 1 was developed. Efforts were made to ensure that the model’s components and subcomponents were clear, with no overlaps or ambiguities, making them mutually exclusive and collectively comprehensive. For this purpose, the model’s content and assessment criteria were presented and discussed with professionals from one Swedish company specialized in tailored digital solutions for advanced energy management. No changes were made to the model, the content and the assessment criteria being considered satisfactory for achieving the goal. The developed model quantifies and qualifies maturity levels using three dimensions, seven assessment criteria, and four maturity levels.
2.1 Dimension 1: digital strategy and transformation readiness
This dimension measures to what extent DiT are integrated into a company’s EE strategy, as strategic alignment and transformation readiness are prerequisites for successful digital transformation and I4.0 adoption (Lichtblau et al., 2015; Santos and Martinho, 2020). Digital transformation requires a change of paradigms in organizational leadership, promoting an innovative culture and central coordination for I4.0 from a top-down perspective (Santos and Martinho, 2020; Schumacher et al., 2016). A leadership vision is needed to develop a digital strategy for investing in new DiT and driving the digital transformation toward I4.0 (Lichtblau et al., 2015). Using binary scoring, the dimension assesses three criteria. First, the alignment of digitalization goals with EE is a fundamental benchmark. This criterion evaluates the extent to which an organization’s broader digitalization goals are directly connected to enhancing EE work. Moving up the maturity scale, the presence of a strategic adoption plan for DiT in EE work becomes increasingly important. This criterion looks into the organization’s readiness through the existence of concrete plans and timelines for integrating DiT aimed explicitly at supporting EE work. At the highest level, the integration of DiT into the EE strategy highlights the organization’s strategic work and plan to leverage DiT as enablers for achieving EE goals.
2.2 Dimension 2: technological advancement and integration
This dimension measures to what extent the company has adopted core and advanced technologies. At this stage, it is crucial to identify the challenges associated with technology adoption, as these challenges will form the foundation for the prescriptive phase, where strategies for advancing toward higher maturity are developed. This maturity dimension refers to how closely internal conditions align with the principles of I4.0 (Schumacher et al., 2016). Technological advancement and integration constitute the foundation upon which organizations build their capabilities to embrace I4.0 DiT and enhance EE. This dimension measures the extent of advancement in utilizing DiT to enhance EE, by investigating what type of core and advanced DiT were adopted for EE work. The underlying technology trends of I4.0 were identified in the studies of Castelo-Branco et al. (2019) and Ghobakhloo et al. (2021). Their connection with EE work was assessed, and a list of core and advanced technologies was developed .
2.3 Dimension 3: smart processes development
This dimension measures to what extent the processes are digitally controlled with IT, making it possible for them to communicate and interact with high-level systems. This is done by investigating what DiT have been adopted in production and support processes. Connectivity and interoperability among systems, equipment and installations are crucial for developing autonomous systems and processes (Santos and Martinho, 2020). Therefore, including DiT in the production and support processes is vital for enhancing EE and developing smart processes. Studies by Kanchiralla et al. (2021) for the food and beverages industry, Haraldsson et al. (2021) for the aluminum industry and casting foundries and Kanchiralla et al. (2020) for engineering industry demonstrate the EE potential in the production processes.
Maturity levels
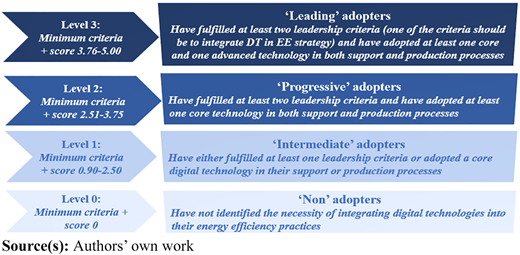
A total of four maturity levels (ML), 0 to 3, exist in the I4.0EEMM , described as follows:
ML 0 “Non-adopters”: Organizations have yet to identify the need and benefits of integrating DiT into their EE practices.
ML 1 “Intermediate adopters”: Organizations are in the early stages of adopting DiT for EE, starting to take steps toward implementation.
ML 2 “Progressive adopters”: Organizations are advancing in adopting DiT for EE, showing increased readiness and commitment.
ML 3 “Leading adopters”: Organizations showcasing innovation and a comprehensive integration of DiT into their operations.
Assessment criteria and score
A company qualifies for a specific maturity level only if it meets both the minimum criteria and the designated score. The maturity dimensions (Figure 1) are weighted using the Analytic Hierarchy Process (AHP), a widely used method for multi-criteria decision-making. Developed by Saaty (1987), AHP structures decision problems into a three-level hierarchy: goal, criteria and alternatives. The approach has been used in several previous studies investigating EE measures (Schudeleit et al., 2015).
Kuzman et al. (2013) expanded this hierarchy by introducing sub-criteria, a concept this study also adopts. In this study, AHP is used exclusively to assign weights to the maturity dimensions, utilizing a hierarchy of goal, criteria and sub-criteria. The goal is defined as “Assessing the maturity of manufacturing companies in adopting DiT for EE.” The maturity dimensions form the criteria, while the assessment criteria (AC) items serve as sub-criteria. Once the hierarchy was established, a pairwise comparison of the sub-criteria was conducted in relation to the goal, as illustrated in Equation (1).
A comparison between sub-criteria SC1 and SC2 generates a numerical value judgment SC12 which indicates the importance intensity of sub-criteria SC1 over sub-criteria SC2. The importance level of the sub-criteria is determined based on Saaty’s scale of preferences, from a score of 1 (equal) to a score of 9 (extreme). The pairwise comparison began by assigning a relative equal weight to the maturity dimension related to leadership vision and the two dimensions addressing technology adoption and smart processes development. This balance aligns with the concept of the extended energy efficiency gap (Backlund et al., 2012) which highlights the need to consider both energy management practices (represented by the strategy dimension) and technological investments (reflected in the technology and process dimension) for achieving full EE potential. Therefore, planning the use of DiT is as crucial as its implementation.
The adoption of advanced technologies like AI indicates higher maturity, as these depend on enabling technologies (e.g. Cloud) and strategic roadmaps (Mittal et al., 2018; Santos and Martinho, 2020). Reflecting this, the I4.0EEMM assigns greater weight to the adoption of advanced DiT over core DiT.
The complexity of production processes significantly impacts a company’s digitalization efforts (IEA, 2017). Given that production processes are generally more complex than support processes, the I4.0EEMM assigns greater weight to the adoption of DiT in production. The process dimension, however, is given a lower weight, as it is considered less critical indicator of maturity compared to the strategy and technology dimensions.
The pairwise comparison SCij needs to fulfill the Equation (2) condition.
The comparison matrix can therefore be rewritten according to Equation (3).
The weight of each sub-criteria is then calculated by normalizing each of the elements in the matrix.
The consistency of the evaluation is tested by calculating the Consistency Ratio (CR) according to Equation (4), where CI is calculated according to Equation (5). The Random Index (RI) is decided according to the number of sub-criteria. For a sample size of seven sub-criteria, an RI of 1.32 was used (Saaty, 1987).
The sum of each row in the normalized comparison matrix is divided by the weight values of the sub-criteria to which they are bound to form a consistency column. λmax is calculated by averaging the consistency column. If CR ≤ 0.1, the evaluation is considered consistent and can be used for further evaluation. Based on the comparison matrix, the normalized comparison matrix and the consistency table were calculated following Equation (4) and Equation (5), and a CR of 0.065 was obtained. Since this CR is lower than 0.1 the weightings shown below are consistent, and the weightings can be used in the model.
AC1 “Incorporation of DiT in EE strategy”: 0.41
AC2 “Adoption of advanced technology”: 0.23
AC3 “Adoption of core technology”: 0.16
AC4 “Occurrence of strategy for what digital technology to work with in the upcoming years”: 0.08
AC5 “Goals for energy efficiency supported by DiT”: 0.05
AC6 “DiT implemented in production processes”: 0.04
AC7 “DiT implemented in support processes”: 0.03.
By summarizing the weights of each sub-criteria, the dimension of “Digital strategy and transformation readiness” accounts for 54% of the maturity level. The “Technological advancement and integration” dimension accounts for 39% and the last dimension, “Smart processes development” accounts for 7%. Figure 2 illustrates the minimum criteria and scores for each level.
The assessment of a company’s maturity is conducted based on the criteria established for each dimension and the associated scores, followed by normalizing the data sets to a range of 0–5. The maturity level is visualized via box plots, and the adoption of different technologies is analyzed.
Step 2: Validation of the I4EEMM with Swedish manufacturing companies
In this step, the I4.0EEMM was validated via a questionnaire that investigated the maturity in the adoption of DiT for EE in Swedish manufacturing companies (NACE C.10-C.33), subject to the requirement to undergo an energy audit every four years according to the EE Directive (European Commission, 2012) and which have reported their energy audits to the Swedish Energy Agency between 2017 and 2021. Below is the total population of 532 companies, categorized by their dominating primary activity within each investigated sector and corresponding NACE codes:
Textile (C13-C15): 7
Printing (C18): 7
Aluminum (C24.4-C24.5): 10
Pharma (C21): 11
Furniture (C31): 12
Iron and steel (C24.1-C24.3): 18
Non-metallic minerals (C23): 22
Wood (C16): 29
Plastics (C22): 43
Pulp and paper (C17): 45
Chemical (C20): 49
Food (C10-C11): 64
Engineering (C25-C30, C32): 215
The questionnaire consisted of nine questions and aimed to investigate various aspects in manufacturing companies, as follows: 1) digital strategy and transformation readiness for adopting DiT for EE, whether it’s objective-driven (short-term), or part of a strategic plan (long-plan), 2) the types of DiT adopted in the company and whether it is adopted in support and/or production processes, and 3) what challenges were encountered during the adoption and implementation of DiT. The questionnaire can be found in the Appendix.
The questionnaire underwent validation by fellow researchers to ensure appropriate formulation and overall applicability. The questionnaire was then sent to manufacturing organizations via email in two rounds, November 2022 and May 2023. During the data analysis, responses were carefully reviewed to identify and eliminate any contradictory answers. To enhance response accuracy, the free-text answers were cross-checked with ratings given by companies, and if there was a discrepancy between the free-text answer and the corresponding rating question, the rating answer was adjusted based on the free-text response. Challenges reported by companies were categorized following the theoretical frameworks developed by Cagno et al. (2013) and Johansson and Thollander (2018).
3. Results and analysis
The I4.0EEMM underwent validation through questionnaires sent to 358 companies, with 102 responses, yielding a 28% response rate. After excluding one company due to contradictory answers, 101 companies were analyzed. The questionnaire response rates, listed from the highest to the lowest by sector, are illustrated below:
Iron and steel: 56%
Pharma: 55%
Aluminum: 40%
Furniture: 33%
Pulp and paper: 33%
Printing: 29%
Textiles: 29%
Non-metallic minerals: 27%
Food and beverages: 19%
Plastics and rubber: 14%
Engineering: 13%
Chemical: 8%
Wood: 7%.
3.1 Maturity levels of Swedish manufacturing sectors for the adoption of digital technologies for energy efficiency
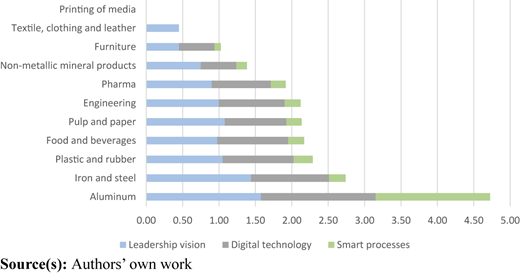
The applicability of the I4.0EEMM to identify the maturity level in the adoption and implementation of DiT for EE was validated via the questionnaire answered by 101 manufacturing companies. Figure 3 presents the contribution of each dimension to the overall maturity level of each sector, calculated as the average score of individual companies within each sector. Due to low response rates, the chemical and wood industries were excluded from the analysis. The aluminum sector emerged with the highest maturity score, followed by iron and steel.
Twelve companies fall under the “non-adopters” level, scoring 0 in maturity. They have not adopted DiT or met any criteria for the “digital strategy and transformation readiness” dimension. Two companies acknowledge the importance of digitalization for EE work but provided insufficient details for further analysis.
At the “intermediate adopters” level (Level 1), 56 companies score between 0.90 and 2.30, with a mean of 1.66. Most companies have adopted core DiT, such as IoT, CPS, cloud, big data analysis and edge computing to monitor energy use, collect data and support analysis and reporting, facilitating informed decision-making.
The “progressive adopters” level includes 27 companies at maturity level 2, with scores ranging between 2.95 and 3.93. One company exceeded the score limit (3.93 vs 3.75) and was relegated due to unmet minimum criteria. All companies at this level have adopted at least one core DiT, with nearly all meeting assessment criteria in the “digital strategy and transformation readiness” dimension. Most prioritize real-time monitoring and data collection, with some gathering data at both process and machine levels, while others combine monitoring and data collection with process control to manage and optimize energy usage. Others employ process analysis tools to assess performance against targets and streamline their operational processes for improved energy management.
In the “leading adopters” level, six companies were identified, with five achieving the highest maturity score of 5.00. Despite their score of 5.0, these companies continue advancing their digitalization efforts, adopting a wide range of both core and advanced technologies, such as AI, automated production simulations, augmented reality and virtual reality in support and production processes. Notably, these companies combined industrial control systems with DiT, enabling control over production processes, process optimization, efficiency improvements, predictive maintenance and production quality and planning. DiT provide real-time monitoring, data collection and detailed energy use analysis at the process level, while predictive analytics manage equipment status, thereby reducing downtime, risks and costs. Beyond EE, these technologies also enhance manufacturing control, process optimization and big data analytics, improving production quality, asset management and utilization in line with industry best practices.
Key digitalization objectives for EE include online monitoring of energy usage, identifying high-savings potential areas and setting key performance indicators. Several companies across different maturity levels aim to inform and educate their process operators about energy performance. For instance, a pulp and paper company with the highest maturity level seeks to enhance operators’ use of process computers for paper machine control, though varying energy consumption profiles across products create optimization challenges.
Over the next five years, several companies intend to implement virtual “operating technicians” to monitor energy usage and detect anomalies in support processes. Other goals include improving data collection for better decision-making and energy optimization, alongside expanding VR/AR and AI/machine learning technologies for broader operational deployment.
3.2 Challenges reported in the adoption and implementation of digital technologies for energy efficiency in the Swedish manufacturing sectors
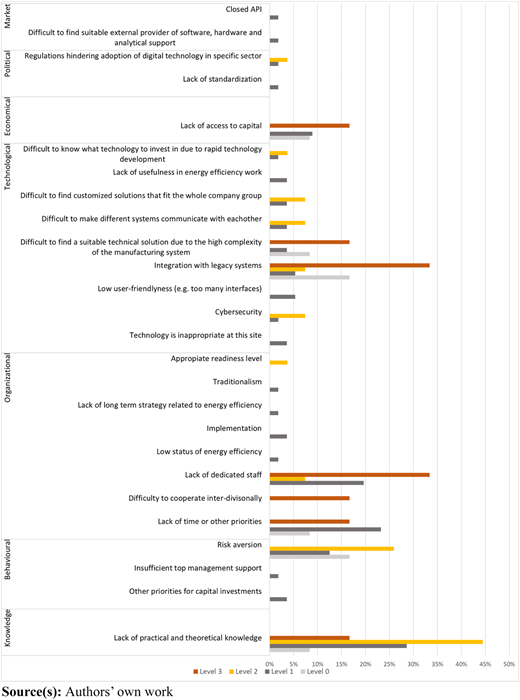
The most common challenges in integrating DiT for EE are “lack of practical and theoretical knowledge” (31 companies), “risk aversion” (17 companies), “lack of dedicated staff” (16 companies), “lack of time or other priorities” (14 companies) and integration with legacy systems (11 companies). Risk aversion, reported by one-fifth of companies, stems from difficulties in quantifying financial benefits like energy savings, leading to hesitancy in making investments due to perceived long payback periods. The lack of dedicated staff reflects organizational limitations in allocating full-time roles for EE, with gaps in IT and automation departments crucial for DiT deployment. “Integration with legacy systems” is the most frequently cited technological challenge. Eight companies mentioned that their legacy systems pose difficulties in adopting new DiT due to compatibility issues between existing and new technology.
Figure 4 illustrates the percentage of companies at each maturity level identifying specific challenges. Several of the most mentioned challenges (“lack of practical and theoretical knowledge,” “lack of time or other priorities,” “lack of access to capital,” “difficulties finding suitable technical solutions due to complex systems” and “integration with legacy systems”) are common across companies at all maturity levels. Notably, the challenge “lack of practical and/or theoretical knowledge” is more prevalent at maturity level 2, possibly due to the complexities of integrating DiT in EE becoming evident at this stage. Additionally, DiT may have been implemented rapidly and extensively, surpassing the practical and theoretical knowledge of the organization’s staff. By level 3, companies appear to have gained experience in addressing these gaps, but as they advance, the lack of dedicated staff emerges as a more prevalent challenge compared to lower levels, as managing advanced systems requiring specialized expertise. This progression underscores the need for organizations to prioritize workforce development and retention to sustain digital transformation efforts.
4. Discussion
4.1 Adoption of digital technologies and challenges in Swedish manufacturing sector
The findings of this study reveal distinct patterns in DiT adoption across the four maturity levels. At the non-adopters’ level (L0), companies have not adopted any DiT, suggesting underlying barriers such as financial constraints, organizational inertia or limited awareness of digitalization benefits. Interestingly, two companies acknowledge the importance of digitalization for EE but lack concrete action, reflecting significant knowledge gaps. This highlights that companies at L0 face an inertia stemming from resource limitations and lack of strategic prioritization. This observation aligns with IVA (2023) which identifies knowledge gaps as critical barriers to digital transformation in Swedish industry, particularly in the early stages.
At the intermediate adopters’ level (L1), companies have adopted core technologies such as IoT, CPS, cloud computing and big data analysis to monitor energy use, collect data and facilitate analysis and reporting. This reflects a foundational stage where digitalization serves primarily as a tool for real-time energy monitoring and reporting. Similar findings were reported by Tan et al. (2017), who highlight their role as a key enabler for EE analysis. The widespread adoption of core technologies also indicates that these technologies have achieved desirable levels of maturity and compatibility necessary for efficient industrial applications, as seen also by Ghobakhloo and Fathi (2021). However, the limited progression beyond monitoring highlights a potential bottleneck, where companies reported challenges in advancing to more complex optimization levels due to insufficient knowledge, organizational readiness and risk aversion. Risk aversion is a significant challenge, as companies are hesitant to invest in DiT due to difficulties in estimating the financial benefits, such as energy savings, which leads to long payback periods for such investments. The knowledge gap regarding the potential energy savings offered by I4.0 technologies is also emphasized by the International Energy Agency (IEA, 2017).
At the progressive adopters’ level (L2), companies advance beyond monitoring and data collection to actively incorporate process control, optimization and performance analysis for energy management work. This novel finding suggests that companies at L2 take a step forward in digital maturity, leveraging digital tools to streamline operations and achieve measurable EE. This progression reflects a shift in organizational priorities that evolves as digital maturity increases. The use of process analysis tools aligns with Tesch da Silva et al. (2020), who emphasize the role of advanced systems in achieving operational efficiency. However, challenges around integrating DiT into energy management at this stage reflect the “implementation gap” described by Cagno et al. (2015). This gap underscores the complexity of balancing technological adoption with organizational capacity, which becomes more evident at intermediate maturity stages. These findings suggest that while existing literature acknowledges the importance of process optimization, it has underexplored the role of organizational readiness and internal capacity in bridging the “implementation gap”.
Companies in L2 frequently report a “lack of practical and theoretical knowledge” as a primary obstacle, followed by “risk aversion.” This finding aligns with IVA (2023) and Holsapple (2004), who emphasize the importance of practical skills (e.g. system implementation) and theoretical understanding (e.g. system design) for successful digital transformation. The persistence of these challenges at L2 suggests that companies struggle to fully integrate DiT into their operations, lacking the expertise to fully leverage them. This gap can slow progress and highlights the need for targeted training initiatives, as emphasized by Hecklau et al. (2016) and Motyl et al. (2017).
At the leading adopters’ level (L3), companies integrate both core and advanced technologies in support and production processes and have clear goals and strategies. These organizations go beyond monitoring and optimization to enhance process control, predictive maintenance and production quality. Notably, AI has been adopted primarily in the production process, emphasizing the role of AI techniques, such as machine learning and deep learning, in enhancing production efficiency and cost reduction in continuous process industries, as discussed by Meng et al. (2018). This novel finding complements Hasan and Trianni’s (2023) work, which underscores AI’s contribution to EE in support processes. At this advanced stage, “integration with legacy systems” and “lack of dedicated staff” emerge as major challenges. This highlights the need for customized solutions and collaboration with external providers, particularly in complex production environments. However, companies report that finding a suitable technical solution remains a significant barrier.
4.2 Strategies for advancing maturity
Two distinct categories of strategies for advancing maturity in the implementation of DiT for EE work were developed. However, taken together, these strategies aim to support a company in its journey from initial adopters to mature adopters. These strategies were developed based on the empirical findings of the study, specifically the maturity levels (Section 3.1) and the challenges identified by responding companies (Section 3.2). The first strategy, intended for initial maturity levels (L0 and L1), follows a more linear approach, moving through distinct phases to build a solid foundation and culture for digital maturity in their EE work. This linear approach aligns with established maturity frameworks such as ISO 50001, which emphasize incremental progression to achieve organizational transformation (International Standard Organization, 2017). Culture and education are put forward by Motyl et al. (2017) as the critical components of digital transformation.
In contrast, the second strategy, designed for advanced maturity levels (L2 and L3), adopts a more iterative and continuous approach. This approach focuses on continuous improvement, creation of knowledge and collaboration in an iterative and continuous approach. The need for iterative strategies is particularly evident at L2 and L3, where companies have already adopted technologies, but report challenges related to process complexity, system integration and knowledge gaps.
Each strategy provides a set of recommendations that aim to empower organizations to make informed decisions based on their current maturity levels and desired outcomes.
Strategy for initial maturity levels
This strategy addresses findings from companies in the initial maturity levels, where the absence of a clear digitalization strategy for EE was observed.
Set EE goals and integrate DiT in the EE strategy: Set clear, measurable EE goals that align with the organization’s overarching vision on sustainability and efficiency targets. Develop a strategic roadmap that incorporates DiT into the long-term EE strategy, including emerging technologies. This approach aligns with the findings of Thollander and Ottosson (2010) emphasizing the positive impact of a strategic approach on the success of EE projects.
Understand DiT potential for specific processes: This step aims to overcome the “risk aversion” challenge reported by the companies from L1. In order to understand their potential, it first needs to determine where DiT can be applied within the organization, considering both support and production processes. Insights from Hasan and Trianni (2023) can guide this assessment. Understanding the potential of DiT in manufacturing processes involves assessing how DiT can contribute to EE in these specific processes. However, companies often struggle to identify this potential due to a lack of knowledge, which can hinder investment in DiT, as noted also by Jasonarson (2020) and leading to risk aversion, as reported by the studied companies. Identifying the practical and theoretical knowledge required to operate and understand the potential of DiT is essential, and this was reported by the investigated companies as the most significant challenge. For instance, the study of Motyl et al. (2017) stresses the significance of digital skills in deploying I4.0 technologies. Additionally, Andrei et al. (2022) shed light on the knowledge requirements and the knowledge creation process for adopting digital innovations in energy management within manufacturing industries.
Allocate resources (internal and external): This step aims to overcome the “lack of staff” reported by the L1 companies. Allocate necessary resources, including dedicated staff, capital and time, to support the integration of DiT into the processes. The lack of dedicated staff is the third most mentioned challenge in the responding companies, with a higher frequency at the highest maturity level. Shipley et al. (2002) highlight that the lack of dedicated staff is a common challenge for EE, especially in smaller companies. Furthermore, Buer et al. (2021) argue that the lack of dedicated staff limits a company’s ability to invest in DiT. Additionally, at this point, it is important to assess the necessity of external resources, such as service and hardware providers, to ensure a smooth integration process. However, it’s worth noting that the responding companies reported a challenge related to the difficulty of finding suitable external providers for software, hardware and analytical support.
Identify and address challenges to DiT adoption: This study highlights several critical challenges to the adoption and implementation of DiT for EE. Once a company has established a clear strategy, identified the potential of DiT for its processes, and allocated the necessary resources, it becomes essential to systematically identify and address the challenges. This step ensures that barriers are recognized early and mitigated effectively, enabling smoother implementation and greater impact. Companies have reported the “lack of practical and theoretical knowledge” as the primary challenge hindering the adoption and implementation of DiT in the responding companies. This finding aligns with the challenges highlighted in the IVA’s (2023) barometer, emphasizing the difficulty faced by research-intensive companies in Sweden to find the right competence in R&D, particularly in digitalization and green transition. They claim that access to competence is the most important factor for digitalization and green transition. The lack of knowledge identified in this study refers to an almost equal extent to both practical knowledge and theoretical knowledge. Practical knowledge is understood as the skills to implement the DiT and is site-specific, i.e. contextual, while theoretical knowledge is more general and involves an understanding of technologies, system designs, and models that can be used to comprehend processes (Holsapple, 2004). Competencies related to process knowledge, willingness to engage in constant learning, teamwork, data analysis and understanding of cyber security are examples highlighted in several previous studies regarding I4.0 competencies (Hecklau et al., 2016; Szabó et al., 2023), which can help overcome some of the challenges reported by the companies.
Risk aversion is the second most mentioned challenge among responding companies. Many companies find it challenging to demonstrate the energy savings resulting from DiT adoption, making investments in DiT for EE appear unprofitable. This is partially aligned with Olabi et al. (2023), which highlights cost as one of the primary economical barriers to the adoption of DiT in the energy sector. This barrier consists partly of the aspect that the introduction and use of DiT requires large investments in hardware, software and personnel over time, and partly of difficulties in determining return on investment.
Strategy for advanced maturity levels
Training initiatives: Train existing staff and, if required, hire new personnel who possess the required practical and theoretical knowledge. Continual training and knowledge creation are essential to keep employees updated on evolving technologies and practices. This step addresses the challenges identified at Levels 2 and 3, where companies reported difficulties in managing advanced systems due to knowledge gaps. Training staff in the new skills needed for the I4.0’s DiT is discussed also by Motyl et al. (2017), who emphasize the changing educational needs of students and the industrial workforce. In particular, Motyl et al. (2017) concluded with the necessity for universities to develop a more comprehensive and well-structured understanding of fundamental concepts related to DiT, including potential revisions to educational content, especially in technical areas.
Understanding of own processes: At this stage, a fundamental understanding of own processes becomes crucial. Begin by focusing on converting data into actionable information that aids in comprehending own processes and supports decision-making. Analyzing and using information derived from DiT enhances own process understanding and facilitates the achievement of EE goals. This step is supported by the empirical findings at Level 3, where companies combine monitoring, process control and optimization to understand and optimize processes. However, finding a suitable technical solution for the digitalization of the production processes can be challenging due to the inherent complexity of manufacturing processes. These processes often feature demanding operating conditions (e.g. in the iron and steel sector) and vary across different manufacturing sectors, making EE improvements within such contexts challenging Schulze et al. (2016) . Therefore, the challenge when adopting DiT in complex processes is more related to the processes themselves rather than the DiT, as highlighted also by Jasonarson (2020).
Develop customized solutions: Recognize the necessity for customized solutions, particularly within company groups or complex organizational structures and facilities, to maximize efficiency and impact, as also noted by Mittal et al. (2018). This strategy directly responds to the findings that companies at higher maturity levels struggle with ‘integration with legacy systems and process complexity. It’s important to acknowledge that, at advanced levels, the responded companies have reported this step as a challenge in further enhancing DiT. One approach to address this challenge is to promote inter-divisional collaboration by establishing teams dedicated to continuous development and cross-functional support. Furthermore, multi-disciplinary teams consisting of members with different functional roles or skills within the same organization can help strengthen the implementation of DiT and enhance EE work. However, when implementing DiT for EE in high maturity companies with complex manufacturing processes, the development of trans-disciplinary teams is essential. This is because internal experts must collaborate with external service providers to create customized solutions, as also discussed by Andrei et al. (2022).
4.3 Limitations and future studies
While the I4EEMM developed in this study provides valuable insights into the maturity levels and challenges of adopting DiT for EE in Swedish manufacturing, it is important to acknowledge certain limitations of the research.
This study did not conduct statistical validation tests to evaluate its statistical robustness. While the Analytic Hierarchy Process was used to weigh dimensions and sub-criteria, further statistical tests for validating the model’s comparability of results across different contexts remain outside the current scope. These validation steps are planned for future studies to enhance the model’s applicability and generalizability.
It is essential to emphasize that the developed model does not prioritize the adoption of multiple types of DiT. From a maturity standpoint, what truly matters is how effectively the information obtained from the DiT is utilized in EE and energy management work to create knowledge and, thus, add value to the organization.
The data collection was limited to Swedish manufacturing companies. Although the results may offer valuable insights for countries with similar technological, regulatory, and cultural conditions, broader generalizations to other countries or regions may not be appropriate without additional context-specific validations.
The study focused on evaluating maturity in adopting DiT for EE rather than quantifying the direct energy savings or cost-effectiveness of these technologies. The long payback periods and difficulties in measuring financial benefits, as reported by companies, highlight the need for future research to link digitalization maturity to specific energy and financial outcomes.
5. Conclusion
This study’s results provide valuable insights into the maturity levels, dimensions and challenges associated with the adoption of DiT for EE in the Swedish manufacturing sector. Through a questionnaire responded by 101 manufacturing companies, the applicability of the developed I4.0EEMM was successfully validated. The strategies outlined in this study provide a roadmap for both linear and iterative approaches, enabling organizations to advance to higher maturity levels and streamline their efforts toward the integration of DiT for EE.
The analysis revealed companies at different levels of maturity in the adoption of DiT for EE. The findings indicate that the majority of companies fall into the “intermediate adopters” level, demonstrating moderate levels of maturity in the adoption of DiT. These companies primarily focus on using DiT for monitoring energy use, data collection, and reporting. A smaller proportion of companies are classified as “progressive adopters” and “leading adopters,” exhibiting higher levels of maturity in their adoption of DiT. They prioritize real-time monitoring, data analysis, process optimization, and predictive maintenance, leveraging DiT to enhance production quality, asset management and operational efficiency.
The analysis also identifies key challenges faced by companies across different maturity levels. The top challenges identified include “lack of practical and theoretical knowledge,” “risk aversion” and “lack of dedicated staff.” This highlights the importance of meticulous resource inventory and allocation when proposing investments in DiT for EE. Companies at lower maturity levels primarily struggle with initial adoption challenges, while those at higher maturity levels face challenges associated with advancing their DiT utilization and improving EE further.
The study is unique, as to the author’s knowledge, no previous research has developed a similar model, nor has investigated the adoption of DiT for EE in the manufacturing industry in Sweden, highlighting the challenges for adoption and developing strategies for advancing maturity. The results provide an important indication of the manufacturing industry’s current state in utilizing DiT for EE purposes, and the model serves as a valuable tool for future research into EE and digitalization.
This work was supported by the Graduate School in Energy Systems (FoES), funded by the Swedish Energy Agency, and we extend our gratitude to them. We also express our sincere thanks to the anonymous reviewers for their valuable feedback, which has helped improve this article. Special thanks go to students Wilma Gustafsson and Erica Dellien, who supported the authors with data collection from companies that reported their energy audits between 2017 and 2020.
Funding: This work was supported by the Graduate School in Energy Systems (FoES) and the Division of Energy System from Linköping University and funded by the Swedish Energy Agency (research project number 46058-1, Dnr 2018-001887).
Credit author statement: A1: Conceptualization, Methodology, Formal analysis, Investigation, Writing – Original Draft, Writing – Review and Editing, Validation, Visualization, Project administration. A2: Conceptualization, Methodology, Formal analysis, Investigation, Writing – Original Draft, Writing – Review and Editing, Validation, Visualization.
Data availability: The questionnaires have been collected with the stipulation that the names of the companies will remain anonymous, and their answers will not be published. Public documents are accessible via the references given in the paper.
Declaration: The authors declare that they have no known competing financial interests or personal relationships that could have appeared to influence the work reported in this paper.