
1-20 of 18011
Follow your search
Access your saved searches in your account
Would you like to receive an alert when new items match your search?
Journal

Publishes a broad coverage of original research relating to the management of manufacturing technology combining theory with practical application.
Journal Articles
Journal of Manufacturing Technology Management (2026) 37 (9): 173–193.
Published: 20 August 2026

in Investigating the state-of-the-art and challenges of artificial intelligence for production management in Italian manufacturing SMEs
> Journal of Manufacturing Technology Management
Published: 20 August 2026
Figure 1 The actionable conceptual framework: linking TOE conditions, AI applications, and operational implications A table comparing organizational challenges, AI application prioritization, and operational implications for SME adoption. A table with three main columns: Inputs, Processes, and... More about this image found in The actionable conceptual framework: linking TOE conditions, AI application...
Journal Articles
Journal of Manufacturing Technology Management 1–18.
Published: 13 August 2026
Includes: Supplementary data
Journal Articles
Journal of Manufacturing Technology Management 1–21.
Published: 13 August 2026
in Collaboration network structure and green innovation efficiency of manufacturing firms: the mediating roles of technological niche overlap and breadth
> Journal of Manufacturing Technology Management
Published: 13 August 2026
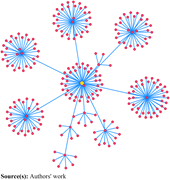
Figure 1 Illustration of network accessibility A diagram illustrating network accessibility with interconnected nodes and clusters. A diagram of network accessibility. The diagram represents a network structure with interconnected nodes and clusters. At the center of the diagram is a yellow no... More about this image found in Illustration of network accessibility A diagram illustrating network acc...
in Collaboration network structure and green innovation efficiency of manufacturing firms: the mediating roles of technological niche overlap and breadth
> Journal of Manufacturing Technology Management
Published: 13 August 2026
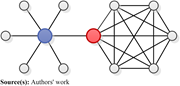
Figure 2 Illustration of network interconnectedness A diagram illustrating network interconnectedness. The diagram illustrates network interconnectedness. It features a central red node connected to a blue node on the left and a complex cluster of gray nodes on the right. The blue node is conn... More about this image found in Illustration of network interconnectedness A diagram illustrating networ...
in Collaboration network structure and green innovation efficiency of manufacturing firms: the mediating roles of technological niche overlap and breadth
> Journal of Manufacturing Technology Management
Published: 13 August 2026
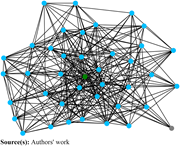
Figure 3 Illustration of network independence A network diagram with interconnected nodes. A network diagram featuring numerous interconnected nodes. The nodes are represented by circles, with the majority being blue, one green, and one gray. The blue nodes are connected by black lines, indica... More about this image found in Illustration of network independence A network diagram with interconnect...
in Collaboration network structure and green innovation efficiency of manufacturing firms: the mediating roles of technological niche overlap and breadth
> Journal of Manufacturing Technology Management
Published: 13 August 2026
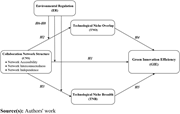
Figure 4 The conceptual framework A conceptual framework diagram illustrating the relationships between environmental regulation, collaboration network structure, technological niche overlap, technological niche breadth, and green innovation efficiency. A conceptual framework diagram illustrat... More about this image found in The conceptual framework A conceptual framework diagram illustrating the...
in Collaboration network structure and green innovation efficiency of manufacturing firms: the mediating roles of technological niche overlap and breadth
> Journal of Manufacturing Technology Management
Published: 13 August 2026
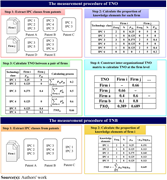
Figure 5 The measurement process of TNO and TNB A diagram illustrating the measurement procedures of TNO and TNB. The diagram is divided into two main sections: the measurement procedure of TNO and the measurement procedure of TNB. The TNO section is further divided into four steps. Step 1 inv... More about this image found in The measurement process of TNO and TNB A diagram illustrating the measur...
in Collaboration network structure and green innovation efficiency of manufacturing firms: the mediating roles of technological niche overlap and breadth
> Journal of Manufacturing Technology Management
Published: 13 August 2026
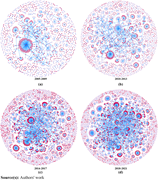
Figure 6 Evolutionary trend of collaborative innovation network of manufacturing enterprises Four circular network graphs depict the evolutionary trend of collaborative innovation networks of manufacturing enterprises over different time periods. Four circular network graphs illustrate the evo... More about this image found in Evolutionary trend of collaborative innovation network of manufacturing ent...
in Collaboration network structure and green innovation efficiency of manufacturing firms: the mediating roles of technological niche overlap and breadth
> Journal of Manufacturing Technology Management
Published: 13 August 2026
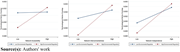
Figure 7 The moderating effect of ER on CNS and TNO Three line graphs showing the moderating effect of environmental regulation on network accessibility, interconnectedness, and independence. The image contains three line graphs side by side, each illustrating the moderating effect of environm... More about this image found in The moderating effect of ER on CNS and TNO Three line graphs showing the...
in Collaboration network structure and green innovation efficiency of manufacturing firms: the mediating roles of technological niche overlap and breadth
> Journal of Manufacturing Technology Management
Published: 13 August 2026
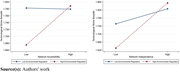
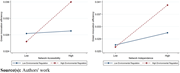
Figure 8 The moderating effect of ER on CNS and TNB Two line graphs depict the moderating effect of environmental regulation on network accessibility and network independence with technological niche breadth. Two line graphs depict the moderating effect of environmental regulation on network a... More about this image found in The moderating effect of ER on CNS and TNB Two line graphs depict the mo...
in Collaboration network structure and green innovation efficiency of manufacturing firms: the mediating roles of technological niche overlap and breadth
> Journal of Manufacturing Technology Management
Published: 13 August 2026
Figure 9 The moderating effect of ER on CNS and GIE Two line graphs showing the moderating effect of environmental regulation on network accessibility and network independence with green innovation efficiency. The image contains two line graphs side by side. The left graph illustrates the rela... More about this image found in The moderating effect of ER on CNS and GIE Two line graphs showing the m...
in Why more automation does not guarantee invention in advanced smart factories
> Journal of Manufacturing Technology Management
Published: 13 August 2026
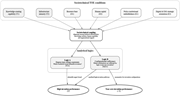
Figure 1 A sociotechnical TOE framework for invention performance in advanced smart factories. Note: Figure 1 presents the conceptual framework only. It does not report empirical configurations; the NCA and fsQCA results are reported in Tables 2–4. Source: Authors’ own work A diagram of a s... More about this image found in A sociotechnical TOE framework for invention performance in advanced smart ...
in Why more automation does not guarantee invention in advanced smart factories
> Journal of Manufacturing Technology Management
Published: 13 August 2026
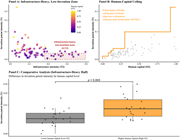
Figure 2 Infrastructure–capability mismatch, human-capital ceiling and within-cohort verification (Panels A–C). Note: Panels A–C display Y on a square-root scale for readability; cut-offs and case count use raw full-sample values (N = 85): T2 ≥ P75 = 0.361, Y ≤ P40 = 0.005, and n = 13 ( Table S6 ). These annotations are descriptive; inference relies on NCA ceiling tests ( Table 2 ) and fsQCA solutions ( Tables 3–4 ). Panel B shows CE-FDH for visualisation, whereas inference uses CR-FDH ( Table 2 ). Panel C compares Y between High-O2 and Low-O2 firms within the infrastructure-heavy half (T2 ≥ median[T2]), using a within-half median split (Wilcoxon rank-sum test, p = 0.003; Table S6 ). Source: Authors’ own work Three graphs showing relationships between infrastructure intensity, human capital, and invention patent intensity. The figure contains three panels with invention patent intensity (Y) on the vertical axis. Panel A plots infrastructure intensity (T2) against Y, colours observations by human capital (O2), and marks the descriptive infrastructure-heavy, low-invention zone (n = 13). Panel B plots O2 against Y and overlays the CE-FDH step ceiling for visualisation; inferential NCA conclusions use the CR-FDH results reported in Table 2. Panel C compares Y between lower- and higher-O2 firms within the infrastructure-heavy half and reports a Wilcoxon rank-sum p-value of 0.003. The figure is a visual diagnostic/triangulation display; the main inferential evidence is reported in Table 2 and Tables 3–4. More about this image found in Infrastructure–capability mismatch, human-capital ceiling and within-cohort...

in Inter-organizational governance as a missing layer in additive manufacturing adoption: an incentive-based analysis of barrier structures
> Journal of Manufacturing Technology Management
Published: 13 August 2026
Figure 1 Ordonomic governance matrix. Source: Authors' own work, based on Pies et al. (2009 , p. 389) A diagram of the ordonomic governance matrix. The diagram is divided into four quadrants based on dilemma structure and credibility-enabling services. The vertical axis represents dilemma structure, with ‘Many-sided’ at the top and ‘One-sided’ at the bottom. The horizontal axis represents credibility-enabling services, with ‘Self Commitment’ on the left and ‘Commitment Service’ on the right. The top-left quadrant is labeled ‘Collective self-commitment (CSC)’ and describes unilateral action being penalized, actors committing simultaneously for joint rule-setting, and reducing free-riding and stabilizing coordination. The top-right quadrant is labeled ‘Service for collective self-commitment (SCC)’ and describes collective action failing without an enabler, the intermediary organizing and safeguarding joint commitments, and lowering coordination costs and sustaining participation. The bottom-left quadrant is labeled “Individual self-commitment (ISC)” and describes a situation in which partners fear opportunistic behavior. The focal actor therefore voluntarily constrains its own behavior, thereby building trust and enabling collaboration. The bottom-right quadrant is labeled “Service for individual self-commitment (SIC)” and addresses situations in which credibility is difficult to signal unilaterally. A service provider supplies verification mechanisms that strengthen credible signaling and reduce uncertainty. More about this image found in Ordonomic governance matrix. Source: Authors' own work, based on Pies
in Inter-organizational governance as a missing layer in additive manufacturing adoption: an incentive-based analysis of barrier structures
> Journal of Manufacturing Technology Management
Published: 13 August 2026
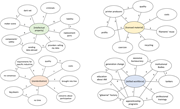
Figure 2 GABEK-WinRelan semantic network structures of AM barrier constellations. Source: Authors' own work A diagram of the GABEK-WinRelan semantic network structures of additive manufacturing barrier constellations. The diagram illustrates the GABEK-WinRelan semantic network structures of ad... More about this image found in GABEK-WinRelan semantic network structures of AM barrier constellations. So...
Journal Articles
Journal of Manufacturing Technology Management 1–25.
Published: 13 August 2026
in Developing reuse logic into product configuration: the operational approach for circularity
> Journal of Manufacturing Technology Management
Published: 28 July 2026
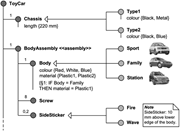
Figure 1 PVM demonstration. Adapted from Campo Gay et al. (2022) A diagram representing the structure and components of a toy car. A diagram of the structure and components of a toy car. The diagram includes a chassis with a length of 220 millimeters, which can be of Type 1 with colors black or metal, or Type 2 with colors black or blue. The body assembly is connected to the chassis and can be of three types: Sport, Family, or Station. The body can be red, white, or blue and made of Plastic 1 or Plastic 2. If the body is of the Family type, then the material is Plastic 1. The body assembly includes eight screws and up to two side stickers, which can be of the Fire or Wave type. The side stickers are placed 10 millimeters above the lower edge of the body. More about this image found in PVM demonstration. Adapted from Campo Gay et al. (2022) ...

