1-20 of 5191
Keywords: ORGANISATIONS
Close
Follow your search
Access your saved searches in your account
Would you like to receive an alert when new items match your search?
Journal

Covers the effect of civil engineering on local communities.
Journal Articles
Proceedings of the Institution of Civil Engineers - Municipal Engineer 1–10.
Published: 10 July 2026
... and guide our subsequent case study, we organise challenges through a feasibility framework focusing on three interrelated dimensions: social, financial, and technical barriers. Developing wind projects poses a host of well-documented challenges, but very few efforts have been focused primarily...
Journal Articles
Proceedings of the Institution of Civil Engineers - Municipal Engineer 1–13.
Published: 09 July 2026
... was then conducted around terms directly linked to each of the three cases, allowing us to capture the distinctive network structures for each case. Building on the methodological framework outlined above, this section presents the empirical findings of the topic modelling and ego-network analyses, organised...
in Acceptance as situated judgement: text mining user reviews of autonomous public transport
> Proceedings of the Institution of Civil Engineers - Municipal Engineer
Published: 09 July 2026
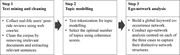
Figure 1. The flow of the study A flowchart shows 3 steps for text mining, topic modelling, and ego-network analysis. The flow starts with step 1, text mining and cleaning, which collects real-life users post-ride reviews using a web crawler, then cleans the corpus by removing irrelevant docum... More about this image found in The flow of the study A flowchart shows 3 steps for text mining, topic m...
in Acceptance as situated judgement: text mining user reviews of autonomous public transport
> Proceedings of the Institution of Civil Engineers - Municipal Engineer
Published: 09 July 2026
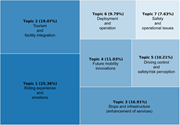
Figure 2. Topic distribution in autonomous public transport reviews A tree map shows 7 topics with percentages and topic names. The tree map lists topic 1, 25.36 per cent, riding experience and emotions. Topic 2, 19.07 per cent, tourism and facility integration. Topic 3, 16.91 per cent, stops ... More about this image found in Topic distribution in autonomous public transport reviews A tree map sho...
in Acceptance as situated judgement: text mining user reviews of autonomous public transport
> Proceedings of the Institution of Civil Engineers - Municipal Engineer
Published: 09 July 2026
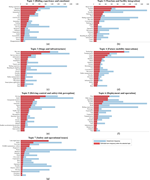
Figure 3. Highest-probability terms by topic Seven stacked horizontal bar charts compare term frequencies across seven topics. The panels a to g show stacked horizontal bars for overall term frequency and estimated term frequency within the selected topic. The horizontal scale runs from 0 to 1... More about this image found in Highest-probability terms by topic Seven stacked horizontal bar charts c...
in Acceptance as situated judgement: text mining user reviews of autonomous public transport
> Proceedings of the Institution of Civil Engineers - Municipal Engineer
Published: 09 July 2026
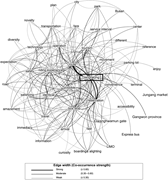
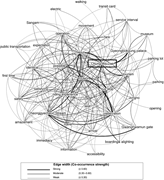
Figure 4. Co-occurrence ego-network analysis of Gangneung A keyword co-occurrence network shows Gangneung connected with transport and tourism terms The network places Gangneung among connected keywords including route, tourism, reservation, bus stop, riding experience, safety, operation, tech... More about this image found in Co-occurrence ego-network analysis of Gangneung A keyword co-occurrence ...
in Acceptance as situated judgement: text mining user reviews of autonomous public transport
> Proceedings of the Institution of Civil Engineers - Municipal Engineer
Published: 09 July 2026
Figure 5. Co-occurrence ego-network analysis of Chung Wa Dae A keyword co-occurrence network shows Chung Wa Dae connected with travel and tourism terms. The network includes Chung Wa Dae, Seoul, route, bus stop, reservation, tourism, Gyeongbokgung palace, Jongno, Gwanghwamun gate, boarding and... More about this image found in Co-occurrence ego-network analysis of Chung Wa Dae A keyword co-occurren...
in Acceptance as situated judgement: text mining user reviews of autonomous public transport
> Proceedings of the Institution of Civil Engineers - Municipal Engineer
Published: 09 July 2026
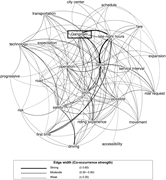
Figure 6. Co-occurrence ego-network analysis of Gangnam A keyword co-occurrence network shows Gangnam connected with transport and safety terms. The network includes Gangnam, Seoul, late-night hours, service interval, fare, schedule, city centre, transportation, technology, expectation, operat... More about this image found in Co-occurrence ego-network analysis of Gangnam A keyword co-occurrence ne...
Journal Articles
Proceedings of the Institution of Civil Engineers - Municipal Engineer 1–26.
Published: 08 July 2026
... efficiency gains (Yifan, 2024). Construction technology (CT) is defined as a structured ecosystem of digital solutions adopted within construction organisations to enhance project delivery efficiency, decision making, and productivity (Qadir et al., 2025). To allow for an accurate interpretation...
in Drivers and barriers of technology adoption in Ontario’s infrastructure
> Proceedings of the Institution of Civil Engineers - Municipal Engineer
Published: 08 July 2026
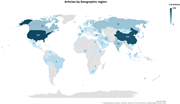
Figure 1. Articles published by geographical region on CT adoption A world map shows article counts by geographic region, with the highest counts in the United States, 133, and China, 124. The choropleth world map titled Articles by Geographic region displays the number of articles published... More about this image found in Articles published by geographical region on CT adoption A world map s...
in Drivers and barriers of technology adoption in Ontario’s infrastructure
> Proceedings of the Institution of Civil Engineers - Municipal Engineer
Published: 08 July 2026
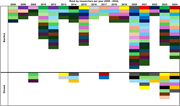
Figure 2. Tetris model ranking of CT adoption barriers Two ranked heatmap panels show barriers and drivers researched yearly from 2005 to 2024, with the greatest activity between 2020 and 2024. The two-panel ranked heatmap titled Rank by researchers per year, 2005 to 2024, displays yearly re... More about this image found in Tetris model ranking of CT adoption barriers Two ranked heatmap panels...
Published: 07 July 2026
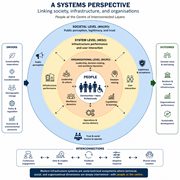
Figure 1. A systems perspective: linking society, infrastructure, and organisations (Source: Author, adapted from Ninan and Kundu (2026) ; Sexton et al. (2026) ; Logeswaran et al. (2026) ; Ivesøe Smith and Xydis (2026) ; Singh and Kumar (2026) ) [ 1 ] Systems perspective More about this image found in A systems perspective: linking society, infrastructure, and organisations (...
Journal Articles
Proceedings of the Institution of Civil Engineers - Municipal Engineer (2026) 179 (2): 91–93.
Published: 07 July 2026
...Figure 1. A systems perspective: linking society, infrastructure, and organisations (Source: Author, adapted from Ninan and Kundu (2026) ; Sexton et al. (2026) ; Logeswaran et al. (2026) ; Ivesøe Smith and Xydis (2026) ; Singh and Kumar (2026) ) [ 1 ] Systems perspective...
Journal Articles
Proceedings of the Institution of Civil Engineers - Municipal Engineer 1–12.
Published: 06 July 2026
in Enhancing mobility for the visually impaired with piezoelectric pedestrian signals
> Proceedings of the Institution of Civil Engineers - Municipal Engineer
Published: 06 July 2026
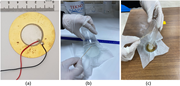
Figure 1. Piezoelectric system: (a) piezoelectric disc, (b) encapsulation process (bottom layer) and (c) encapsulation process (top layer) Three panels show a wired circular sensor, adhesive dispensing into a cup mould, and adhesive surrounding the circular sensor. More about this image found in Piezoelectric system: (a) piezoelectric disc, (b) encapsulation process (bo...
in Enhancing mobility for the visually impaired with piezoelectric pedestrian signals
> Proceedings of the Institution of Civil Engineers - Municipal Engineer
Published: 06 July 2026
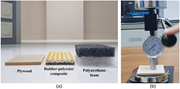
Figure 2. Damping materials and test: (a) damping layers and (b) Shore hardness test for plywood Panel a shows plywood, rubber-polyester composite, polyurethane foam. Panel b shows a hardness tester pressing a sample. More about this image found in Damping materials and test: (a) damping layers and (b) Shore hardness test ...
in Enhancing mobility for the visually impaired with piezoelectric pedestrian signals
> Proceedings of the Institution of Civil Engineers - Municipal Engineer
Published: 06 July 2026
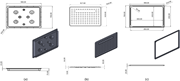
Figure 3. IGAP: (a) body, (b) cover and (c) frame Three panels show the tactile paving plate, the damping layer, and the surrounding frame with dimensions. The panel a presents orthographic and three-dimensional views of the tactile paving plate. The top view measures 900 by 700 millimetres an... More about this image found in IGAP: (a) body, (b) cover and (c) frame Three panels show the tactile pa...
in Enhancing mobility for the visually impaired with piezoelectric pedestrian signals
> Proceedings of the Institution of Civil Engineers - Municipal Engineer
Published: 06 July 2026
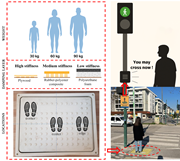
Figure 4. The workflow for the experimental testing of the IGAP prototype A composite diagram shows user weight, damping layers, foot positions, and the installation of a tactile paving system. The upper section compares three user weights of 30 kilograms, 60 kilograms, and 90 kilograms with... More about this image found in The workflow for the experimental testing of the IGAP prototype A comp...
in Enhancing mobility for the visually impaired with piezoelectric pedestrian signals
> Proceedings of the Institution of Civil Engineers - Municipal Engineer
Published: 06 July 2026
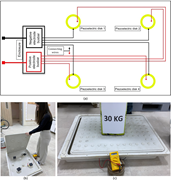
Figure 5. Voltage measurement: (a) four piezoelectric discs are placed into the IGAP cells, connected in parallel, (b) polyurethane foam damping layers are positioned on top of the discs and (c) a 30 kg static load is applied to the centre of the IGAP Three panels show the piezoelectric dis... More about this image found in Voltage measurement: (a) four piezoelectric discs are placed into the IGAP...
