Introduction
All organisations whichever sector they are in aspire to achieve “value”, however, the interpretation of what represents value is highly variable. Value for money guides typically lack a clearly defined value philosophy that anchors all steps in achieving a value “Outcome”.
This piece seeks to explore the value inflection point of the impact of supplier selection on achieving value. Firstly, by outlining a simple definition of “value” and propose some common language and the creation of a consistent narrative around achieving value. Followed by outlining the impact of complexity on value and the challenges this makes to traditional methods of evaluating suppliers. The final area the piece seeks to understand the lessons available from the extensive research on change management projects and how they could be deployed in seeking value on complex projects.
Defining value
Many organisations define value within the following three pillars:
Effectiveness – the degree to which something is successful in producing a desired result; success (doing the right thing).
Efficiency – the degree to which the minimal use of resource is deployed to achieve the result (doing the thing right).
Economy – the degree to which the inputs into the process where costs are minimised and benefits maximised (doing the thing for the lowest price).
This piece would contend that economy is a result of an effective and efficient (including a procurement process) process and therefore it is not a key pillar of value. In addition, a number of organisations mention equity and environment as elements of value. This piece notes that these are effectiveness measures rather than separate pillars of value. However, it illustrates the need for specific measures rather than “generic” effectiveness, to tailor requirements to what is needed. Therefore, this piece would ascertain that there is actually only two true value pillar –-effectiveness and efficiency (and if you apply these dimensions appropriately both internally and externally then you will achieve economy). These two value pillars then form the basis of a value narrative.
The process to achieve value should a result in an equilibrium between effectiveness and efficiency.
Having established the pillars of value, next is to understand how these pillars can be measured. This can be defined by using an existing model of assessing the why, what, how, who and when (WWHWW) model and how these overlay on commonly used organisational language. For example, the effectiveness pillar of value is an articulation of the “why” are we doing this requirement. The “why” is then defined in a list of outcomes. The other elements of the WWHWW model are then all resources that can be deployed to achieve the outcomes and are therefore all elements of efficiency.
There are four types of resources you can deploy to achieve the outcomes, time, people, process of delivery (technical) and physical resources. So, in simplistic terms the outcome is to generate increased economic activity across a region. For example, the what is build a railway, the how is process used, the who is the team and the when is the schedule. Table 1 below summarises the overall structure of value:
Table 1 then starts to set up a philosophy and narrative for value. Effectiveness is the “why” and this is defined in organisational terms as the outcomes. There are four types of resources that can he be deployed to achieve the “Efficiency”.
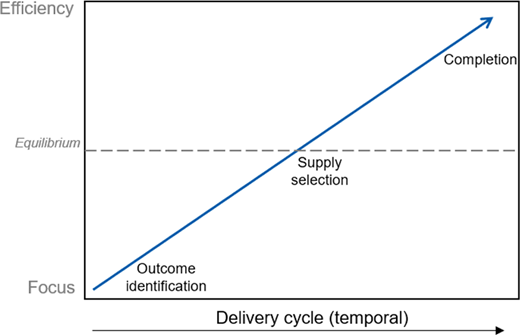
What therefore needs to be achieved is an equilibrium between effectiveness and efficiency known as the effectiveness/efficiency equilibrium (EEE). From experience this is not how organisations step up to deliver value and is a key risk in the any value process. Figure 1 shows how many organisations focus during the early stages of a requirement on effectiveness and then switching to a focus on efficiency post supplier selection. This model has been reinforced by the previous focus of the UK public sector procurement on the adoption of choosing suppliers on the most economically advantageous tender (MEAT). This has led to an overt focus on efficiency factors to the detriment of outcomes during the evaluation process.
Suppliers being selected in support of the outputs are being evaluated on the efficiency (outputs) and other efficiency resource factors rather than directly on supporting the outcomes. Therefore, the suppliers are not able to bring their capability to deliver optimal EEE. Thus, it falls on procurement departments to shift their thinking from firstly “cost savings to efficiency” and embracing and understanding outcomes so they can play a full role in the achievement of EEE. In the private sector the assessment of the effectiveness will often be also made easier by the requirement to fill a relatively aligned and simple outcome, generate more profit.
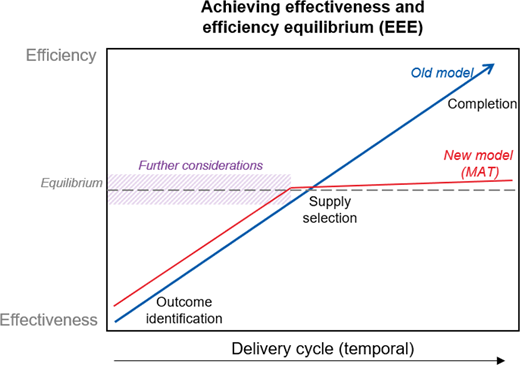
The current shift to most advantageous tender (MAT) is an attempt to bring the evaluation of supplier back towards an effectiveness/efficiency equilibrium, shown in Figure 2.
Figure 2 shows an improvement in the focus on effectiveness at the point of supplier selection and during delivery. It does not address the risk of an over focus on effectiveness at the early stages of requirement delivery. This is addressed by other activities such as early supplier engagement and the involvement of commercial/procurement functions at the earliest stages of the requirement assessments.
Understanding complexity
Once we have established there are two pillars to value, we can then also understand that there is a huge range of outcomes that an organisation will need. Some will be incredibly simple and some will be incredibly complex. Understanding this and deploying appropriate (efficient) processes to translate these outcomes into outputs is a critical step. When you translate the outcomes (strategic goals/business needs) into an outputs (a specification or a set of technical requirements) this is when 70%–80% of the cost of the output gets built in.
Where the overall cost of the output is low then the impact of achieving low economy and therefore poor value is low. However, if there are complex and high return outcomes an organisation will deploy a large number of resources to achieve the outcome. This will be most pronounced where there are not off the shelf solutions available and something bespoke needs to be created e.g. major infrastructure projects.
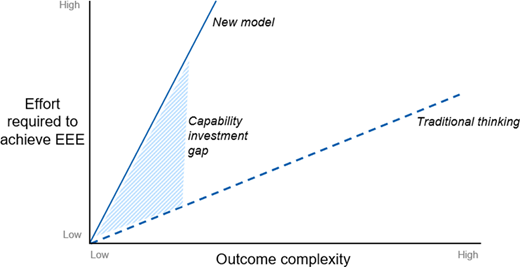
At the highest level of complexity organisations may structure achieving outcomes into a portfolio (multiple connected programmes), a programme (multiple connected projects) and a project structure. Structuring delivery of outcomes into this type of structure introduces several risks. Firstly, there is the risk that the multiple defined outputs will not come together to achieve the outcomes. Secondly, there is a risk in the assessment of this is a linear relationship between the achievement of EEE and complexity. This is not the case and should be considered as a compounding impact as represented in Figure 3.
The above elements of this report demonstrate that the achievement of value requires a focus on the EEE throughout the whole requirement delivery cycle. It is important to set this chain of events as part of the value narrative and setting out the “value chain” (a temporal concept) as the whole process of delivering a requirement and the “supply chain” (a physical concept) is a connected subset of this. The supply chain is a critical part of the value chain and it is important the engagement and selection of suppliers particularly in highly complex outcome requirements achieves EEE.
Deploying lessons learnt
What emerges from the above analysis is the similarities between the challenges in genuinely achieving EEE and achieving value successfully delivering change projects (as these also use the underlying HHWHH model) in organisations. Change project delivery is an area that has been extensively researched so offers the possibility to understand and deploy lessons learnt to the delivery of value. A Google AI (Link to the website of [ai.google.]) search on “why change projects fail” is captured in Table 2 below:
The above analysis maps the failure modes on change projects to the value factors. This shows the potential areas organisations should be focusing on to improve their approach to deliver EEE. So, if lessons from change projects are taken into account the “why” and the ‘who trump the “what”, “when” and “how” which is pretty much the opposite of the approach every organisation delivering complex requirements takes!
Conclusion
In conclusion, there is a need to create a philosophy and language around value for money that enables broad engagement. This needs to span the entire “value chain” and anchor all aspects in the required outcomes. This anchoring need grows as the complexity of the outcomes needing to be delivered grows. The more the complexity grows, and a portfolio of projects and programmes are formed the more the requirement/project becomes similar to a change project and the emphasis needs to shift from inputs, outputs and schedule to outcomes and capability. Value of Money is the achievement of an effectiveness/efficiency equilibrium throughout the value chain.