


This study aims to examine the degree to which contract awards in EU above-threshold procurement are predictable from prior buyer–supplier relationships, and whether this predictability varies across procurement domains.
Using longitudinal award data from Tenders Electronic Daily (TED, 2018–2022), this study models procurement as an evolving bipartite network across twelve high-activity Common Procurement Vocabulary (CPV) categories. Three network-based features – Preferential Attachment, an adapted Adamic–Adar index and Historical Frequency – capture distinct dimensions of relational structure. These features are used in a supervised classification framework (XGBoost) to predict which authority–supplier pairs will transact in subsequent years, with robustness assessed across three class balance conditions.
Predictive performance is consistently strong (mean AUC > 0.96, mean precision > 0.90), but substantial cross-domain heterogeneity emerges. Medical and pharmaceutical categories exhibit F1 scores above 0.75, indicating strong relational persistence. Construction and transport services display lower recall, suggesting more competitive dynamics. Direct relationship history becomes the dominant predictor when determining which supplier is most likely to receive the award.
The predictive model relies exclusively on network structure and relationship history, without incorporating contract-level attributes such as individual contract value or technical specifications. This partly explains lower predictive coverage in project-driven domains.
Predictability metrics can support category-specific monitoring, inform supplier diversification strategies and identify where SME access policies require interventions beyond procedural openness.
By revealing where relational persistence limits competitive openness, the findings inform policies aimed at broadening market access for small and medium-sized enterprises and new entrants. In high-predictability procurement categories, interventions beyond procedural openness – such as supplier diversification strategies and targeted monitoring – may be necessary to ensure fairer distribution of public contract opportunities.
The paper provides the first large-scale, cross-domain measurement of award predictability in EU procurement, demonstrating that link prediction techniques adapted to bipartite procurement networks serve as scalable diagnostic tools for assessing effective contestability.
1. Introduction
Public procurement accounts for a substantial share of government expenditure across OECD countries and operates under dense regulatory frameworks designed to ensure open competition and equal treatment among suppliers (OECD, 2016; Thai, 2009). In the European Union, contracts above established financial thresholds must be published in Tenders Electronic Daily (TED) and awarded through formally competitive procedures. These rules are intended to widen market access, reduce discretionary allocation and promote supplier diversity (Arrowsmith, 2014).
Despite these requirements, recurring buyer–supplier relationships are a well-documented feature of public procurement systems. Empirical research consistently shows that regulated procurement markets exhibit concentrated award patterns, including single bidding and persistent ties between contracting authorities and established suppliers (Fazekas and Kocsis, 2017; Fazekas and King, 2019). Such recurrence is not inherently problematic as it may reflect accumulated expertise, certification requirements or transaction cost efficiencies (Laffont and Tirole, 1993). However, it raises a fundamental empirical question: how strongly do prior buyer–supplier relationships predict future contract awards, and does the degree of predictability vary across procurement domains?
This question matters for procurement practice. If supplier selection is largely predictable from relational history, this may indicate that formal competition procedures coexist with persistent incumbency advantages, a pattern that may reduce structural competitive turnover and limit opportunities for new entrants. Conversely, if predictability is low or domain-specific, procurement offices can target monitoring and supplier diversification efforts more efficiently. Yet despite the policy relevance of this question, we lack systematic cross-domain evidence on the predictability of procurement awards within formally competitive, above-threshold procedures.
Existing empirical work has examined competition intensity (Coviello and Mariniello, 2014), pricing effects of procedural design (Baltrunaite et al., 2021), corruption risks and transparency-related vulnerabilities (Fazekas and King, 2019; Mungiu-Pippidi, 2023) and the impact of emergency conditions on procurement outcomes (Fazekas, Nishchal and Søreide, 2025). Network-based approaches have been applied to assess competitive conditions and domestic preferences in procurement markets (Fountoukidis et al., 2023, 2025). However, most studies focus on individual contract outcomes or bilateral relationships rather than system-level relational structures. In particular, the question of whether past buyer–supplier networks systematically predict future awards, and whether this predictability differs across procurement categories, remains empirically open.
This study addresses that gap by modeling EU public procurement as an evolving bipartite network linking contracting authorities and suppliers over time. Using longitudinal award data from TED (2018–2022), we construct category-specific buyer–supplier networks across twelve high-activity Common Procurement Vocabulary (CPV) domains. Three network-based features – Preferential Attachment, an adapted Adamic–Adar index, and Historical Frequency – capture distinct dimensions of relational structure: market activity, structural similarity and direct dyadic persistence. These features are used in a supervised classification framework (XGBoost) to predict which authority–supplier pairs will transact in subsequent years.
Our findings reveal that procurement awards are substantially predictable from prior relational history, with mean AUC exceeding 0.96 and mean precision above 0.90 across sampling conditions. Predictability, however, is not uniform. Medical and pharmaceutical procurement categories exhibit F1 scores above 0.75, indicating strong relational continuity consistent with certification intensity and supplier specialization. Construction and transport services display lower recall, suggesting more competitive and project-driven dynamics. Feature importance analysis shows that direct relationship history becomes the dominant predictor when distinguishing among plausible suppliers, while broader structural features matter more when separating observed ties from implausible pairings.
The study makes three contributions. First, it introduces a predictive perspective to the analysis of procurement awards. Second, it demonstrates that network-based features can capture meaningful variation in supplier selection across procurement domains operating under a common regulatory framework. Third, it provides a scalable diagnostic framework for assessing relational persistence and effective contestability in public procurement markets.
The remainder of the article is organized as follows. Section 2 reviews relevant literature on procurement regulation, buyer–supplier relationships and network-based approaches. Section 3 describes the data, network construction and predictive methodology. Section 4 presents the results, and Section 5 discusses implications for procurement research and practice.
2. Literature review
2.1 Procurement regulation and relational market structure
Public procurement in the European Union operates within a harmonized regulatory framework designed to ensure competition, transparency and equal treatment across member states. EU Directives 2014 / 24/EU and 2014 / 25/EU require the publication of above-threshold contracts and establish procedural safeguards intended to promote contestability.
Beyond their regulatory role, these arrangements generate standardized and longitudinal digital records of procurement activity, making it possible to observe contractual relationships between contracting authorities and suppliers over time. Previous research has used administrative procurement data to examine competition intensity, procedural design, pricing outcomes and favoritism (Coviello and Mariniello, 2014; Baltrunaite et al., 2021). However, existing studies have focused primarily on individual procurement outcomes rather than on the structural evolution of buyer–supplier relationships.
Formal procedural openness does not necessarily imply high competitive turnover. Even within openly advertised and legally compliant procedures, supplier selection may exhibit recurring relational patterns arising from specialization, switching costs, administrative experience, or other structural market characteristics. Assessing such continuity requires moving beyond transaction-level outcomes toward the analysis of procurement as a relational system.
The availability of standardized TED award data provides a rare opportunity to examine procurement markets as evolving buyer–supplier networks embedded within a common regulatory environment. Recent studies have applied network approaches to evaluate competitive conditions and domestic preference dynamics in procurement markets (Fountoukidis et al., 2023; Fountoukidis et al., 2025), highlighting the value of relational analysis while leaving open the question of how strongly past interactions predict future contract awards across procurement domains.
2.2 Relational persistence, incumbency and effective contestability
Regulated procurement markets operate under formal rules designed to ensure open participation and competitive neutrality. Threshold-based discretion can nevertheless reshape procurement outcomes and competitive conditions (Palguta and Pertold, 2017). Although procurement operates within a competitive framework, repeated interactions can generate durable relational patterns. Prior research shows that repeated supplier selection is influenced by transparency and prior experience (Plaček et al., 2019).
Institutional and sociological perspectives suggest that organizational routines, experiential learning and embedded social relations shape expectations and reduce uncertainty over time (Levitt and March, 1988; Pierson, 2000; Granovetter, 1985). In procurement, this may translate into recurring buyer–supplier relationships based on accumulated knowledge, administrative familiarity and perceived reliability, without implying any departure from competitive rules.
Research on relational contracting provides a complementary perspective. Desrieux et al. (2013) argue that repeated exchanges generate relational incentives that facilitate cooperation and improve contractual performance beyond what can be achieved through formal contractual provisions alone. Recurring supplier selection may therefore reflect not only incumbency advantages but also the accumulation of relationship-specific knowledge and relational capital.
Economic perspectives further emphasize switching costs and informational frictions as sources of lock-in (Farrell and Klemperer, 2007). Even where multiple suppliers are eligible, incumbents may benefit from prior performance, technical compatibility, or compliance familiarity. Transaction Cost Economics offers a related explanation. Williamson (1985) argued that repeated exchanges may generate bilateral dependency when buyers and suppliers make relationship-specific investments that are difficult to redeploy elsewhere. In procurement, such investments may include certification processes, specialized expertise, administrative adaptation or supplier-specific operational arrangements. As asset specificity increases, switching becomes more costly, encouraging continued collaboration even within formally competitive procedures.
Empirical research has documented measurable consequences of incumbency. Coviello, Guglielmo and Spagnolo (2018) showed that buyer discretion increases the probability of repeated awards without necessarily worsening performance outcomes, suggesting that relational continuity can operate within the objectives of competitive procurement. Camboni and Valbonesi (2021) found that incumbent suppliers in scoring-rule auctions tend to receive higher prices, consistent with buyers exploiting accumulated cost information about familiar suppliers. Together, these studies indicate that incumbency advantage is not a regulatory anomaly but an economically rational feature of repeated contracting environments.
The key question is therefore not whether relational persistence exists, but how strongly it structures supplier selection. Formal procedural openness may coexist with stable award patterns, and the available data cannot distinguish whether continuity reflects efficient specialization or entrenched incumbency (Decarolis et al., 2025). The objective of the present study is thus to measure relational structuring rather than assign normative meaning to it. An open question is whether its strength varies across procurement domains with different levels of technological complexity, certification requirements and supplier substitutability.
Procurement domains differ in technological complexity, certification intensity, asset specificity and supplier substitutability. In highly specialized markets, continuity may be reinforced by regulatory and technical constraints, whereas in more modular or project-based sectors competitive turnover may be easier to sustain. Systematic variation across domains operating under common regulatory rules would suggest that procurement regulation produces heterogeneous degrees of effective contestability.
2.3 Network-based approaches to measuring relational persistence
Measuring relational persistence across procurement domains requires methods that capture patterns beyond individual transactions. Network analysis provides such a framework. By representing procurement as a relational system linking contracting authorities and suppliers over time, it becomes possible to examine how prior interaction structures shape subsequent award outcomes. In this context, predictive modeling serves as a diagnostic instrument: the extent to which future awards can be inferred from past network configurations indicates how strongly relational history conditions supplier selection in practice.
The study of link prediction in networks has a well-established methodological foundation across several disciplines (Newman, 2010). Generative models have shown that mechanisms such as preferential attachment produce systematic connectivity patterns (Barabási and Albert, 1999), while structural features including neighborhood similarity encode informative signals about future connections (Liben-Nowell and Kleinberg, 2007; Lü and Zhou, 2011; Martínez et al., 2017). These approaches have been applied extensively in citation networks, online platforms and other relational systems where tie formation reflects accumulated interaction rather than random matching.
However, public procurement networks present several challenges that limit the direct transfer of standard link-prediction methods. Unlike many social or citation networks, procurement networks are bipartite, linking contracting authorities and firms rather than homogeneous actors, while relationships are asymmetric and embedded in procedural and regulatory constraints governing eligibility, qualification and award decisions. In addition, procurement awards are inherently competitive and selective events in which a single supplier is chosen from a set of qualified candidates. As a result, many plausible authority–supplier pairs do not result in an award in any given period, creating substantial class imbalance. Together, these characteristics require both the adaptation of established similarity measures to the institutional structure of procurement markets and evaluation strategies capable of distinguishing genuine structural predictability from artifacts of sampling design.
Recent studies have applied machine learning methods to procurement data to predict corruption risks, implementation failures, competition intensity and award outcomes (Gallego et al., 2021; Rabuzin and Modrusan, 2019; Acikalin et al., 2024). These contributions demonstrate that procurement data sets contain systematic predictive signals and that ML methods can support large-scale monitoring. The present study differs by focusing on network-structural features of buyer–supplier relationships and by examining predictability comparatively across procurement domains within a common EU regulatory framework.
To address these challenges, we adapt established network features to the institutional organization of procurement markets. Preferential Attachment captures domain-specific market activity and supplier prominence (Barabási and Albert, 1999). Similarity-based measures derived from neighborhood overlap (Adamic and Adar, 2003; Liben-Nowell and Kleinberg, 2007) are modified to account for the bipartite structure of authority–supplier interactions and the segmentation of contracts by procurement category. Temporal interaction measures capture the persistence of prior buyer–supplier ties across years, operationalizing relational continuity in dynamic procurement settings.
Gradient boosting classifiers (XGBoost; Chen and Guestrin, 2016) are used to evaluate how strongly these features predict subsequent awards. This method is well suited to modeling nonlinear interactions between network-derived features while providing interpretable feature importance scores. The objective is not to automate or optimize procurement decisions, but to quantify the extent to which past interactions carry systematic signals about future contract awards.
If awards can be reliably predicted from prior relational configurations, even within formally competitive, above-threshold procedures, this indicates that competitive openness coexists with persistent relational patterns whose implications for effective contestability depend on domain-specific conditions. Predictive performance thus serves as a measurable indicator of how strongly relational history shapes supplier selection across procurement categories.
3. Methodology
3.1 Data and regulatory scope
This study draws on contract award data published in TED, the official EU platform for procurement notices above the financial thresholds established by Directives 2014 / 24/EU and 2014 / 25/EU. These thresholds trigger mandatory publication and the use of formally competitive procedures, including open and restricted tenders. By focusing exclusively on above-threshold contracts, the analysis is situated within procurement processes that are legally structured to ensure transparency, equal treatment and cross-border market access.
This restriction serves a substantive rather than merely technical purpose. Contracts below EU thresholds may be subject to national-level discretion and reduced publication requirements, making competitive conditions less comparable across jurisdictions. In contrast, above-threshold procedures represent a high institutional benchmark for formal contestability. They are designed to minimize information asymmetries, widen supplier participation and constrain exclusionary discretion through procedural standardization. Observing relational patterns within this segment therefore constitutes a demanding test of competitive openness: if structured persistence is detected here, it emerges within processes explicitly designed to foster competition.
The data set covers contract awards between 2018 and 2022 across twelve major CPV categories. For each award, TED provides information on the contracting authority, the winning supplier, the procurement procedure, contract value and CPV classification.
To ensure sectoral comparability and temporal stability, CPV categories were selected through a structured multi-step procedure. First, we identified five-digit CPV divisions that appeared consistently across all five years (2018–2022), thereby excluding categories with discontinuous reporting patterns. Second, for each eligible division, we computed two metrics: the total number of contract awards and the total aggregated contract value across the observation period. Third, we constructed a composite ranking score combining normalized ranks of both metrics. The scoring formula weighted contract frequency at 70% and logarithmically transformed aggregate contract value at 30%. This weighting scheme prioritizes transaction intensity – the primary driver of relational network analysis – while accounting for economic magnitude and mitigating the influence of extreme value outliers. From this ranked distribution, the twelve highest-scoring CPV categories were selected for analysis.
Table 1 reports the structural characteristics of the selected procurement domains. Despite operating under a harmonized EU regulatory framework, the categories differ markedly in transaction volume, authority participation and supplier dispersion. Substantial variation is also observed in interaction intensity, measured through average contracts per authority and per company. Pharmaceutical categories exhibit high transactional recurrence relative to the number of participating authorities and firms, whereas construction and transport domains display lower dyadic intensity and broader dispersion. These differences indicate that procurement markets operating under identical formal rules nonetheless exhibit heterogeneous structural configurations.
Selected procurement categories
| CPV | Description | Contracts | Contracts per authority | Companies per authority |
|---|---|---|---|---|
| 33100 | Medical equipment | 47077 | 11.43 | 4.57 |
| 33140 | Medical consumables | 92851 | 27.81 | 8.23 |
| 33141 | Medical imaging equipment | 72067 | 20.11 | 6.31 |
| 33600 | Pharmaceutical products | 183233 | 49.64 | 6.85 |
| 33690 | Various pharmaceutical products | 57034 | 41.45 | 6.38 |
| 34144 | Medical devices | 17767 | 2.27 | 0.78 |
| 34300 | Medical equipment, pharmaceuticals and personal care | 5176 | 5.56 | 2.54 |
| 45000 | Construction work | 32989 | 3.89 | 3.42 |
| 45233 | Construction work for bridges | 15637 | 3.77 | 2.32 |
| 60130 | Special-purpose road passenger-transport services | 16076 | 5.29 | 2.44 |
| 66510 | Insurance services | 18789 | 2.55 | 0.99 |
| 90500 | Refuse and waste related services | 14855 | 2.27 | 1.26 |
Table represents unique counts across the 2018–2022 period
This variation motivates the network construction approach described in the following section.
3.2 Network construction
To examine relational structuring within above-threshold procurement markets, we represent the data set as an evolving bipartite network. One set of nodes corresponds to contracting authorities, and the other two companies. An edge between an authority and a company is established when a contract award occurs within a given year and CPV category. This bipartite representation reflects the institutional asymmetry of procurement relationships: authorities award contracts, and companies receive them.
Given the substantial structural heterogeneity documented in Table 1, the analysis is conducted at the level of CPV-specific subnetworks extracted from the full buyer–supplier network. Segmenting by category serves both substantive and methodological purposes. Procurement markets differ in technological complexity, supplier substitutability and regulatory constraints. Analyzing all domains in aggregate would obscure these sector-specific relational dynamics. The analysis therefore focuses on CPV-specific subgraphs of the full procurement network, allowing relational patterns to be examined within coherent market contexts rather than across structurally heterogeneous environments.
Temporal structure is incorporated by organizing the data into yearly slices and constructing cumulative relational histories. For each prediction period , network features are derived exclusively from information available up to year , thereby preserving chronological ordering and preventing information leakage. This temporal sequencing is essential for interpreting predictive performance as evidence of relational persistence rather than retrospective pattern fitting.
Edges are treated as binary award events at the authority–company level within each category-year. While procurement contracts may include multiple lots or varying economic values, the unit of analysis focuses on whether a relational tie materializes between a specific authority and supplier in a given period. This abstraction prioritizes structural continuity over contract-level idiosyncrasies and aligns the analysis with the study’s objective of measuring market-level relational structuring.
The resulting network representation captures three analytically distinct elements:
the distribution of market participation across authorities and companies;
the recurrence of specific authority–supplier ties; and
the broader structural contexts in which actors operate – all implemented in neo4j using temporal edge attributes within a unified graph structure.
3.3 Feature engineering
To operationalize relational structuring within the category-specific procurement networks described above, we construct three network-based features derived from established link-prediction theory. These features capture complementary dimensions of buyer–supplier relationship formation and are computed exclusively from historical information available at time when predicting outcomes in year .
Rather than relying on contract-specific attributes such as price or technical specifications, which vary substantially across categories and are often unavailable ex ante, we focus on structural features derived from the topology and temporal evolution of authority–company interactions. This choice ensures comparability across procurement domains while aligning the analysis with the study’s objective of measuring relational persistence within formally competitive markets.
Preferential Attachment reflects the tendency for nodes with higher degree to attract additional ties over time (Barabási and Albert, 1999). In the bipartite procurement network, the PA score for authority and company at time is defined as:
where:
is the number of distinct companies contracted by authority up to year within the given CPV category; and
is the number of distinct authorities supplied by company up to year within the same category.
A high PA score therefore reflects broad market participation by both parties.
The Adamic–Adar index captures structural similarity by weighting shared neighbors inversely to their overall connectivity, thereby assigning greater influence to less common interaction partners (Adamic and Adar, 2003). In classical unipartite networks, the index is defined as:
In the bipartite procurement setting, authorities and companies do not share neighbors directly. We therefore adapt the index by treating Contract Award nodes as contextual intermediaries linking the pair. For authority a and company c, the adapted Adamic–Adar score is defined as:
where is the set of Contract Award nodes linking and within the CPV category up to year , and is the number of distinct neighbors connected to award node . Award events embedded in contracting contexts with lower overall connectivity receive greater weight, reflecting their structural distinctiveness. The adapted AA feature thus captures whether collaboration occurs in specialized relational environments rather than through generic market exposure.
Historical Frequency provides a direct measure of dyadic persistence. For authority and company , we define:
where the indicator function equals 1 if at least one contract award occurred between the pair in year , and 0 otherwise.
Importantly, HF counts distinct years of interaction rather than total contract awards. This design avoids over-weighting framework agreements, multi-lot tenders or administrative bundling practices, and instead captures sustained relational engagement across time.
Together, PA, AA and HF represent three analytically distinct dimensions of procurement market structure: overall market participation, structural specialization and direct relational persistence. All features are computed within CPV-scoped networks using only data available up to the training year, ensuring strict temporal ordering and preventing information leakage.
These structured, temporally disciplined features form the input to the supervised learning models described in the following section. In addition to the three pairwise features, we include an authority-level measure of supplier concentration. For each contracting authority within a given CPV category, we compute the Herfindahl–Hirschman Index (HHI) based on the distribution of contract awards across suppliers up to year :
where is the share of authority 's total contract awards (by count) received by supplier , and is the number of distinct suppliers contracted by within the category up to year .
Shares are computed on the basis of award counts rather than contract values, as value fields in TED exhibit substantial missingness and inconsistent reporting across member states. HHI ranges from (equal distribution across suppliers) to 1 (all awards to a single supplier). Unlike the three pairwise features, HHI characterizes the buying authority rather than a specific buyer–supplier dyad. It captures whether the authority operates with a concentrated or pluralistic supplier base, providing the model with contextual information about the competitive environment in which each pair is embedded.
PA, AA, and HF form the feature set used in the main supervised classification models described in the following section. HHI is retained as a contextual market structure indicator used to interpret predictive patterns and is in addition included as a fourth feature in the geographic analysis.
3.4 Model training and validation
With the network features defined, we turn to the prediction task: given procurement relationships observed up to year , can we forecast which authority–company pairs will transact in year ? We formulate this as a supervised binary classification problem, where each candidate pair is labeled as positive if a contract occurs in the target year and negative otherwise.
3.4.1 Training data construction and sampling.
For each CPV category and base year t (2018–2021), labeled examples are constructed from authority–company pairs observed up to year t, supplemented with sampled non-co-occurring pairs drawn from the same year-t entity set. The label indicates whether a contract award between the pair occurs in year t + 1. This design emphasizes recurrence of previously observed relationships while allowing for the possibility of new tie formation within the observed market universe.
Negative instances are sampled from authority–company pairs drawn from the year-t entity set (i.e. authorities and firms observed up to t within the same CPV) that have not cooccurred up to year t. This ensures that negative cases represent feasible but unrealized pairings within the observed market rather than arbitrary combinations.
To assess robustness to class imbalance, negative samples are generated at three ratios relative to the number of positive labels (10%, 50% and 100%). These settings allow evaluation under highly imbalanced, intermediate and balanced conditions. The total number of candidate pairs per category-year is capped at 100,000 to ensure computational tractability.
3.4.2 Temporal ordering and feature construction.
For each authority–company pair, Preferential Attachment (PA), Adapted Adamic–Adar (AA) and Historical Frequency (HF) are computed using only information available up to year t within the relevant CPV category. Feature construction therefore excludes any data from year t + 1 or beyond. The prediction target indicates whether a contract award between the pair occurs in year t + 1, ensuring temporal separation between feature calculation and outcome measurement.
3.4.3 Model specification and baselines.
We employ XGBoost (Chen and Guestrin, 2016), a gradient-boosted decision tree algorithm suited to tabular prediction tasks and capable of modeling nonlinear interactions among features. Hyperparameters are set to 600 trees, maximum depth of 6, learning rate of 0.05 and subsample and column sampling rates of 0.8 to balance expressiveness and regularization.
The main predictive analysis uses the three pairwise features (PA, AA, HF) as inputs. To evaluate the incremental value of model complexity, we compare XGBoost against two baselines trained on the same feature set:
Logistic Regression (PA, AA, HF), which assesses whether nonlinear feature interactions improve predictive performance.
HF-only Logistic Regression, which uses Historical Frequency alone, and provides a lower bound based solely on dyadic persistence.
The authority-level HHI is not included as a predictive feature in the main specification or baselines. Instead, it is used as a contextual market structure indicator to interpret predictive patterns, analogous to the use of top-supplier share and contract volume in the authority-level analysis. The geographic analysis (Figures A2 and A3) in addition includes HHI as a fourth input feature to assess whether market structure information improves discrimination at the country level.
3.4.4 Validation and performance metrics.
For each CPV, year and sampling ratio, labeled pairs are partitioned into training (70%) and validation (30%) sets using stratified sampling. The model is trained on the training subset and evaluated on the held-out validation subset. This within-year split complements the forward temporal structure (training on, predicting ), reducing overfitting while maintaining temporal ordering.
Model performance is assessed using precision, recall, F1-score and area under the ROC curve (AUC). Precision captures the reliability of predicted recurring relationships, recall measures coverage of actual recurrences, F1 balances the two, and AUC evaluates threshold-independent discrimination.
3.4.5 Feature importance.
Beyond predictive accuracy, we extract feature importance using XGBoost’s gain-based metric, normalized within each model. These scores indicate the relative contribution of PA, AA, HF and HHI to predictive performance and allow us to assess how structural signals shift across sampling conditions.
The pipeline is executed across 144 configurations (12 CPVs × four years × 3 sampling ratios), enabling systematic comparison across domains, time periods and class balance conditions.
4. Results
4.1 Predictive performance across sampling conditions
We begin by examining predictive performance across alternative class balance conditions. Aggregate results indicate consistently strong discrimination across all sampling ratios. Mean AUC exceeds 0.96 across sampling ratios and increases slightly as the data set approaches class balance, indicating stable separation between recurring and nonrecurring authority–supplier ties.
Mean precision remains above 0.90 across sampling regimes, though individual categories in project-driven domains may fall below this threshold. Recall declines only marginally as the comparison set expands. The resulting aggregate F1 scores remain stable at approximately 0.68. These patterns suggest that predictive performance is not driven by imbalance artifacts but reflects persistent structural signals in procurement networks. Detailed aggregate metrics are reported in Table A1 (Appendix).
While aggregate metrics demonstrate robustness, category-level analysis reveals important heterogeneity. Figure 1 displays the mean F1-score by CPV category, averaged across sampling ratios and temporal validation periods. Three performance clusters emerge. Medical and pharmaceutical categories (33100, 33140, 33141, 33600, 33690, 34300) consistently achieve F1 scores above 0.75, indicating strong relational structuring. A middle tier comprising insurance services (66510), waste services (90500) and bridge construction (45233) exhibits moderate performance (0.50–0.70). The lowest-performing group includes medical devices (34144), general construction (45000) and transport services (60130), where F1 scores fall below 0.50.
 The line chart plots mean f 1 score from 0 to 1 against C P V sectors 33100, 33140, 33141, 33600, 33690, 34144, 34300, 45000, 45233, 60130, 66510 and 90500 for 2018 to 2021. Scores are generally high at 33100 to 33690, mostly about 0.8 to 0.93. They fall at 34144 to about 0.35 to 0.47, rise at 34300 to about 0.63 to 0.91, and decline again at 60130 to about 0.26 to 0.38. At 66510, 2018 reaches about 0.84 while the other years are about 0.52 to 0.55. At 90500, values range from about 0.67 to 0.80.
Mean F1 Score evolution by CPV category – average across 10%, 50% and 100% negative samples
Note(s): F1 combines precision and recall into a single metric ranging from 0 to 1, with higher values indicating stronger predictive performance. High F1 values indicate that the model identifies recurring buyer–supplier relationships both accurately (precision) and comprehensively (recall)
The line chart plots mean f 1 score from 0 to 1 against C P V sectors 33100, 33140, 33141, 33600, 33690, 34144, 34300, 45000, 45233, 60130, 66510 and 90500 for 2018 to 2021. Scores are generally high at 33100 to 33690, mostly about 0.8 to 0.93. They fall at 34144 to about 0.35 to 0.47, rise at 34300 to about 0.63 to 0.91, and decline again at 60130 to about 0.26 to 0.38. At 66510, 2018 reaches about 0.84 while the other years are about 0.52 to 0.55. At 90500, values range from about 0.67 to 0.80.Mean F1 Score evolution by CPV category – average across 10%, 50% and 100% negative samples
Note(s): F1 combines precision and recall into a single metric ranging from 0 to 1, with higher values indicating stronger predictive performance. High F1 values indicate that the model identifies recurring buyer–supplier relationships both accurately (precision) and comprehensively (recall)
Decomposing F1 into its components clarifies this variation. Precision remains uniformly high across categories, whereas differences arise primarily in recall. Specialized and certification-intensive domains exhibit higher coverage, suggesting that network structure captures a substantial share of supplier selection dynamics. In contrast, competitive and project-based domains display lower recall, indicating that procurement outcomes in these markets depend more heavily on factors beyond relational history.
Additional robustness analyses, reported in the Appendix, confirm that these patterns persist across individual sampling regimes. Although some smaller or concentrated categories display greater sensitivity as the comparison set expands, the overall clustering of procurement domains remains stable.
Geographic variation. Country-level AUC analysis reveals that predictive performance is not uniform across EU member states within the same procurement domain. AppendixFigure A2 summarizes mean AUC by country, with bubble size reflecting the number of CPV categories represented in each national market. AppendixFigure A3 disaggregates this pattern across all twelve CPV domains.
In high-persistence domains (e.g. 33100, 33690), AUC exceeds 0.95 across most countries, suggesting that routinized relational continuity is a pan-European institutional pattern in medical procurement. In contrast, low-persistence domains (e.g. 45000, 60130) exhibit substantial cross-country variation: construction procurement in Denmark achieves near-perfect AUC while Germany shows markedly lower values (0.73–0.88), consistent with differences in market structure, administrative traditions, or the prevalence of framework agreements. Observations with missing country codes (4.5% of country-level records) were excluded from the geographic analysis.
This geographic heterogeneity reinforces the diagnostic framing: recurrence patterns carry different governance significance not only across domains but across national institutional contexts.
4.2 Baseline model comparison
To contextualize predictive performance, we compare the boosted specification (XGBoost) against two baselines: Logistic Regression using the same network features and a History-only model relying exclusively on prior interaction frequency. Table 2 reports aggregate performance across sampling regimes.
Baseline model comparison across sampling ratios
| Metric | Model | 10% | 50% | 100% |
|---|---|---|---|---|
| Precision | XGB | 0.902 | 0.909 | 0.912 |
| LR | 0.462 | 0.462 | 0.437 | |
| HF | 0.187 | 0.263 | 0.255 | |
| AUC | XGB | 0.946 | 0.957 | 0.964 |
| LR | 0.712 | 0.765 | 0.799 | |
| HF | 0.616 | 0.704 | 0.754 | |
| Recall | XGB | 0.580 | 0.575 | 0.570 |
| LR | 0.127 | 0.133 | 0.131 | |
| HF | 0.069 | 0.081 | 0.080 | |
| F1 | XGB | 0.683 | 0.681 | 0.679 |
| LR | 0.171 | 0.177 | 0.175 | |
| HF | 0.090 | 0.109 | 0.107 |
Values represent averages across 48 CPV-year combinations (12 categories × 4 years)
Across all metrics and class balance conditions, XGBoost consistently outperforms both baselines. The performance gap is particularly pronounced in recall and F1-score, where the boosted model maintains stable coverage while the linear specifications identify only a small fraction of recurring ties. Differences in AUC further indicate that the boosted model achieves stronger overall discrimination between recurring and nonrecurring authority–supplier pairs.
Although Logistic Regression captures meaningful recurrence signals, its substantially lower recall suggests that uniform linear weighting cannot fully account for how relationship history interacts with broader structural conditions. The History-only specification performs considerably worse across all metrics, indicating that prior interaction frequency, while informative, is insufficient to explain predictive performance in isolation.
Importantly, the boosted model retains its advantage under balanced conditions (100% negatives), where predictive performance cannot be driven by class imbalance. If predictability were explained solely by simple recurrence counts, the HF-only baseline would perform comparably in this setting. The persistent performance gap indicates that predictive strength reflects not only repetition, but also how recurring ties are positioned within the broader relational structure of each market.
Category-level comparisons ( Appendix) show that XGBoost gains are largest in fragmented markets and smallest in standardized domains, consistent with domain-level differences in relational configuration.
4.3 Feature importance and the shifting role of network signals
Beyond aggregate performance, we examine which network features drive predictions and how their relative importance changes across class balance conditions. The results indicate that different aspects of buyer–supplier relationships become important depending on the nature of the prediction task.
Under highly imbalanced conditions, the three features – Preferential Attachment (PA), Historical Frequency (HF) and Adapted Adamic–Adar (AA) – contribute in broadly comparable proportions. In practical terms, the model is primarily distinguishing observed buyer–supplier relationships from a large number of unlikely pairings. In this setting, information about market participation, previous interactions and the relational environment surrounding the pair all provide useful predictive signals.
As the comparison set expands and the task becomes distinguishing among plausible suppliers, Historical Frequency becomes the dominant predictor, indicating that prior collaboration is the strongest signal of future awards when realistic alternatives exist. By contrast, the importance of Preferential Attachment declines, suggesting that general market activity alone cannot explain recurring awards once direct competitors are considered.
Because Preferential Attachment is partly determined by the distribution of market participation within a procurement domain, differences in supplier pool size and market structure may influence its magnitude. Consequently, PA should be interpreted as a domain-specific indicator of market prominence rather than a directly comparable measure across heterogeneous procurement categories.
The Adapted Adamic–Adar measure remains consistently relevant across specifications. This feature captures whether a buyer and supplier operate within similar and relatively specialized relational environments. Its continued contribution indicates that recurring awards depend not only on prior interactions but also on the broader market context in which those interactions occur.
Taken together, these results suggest that repeated collaboration is the strongest predictor of future awards, but that its predictive value depends on market structure. Relational persistence is most informative when embedded within specific contracting environments rather than operating independently of them. This finding helps explain why predictability varies across procurement domains and why similar levels of prior interaction may generate different outcomes across markets.
4.3.1 Market structure as contextual signal.
The authority-level HHI, included as a fourth feature in the geographic specifications, contributes modestly to model performance (mean gain 0.15–0.35), with gains highest in low-persistence domains such as construction and transport, where pairwise relationship signals are weaker. Notably, recurring buyer–supplier relationships are often observed among authorities with relatively diverse supplier bases. This finding suggests that relational continuity should not automatically be interpreted as evidence of supplier concentration or market closure. Instead, recurring awards can also emerge in procurement environments where authorities continue to engage with multiple suppliers over time.
4.4 Category-level heterogeneity
While aggregate metrics indicate robust overall performance, substantial variation emerges across procurement domains. Table 3 reports category-level results under the balanced (100%) specification. Alternative sampling regimes yield qualitatively similar patterns and are therefore reported in the Appendix.
Predictive performance by procurement category (100% negative ratio)
| CPV | Description | AUC | Precision | Recall | F1-Score |
|---|---|---|---|---|---|
| 33100 | Medical equipment | 0.989 | 0.983 | 0.811 | 0.888 |
| 33140 | Medical consumables | 0.982 | 0.975 | 0.754 | 0.850 |
| 33141 | Medical imaging equipment | 0.988 | 0.976 | 0.816 | 0.887 |
| 33600 | Pharmaceutical products | 0.971 | 0.934 | 0.747 | 0.826 |
| 33690 | Various pharmaceutical products | 0.986 | 0.964 | 0.720 | 0.820 |
| 34144 | Medical devices | 0.928 | 0.893 | 0.276 | 0.420 |
| 34300 | Medical equipment, pharmaceuticals and personal care | 0.979 | 0.961 | 0.699 | 0.799 |
| 45000 | Construction work | 0.943 | 0.924 | 0.323 | 0.470 |
| 45233 | Construction work for bridges | 0.950 | 0.847 | 0.377 | 0.517 |
| 60130 | Special-purpose road passenger-transport services | 0.926 | 0.757 | 0.225 | 0.344 |
| 66510 | Insurance services | 0.969 | 0.861 | 0.473 | 0.605 |
| 90500 | Refuse and waste related services | 0.962 | 0.867 | 0.620 | 0.721 |
Values represent averages across four temporal validation periods (2018→2019, 2019→2020, 2020→2021, 2021→2022). High-performing medical/pharmaceutical categories exhibit both strong discrimination (AUC) and high coverage (recall), while construction and transport services show lower recall despite maintaining precision, indicating that structural features capture different proportions of procurement dynamics across domains
Three broad domain configurations emerge. Medical and pharmaceutical categories exhibit high discrimination and recall, indicating strong relational structuring. Bridge construction, insurance services and waste management display intermediate performance, suggesting a greater role for non-relational factors. Medical devices, construction and transport services show lower recall despite maintaining strong discrimination, indicating that procurement outcomes in these domains depend less on prior relationships and more on project-specific or market-specific conditions.
Importantly, cross-category variation is driven primarily by differences in recall rather than precision. Precision remains consistently high across domains, indicating that when recurring ties are identified, the structural signals are reliable. The key distinction lies in coverage: the extent to which procurement outcomes are governed by persistent relational configurations. Higher predictive performance in some categories may partly reflect more constrained supplier environments in addition to stronger relational persistence.
4.5 Temporal stability
Beyond domain heterogeneity, we assess whether predictive performance remains stable across temporal validation periods. Detailed yearly metrics are reported in the Appendix. Across all train–test transitions (2018→2019 through 2021→2022), discrimination and precision remain consistently high, with only moderate variation in recall.
This temporal consistency suggests that relational signals are durable, persisting despite potential shifts in procurement practices or broader economic disruptions. Modest variation in recall likely reflects changing competitive conditions rather than a structural weakening of relational persistence.
5. Discussion
5.1 Interpreting the predictive patterns
The results indicate that supplier selection in EU above-threshold procurement is substantially predictable from prior buyer–supplier relationships and broader network structure. Mean AUC exceeding 0.96 and mean precision above 0.90 show that the network-based features reliably distinguish recurring from nonrecurring buyer–supplier relationships at the aggregate level, although predictive performance varies across procurement domains. The consistency of these results across sampling regimes and temporal validation periods suggests that the observed patterns reflect durable features of procurement markets rather than artifacts of model specification.
Feature importance analysis provides additional insight into the sources of this predictability. When the model distinguishes observed relationships from a large set of unlikely authority–supplier pairings, all three dimensions of the network contribute meaningfully: market activity (Preferential Attachment), specialized relational environments (Adapted Adamic–Adar) and direct relationship history (Historical Frequency). However, when the task becomes identifying which supplier is most likely to win among several realistic candidates, Historical Frequency becomes the dominant predictor. In practical terms, this means that previous collaboration is the strongest indicator of future contracting when multiple suppliers appear capable of performing the contract. Whether this reflects accumulated experience, administrative familiarity, reduced uncertainty, or switching costs is a question that the present analysis cannot resolve.
Predictability is not uniform across procurement categories. Medical and pharmaceutical procurement display both strong discrimination and high coverage (F1 > 0.75), indicating that prior relationships account for a substantial share of predictable supplier selection outcomes. These categories are also characterized by relatively high levels of repeated interaction and more limited supplier substitutability, conditions that are consistent with certification requirements, specialized expertise and established supplier relationships. In contrast, construction and transport services exhibit lower recall despite maintaining high precision. This suggests that future awards in these domains depend less on prior buyer–supplier interactions and more on project-specific circumstances, wider supplier choice, or other factors not captured by network structure alone.
Part of the observed variation may also reflect differences in the underlying structure of procurement markets. Categories characterized by smaller supplier pools, stronger certification requirements, or lower supplier substitutability may be inherently more predictable because the set of feasible supplier choices is more constrained. Consequently, differences in predictive performance should be interpreted as comparative indicators of relational structuring within specific market environments rather than as direct measures of competition or incumbency across domains.
Taken together, the findings suggest that relational history matters across all procurement domains, but not to the same extent. In some markets, previous collaboration provides a strong indication of future awards, whereas in others it explains only a limited share of procurement outcomes. Importantly, the results identify patterns of relational structuring rather than their underlying causes. High predictability should therefore be interpreted as evidence that previous interactions contain useful information about future awards, not as evidence that competition is necessarily weakened or that procurement outcomes are inefficient.
5.2 Contributions to procurement research
This study contributes to procurement research in three ways.
First, it introduces a predictive perspective to the analysis of public procurement relationships. Previous studies have primarily examined recurring contracting patterns, supplier concentration, incumbency effects and competition outcomes using descriptive or explanatory approaches (Coviello and Mariniello, 2014; Baltrunaite et al., 2021). By contrast, the present study evaluates how accurately future contract awards can be inferred from prior network relationships. Predictive performance is therefore used as an indicator of the extent to which procurement outcomes are conditioned by accumulated interactions between contracting authorities and suppliers.
Second, the study demonstrates the value of combining network analysis with machine-learning methods in procurement research. Traditional econometric models typically estimate the effect of specific variables on procurement outcomes. The approach adopted here addresses a different question: how much information about future awards is embedded in past interaction structures. Rather than identifying causal effects, the framework measures the predictive content of network configurations and enables comparison across procurement domains operating within a common regulatory environment.
Third, the results show that relational predictability varies substantially across procurement categories. The differences observed between medical, pharmaceutical, construction, transport and service-related domains suggest that common procurement rules interact with distinct market structures and supplier configurations. This finding highlights the importance of considering category-specific relational environments when assessing procurement dynamics and provides a basis for future research linking predictability to market structure, supplier diversity and procurement performance.
Taken together, these contributions clarify how the present framework relates to existing approaches in procurement research. The proposed approach should be viewed as complementary to, rather than a substitute for, traditional econometric analyses. Whereas regression-based models seek to explain the determinants of procurement outcomes, the present framework evaluates how strongly future awards can be anticipated from prior network structure. The two approaches therefore address different but complementary questions regarding procurement market dynamics.
Compared with traditional procurement indicators and contract-level analyses, the framework offers several advantages. It is scalable, can be implemented using routinely collected award data, enables systematic comparison across procurement categories and captures relational patterns that may not be visible through transaction-level analysis alone. At the same time, it does not identify causal mechanisms and does not incorporate bidding behavior, award criteria or contract-specific characteristics. Predictive performance should therefore be interpreted as evidence of relational structuring rather than as a direct assessment of procurement efficiency or competitive quality.
5.3 Implications for procurement practice
The findings have several practical implications for procurement monitoring and market analysis. More broadly, the proposed methodology is not limited to the specific EU procurement categories examined here. Because it relies on longitudinal award records and network relationships between buyers and suppliers, it can be applied in a wide range of procurement settings where comparable administrative data are available. These include national procurement systems, sector-specific procurement markets, utility procurement, healthcare purchasing and other regulated contracting environments. In this sense, the framework provides a general approach for measuring the extent to which future awards are structured by prior network configurations.
First, the cross-domain variation in predictability provides an empirical basis for category-specific monitoring strategies. High predictability in a procurement category does not indicate dysfunction. In specialized domains, it may reflect justified continuity based on expertise, performance and certification requirements. It does, however, signal that competitive turnover is structurally limited and that prior relationships are strong predictors of award outcomes. Procurement offices can use predictability metrics to identify categories where supplier diversification strategies, lot-splitting, or targeted outreach to new entrants may be analytically warranted, subject to contextual assessment of whether the observed patterns reflect efficient specialization or constrained market access.
Second, the methodology can be used comparatively across markets, sectors and institutional settings. Applying the same network-based framework to different procurement environments allows researchers and practitioners to assess whether relational persistence is concentrated in particular categories, contracting systems, or regulatory contexts. Such comparisons may help identify where supplier selection is primarily shaped by accumulated relationships and where procurement outcomes are driven more strongly by project-specific or market-specific conditions.
Third, the dominance of relationship history under balanced conditions indicates that relational incumbency is most consequential precisely where formal competition is present. Where prior relationships are the dominant structural predictor of awards in formally competitive categories, smaller or newer suppliers may face structural conditions that procedural openness alone does not address (Hawkins et al., 2025). Complementary instruments – such as supplier rotation provisions, subcontracting requirements, or market engagement initiatives – may be appropriate responses, depending on whether observed patterns are confirmed by contextual or outcome-based analysis.
Fourth, the network-based approach offers a scalable diagnostic tool. The features used in this study – Preferential Attachment, adapted Adamic–Adar and Historical Frequency – can be computed from standard procurement data available through TED and similar national platforms. Procurement authorities and oversight agencies could integrate such indicators into monitoring dashboards to track relational persistence over time, flag categories with unusually high or increasing predictability and benchmark structural conditions across procurement domains.
Finally, the temporal stability of predictive performance suggests that relational patterns in procurement markets are durable rather than transient. Structural features of buyer–supplier networks persist across years despite regulatory frameworks, economic disruptions and shifting market conditions. This has implications for the time horizons of monitoring and policy assessment: one-off interventions are unlikely to restructure stable relational configurations, and sustained, iterative approaches are more likely to capture meaningful change.
5.4 Limitations
Several limitations qualify the scope and interpretation of the findings.
First, the analysis relies exclusively on network structure and relationship history, excluding contract-level attributes such as technical specifications, pricing strategies, or performance indicators. Predictive coverage is therefore necessarily partial in domains where procurement outcomes depend on project-specific factors. This limitation is most consequential for the lower-recall categories (construction, transport), where non-relational factors clearly play a larger role.
Second, the empirical setting is confined to EU above-threshold procurement as recorded in TED and to a relatively short observation window covering 2018–2022. Procurement systems operating under different regulatory environments may exhibit distinct relational dynamics, while the limited time horizon constrains our ability to observe longer-term buyer–supplier relationships and assess whether the reported predictive patterns persist over longer periods. The mechanisms identified here (relational persistence, incumbency advantage and domain-specific variation) are likely present in other contexts, but their intensity may vary.
Third, the analysis does not differentiate among forms of relational continuity. Recurring buyer–supplier ties may reflect accumulated expertise and performance reliability, but they may also arise from switching costs, administrative routines, or discretionary behavior that disadvantages entrants. Because the model does not incorporate procedural choice, award criteria, or other institutional determinants of selection, high predictability should be interpreted as evidence of relational persistence rather than direct evidence of reduced competition, favoritism, or regulatory failure. This limitation is consistent with the broader procurement literature, which emphasizes that similar outcomes may arise from different institutional mechanisms and that observed relationship patterns do not by themselves distinguish efficiency from opportunism or corruption (Decarolis et al., 2025).
Fourth, the negative sampling strategy defines which potential ties are treated as nonevents. Alternative constructions of the comparison set could alter the relative salience of structural features, even if aggregate performance remained stable. The robustness checks across three sampling ratios mitigate but do not eliminate this concern.
Fifth, the analysis operates at the authority–company level within CPV categories, abstracting from variation in procurement procedures, contract types, lot structures and bidding participation. While this facilitates cross-domain comparison, it necessarily compresses potentially relevant intra-category heterogeneity. In addition, the framework relies exclusively on award data and therefore captures successful buyer–supplier relationships rather than the broader set of competitive interactions occurring during the bidding process. Future research could incorporate bidder participation networks to examine how repeated participation, competitive exposure and learning effects influence award outcomes.
Sixth, cross-domain comparability remains subject to important constraints. Procurement categories differ in supplier pool size, specialization, market concentration and substitutability, all of which may influence attainable predictive performance independently of relational persistence. Moreover, network measures are calculated within domains and therefore partly reflect underlying market composition. Metrics such as Preferential Attachment depend on the size and connectivity of the supplier base, limiting direct comparability across structurally heterogeneous markets. Consequently, differences in model performance should be interpreted cautiously rather than as direct rankings of market openness or competitive intensity.
Future research could extend this framework by incorporating contract-level attributes, bidder participation data and variation across different types of contracting authorities (e.g. hospitals, local governments, utilities and central government agencies). Additional work could also examine links between predictability, market access and cost efficiency, as well as the effects of regulatory reforms and external shocks such as the COVID-19 pandemic (Di Mauro et al., 2022).
6. Conclusion
This study shows that supplier selection in EU above-threshold procurement is substantially predictable from prior buyer–supplier relationships, but that the degree of predictability varies systematically across procurement categories. Using network-based features derived from longitudinal TED award data (2018–2022), we demonstrate that past interactions consistently predict future contract awards, with mean AUC exceeding 0.96 and mean precision above 0.90.
The cross-domain comparison reveals three distinct patterns. In medical and pharmaceutical procurement, relational history accounts for a large share of supplier selection outcomes (F1 > 0.75), consistent with high certification intensity and limited supplier substitutability. In insurance, waste management and bridge construction, recurring ties remain identifiable but a larger portion of outcomes reflects additional contextual factors. In construction, transport and medical devices, predictability is lower, suggesting more competitive and project-driven dynamics. These differences emerge within a common regulatory framework, indicating that category-specific market structures, not only procedural rules, determine effective contestability.
Feature importance analysis indicates that prior relationship history becomes the strongest predictor when distinguishing among plausible suppliers, highlighting the importance of incumbency in formally competitive environments.
This finding is relevant for procurement practice: incumbency advantages are most consequential in precisely those settings where multiple suppliers formally compete.
The practical implications are twofold. Predictability metrics can support category-specific monitoring and supplier diversification strategies, while the proposed network indicators can be integrated into procurement monitoring systems as scalable measures of relational persistence.
The analysis captures relational persistence but cannot determine whether recurring ties reflect efficient specialization or reduced market access. Contract-level attributes are excluded, and the empirical setting is confined to EU above-threshold procurement.
Declaration of generative AI and AI-assisted technologies in the manuscript preparation process
During the preparation of this work, the authors used ChatGPT (OpenAI, GPT-5.2) to improve language clarity, grammar and stylistic consistency, and Claude (Anthropic, Claude 4 Sonnet) to generate Python visualization scripts for the geographic analysis figures. After using these tools, the authors reviewed and edited all outputs as needed and take full responsibility for the content of the published article.
References
Appendix
General note (applies to Appendix Figures A1–A7): Metrics are averaged across years and CPV categories as indicated. For country plots, countries with insufficient observations are omitted/greyed out; observations with missing country codes are excluded. Unless stated otherwise, results use the 100% negative sampling ratio.
 The line chart plots mean f 1 score from 0 to 1 for percentage negative levels of 10 per cent, 50 per cent and 100 per cent within 12 C P V sectors and test years 2018 to 2021. Scores are mostly about 0.8 to 0.93 across sectors 33100 to 33690, before falling at 34144 to roughly 0.33 to 0.52. Sector 34300 rises to about 0.59 to 0.93, while 45000 and 45233 mostly range from about 0.29 to 0.66. The lowest values occur around 60130, reaching approximately 0.18 to 0.47. Scores subsequently rise across 66510 and 90500, reaching about 0.65 to 0.81 at 90500.
F1 Score evolution by CPV category under different negative sampling ratios
The line chart plots mean f 1 score from 0 to 1 for percentage negative levels of 10 per cent, 50 per cent and 100 per cent within 12 C P V sectors and test years 2018 to 2021. Scores are mostly about 0.8 to 0.93 across sectors 33100 to 33690, before falling at 34144 to roughly 0.33 to 0.52. Sector 34300 rises to about 0.59 to 0.93, while 45000 and 45233 mostly range from about 0.29 to 0.66. The lowest values occur around 60130, reaching approximately 0.18 to 0.47. Scores subsequently rise across 66510 and 90500, reaching about 0.65 to 0.81 at 90500.F1 Score evolution by CPV category under different negative sampling ratios
 The map presents overall model performance by European country, with bubble size representing coverage from 2 to 12 C P V sectors and the scale representing mean A U C from 0.5 to 1.0. Countries with bubbles include Norway, Sweden, Finland, Denmark, Ireland, United Kingdom, Netherlands, Belgium, Germany, Poland, Czech Republic, Austria, Hungary, Romania, Slovenia, Croatia, Italy, Bulgaria, North Macedonia, Greece, France, Spain, Portugal, Latvia and Lithuania. Poland, Austria, Hungary, Finland, France and the Netherlands are among countries near the higher end of the mean A U C scale, while Latvia, Belgium and Croatia are nearer the lower end. Areas without sufficient observations are marked as no data, n less than 50.
Mean AUC by country, averaged across CPV categories and years (100% negatives). Bubble color: mean AUC (darker = higher). Bubble size: number of CPV categories with sufficient observations (n ≥ 50). Grey = below threshold or missing country codes. Geographic specification includes authority-level HHI
The map presents overall model performance by European country, with bubble size representing coverage from 2 to 12 C P V sectors and the scale representing mean A U C from 0.5 to 1.0. Countries with bubbles include Norway, Sweden, Finland, Denmark, Ireland, United Kingdom, Netherlands, Belgium, Germany, Poland, Czech Republic, Austria, Hungary, Romania, Slovenia, Croatia, Italy, Bulgaria, North Macedonia, Greece, France, Spain, Portugal, Latvia and Lithuania. Poland, Austria, Hungary, Finland, France and the Netherlands are among countries near the higher end of the mean A U C scale, while Latvia, Belgium and Croatia are nearer the lower end. Areas without sufficient observations are marked as no data, n less than 50.Mean AUC by country, averaged across CPV categories and years (100% negatives). Bubble color: mean AUC (darker = higher). Bubble size: number of CPV categories with sufficient observations (n ≥ 50). Grey = below threshold or missing country codes. Geographic specification includes authority-level HHI
 The 12 maps present mean A U C by country for C P V categories 33100 Medical Equipment, 33140 Medical Consumables, 33141 Medical Disposables, 33600 Pharmaceuticals, 33690 Other Pharma, 34144 Special Vehicles, 34300 Vehicle Parts, 45000 Construction, 45233 Road Construction, 60130 Road Transport, 66510 Insurance and 90500 Waste Services. The mean A U C scale ranges from 0.5 to 1.0. Each map uses the same European base and displays only countries meeting the filter n greater than or equal to 50. Countries without qualifying data remain unfilled. The number of countries differs by category, with visible counts including n 15 for Medical Equipment, n 20 for Medical Consumables, n 14 for Medical Disposables, n 10 for Pharmaceuticals, n 7 for Other Pharma, n 14 for Special Vehicles, n 3 for Vehicle Parts, n 10 for Construction, n 4 for Road Construction, n 7 for Road Transport, n 16 for Insurance and n 9 for Waste Services.
Country-level AUC by CPV domain (100% negative ratio), averaged across temporal periods. Each panel corresponds to one of the twelve CPV categories (see Table 1). Color intensity reflects mean AUC (darker = higher). Countries shown in grey had no fold meeting the minimum observation threshold (n ≥ 50) for the respective category; the number of eligible countries per sector is reported in the lower right corner of each panel. The geographic specification in addition includes authority-level HHI as a fourth input feature
The 12 maps present mean A U C by country for C P V categories 33100 Medical Equipment, 33140 Medical Consumables, 33141 Medical Disposables, 33600 Pharmaceuticals, 33690 Other Pharma, 34144 Special Vehicles, 34300 Vehicle Parts, 45000 Construction, 45233 Road Construction, 60130 Road Transport, 66510 Insurance and 90500 Waste Services. The mean A U C scale ranges from 0.5 to 1.0. Each map uses the same European base and displays only countries meeting the filter n greater than or equal to 50. Countries without qualifying data remain unfilled. The number of countries differs by category, with visible counts including n 15 for Medical Equipment, n 20 for Medical Consumables, n 14 for Medical Disposables, n 10 for Pharmaceuticals, n 7 for Other Pharma, n 14 for Special Vehicles, n 3 for Vehicle Parts, n 10 for Construction, n 4 for Road Construction, n 7 for Road Transport, n 16 for Insurance and n 9 for Waste Services.Country-level AUC by CPV domain (100% negative ratio), averaged across temporal periods. Each panel corresponds to one of the twelve CPV categories (see Table 1). Color intensity reflects mean AUC (darker = higher). Countries shown in grey had no fold meeting the minimum observation threshold (n ≥ 50) for the respective category; the number of eligible countries per sector is reported in the lower right corner of each panel. The geographic specification in addition includes authority-level HHI as a fourth input feature
 The grouped bar chart plots mean F 1 from 0 to 1 across C P V categories 33100, 33140, 33141, 33600, 33690, 34144, 34300, 45000, 45233, 60130, 66510 and 90500. For 10 per cent, 50 per cent and 100 per cent negative data, mean F 1 values respectively reach about 0.89, 0.89 and 0.89 for 33100, 0.86, 0.86 and 0.85 for 33140, 0.90, 0.89 and 0.89 for 33141, 0.83, 0.83 and 0.83 for 33600, 0.85, 0.83 and 0.82 for 33690, 0.44, 0.43 and 0.42 for 34144, 0.81, 0.80 and 0.80 for 34300, 0.43, 0.45 and 0.47 for 45000, 0.55, 0.56 and 0.52 for 45233, 0.30, 0.33 and 0.35 for 60130, 0.63, 0.61 and 0.60 for 66510, and 0.70, 0.71 and 0.72 for 90500.
Mean F1 score by CPV category across negative sampling ratios
The grouped bar chart plots mean F 1 from 0 to 1 across C P V categories 33100, 33140, 33141, 33600, 33690, 34144, 34300, 45000, 45233, 60130, 66510 and 90500. For 10 per cent, 50 per cent and 100 per cent negative data, mean F 1 values respectively reach about 0.89, 0.89 and 0.89 for 33100, 0.86, 0.86 and 0.85 for 33140, 0.90, 0.89 and 0.89 for 33141, 0.83, 0.83 and 0.83 for 33600, 0.85, 0.83 and 0.82 for 33690, 0.44, 0.43 and 0.42 for 34144, 0.81, 0.80 and 0.80 for 34300, 0.43, 0.45 and 0.47 for 45000, 0.55, 0.56 and 0.52 for 45233, 0.30, 0.33 and 0.35 for 60130, 0.63, 0.61 and 0.60 for 66510, and 0.70, 0.71 and 0.72 for 90500.Mean F1 score by CPV category across negative sampling ratios
 The grouped bar chart plots mean precision from 0 to 1 across the 12 C P V categories. For 10 per cent, 50 per cent and 100 per cent negative data, values respectively reach about 0.99, 0.99 and 0.98 for 33100, 0.98, 0.98 and 0.98 for 33140, 0.98, 0.98 and 0.98 for 33141, 0.94, 0.94 and 0.94 for 33600, 0.96, 0.96 and 0.97 for 33690, 0.92, 0.91 and 0.90 for 34144, 0.93, 0.95 and 0.96 for 34300, 0.90, 0.91 and 0.93 for 45000, 0.86, 0.85 and 0.85 for 45233, 0.68, 0.75 and 0.76 for 60130, 0.86, 0.89 and 0.86 for 66510, and 0.86, 0.84 and 0.87 for 90500.
Precision by CPV category across negative sampling ratios
The grouped bar chart plots mean precision from 0 to 1 across the 12 C P V categories. For 10 per cent, 50 per cent and 100 per cent negative data, values respectively reach about 0.99, 0.99 and 0.98 for 33100, 0.98, 0.98 and 0.98 for 33140, 0.98, 0.98 and 0.98 for 33141, 0.94, 0.94 and 0.94 for 33600, 0.96, 0.96 and 0.97 for 33690, 0.92, 0.91 and 0.90 for 34144, 0.93, 0.95 and 0.96 for 34300, 0.90, 0.91 and 0.93 for 45000, 0.86, 0.85 and 0.85 for 45233, 0.68, 0.75 and 0.76 for 60130, 0.86, 0.89 and 0.86 for 66510, and 0.86, 0.84 and 0.87 for 90500.Precision by CPV category across negative sampling ratios
 The grouped bar chart plots mean recall from 0 to 1 across the 12 C P V categories. For 10 per cent, 50 per cent and 100 per cent negative data, values respectively reach about 0.82, 0.82 and 0.81 for 33100, 0.77, 0.76 and 0.76 for 33140, 0.83, 0.82 and 0.82 for 33141, 0.75, 0.75 and 0.75 for 33600, 0.76, 0.73 and 0.72 for 33690, 0.29, 0.28 and 0.28 for 34144, 0.74, 0.72 and 0.70 for 34300, 0.29, 0.30 and 0.32 for 45000, 0.41, 0.42 and 0.38 for 45233, 0.20, 0.21 and 0.22 for 60130, 0.51, 0.48 and 0.47 for 66510, and 0.59, 0.62 and 0.62 for 90500.
Recall by CPV category across negative sampling ratios
The grouped bar chart plots mean recall from 0 to 1 across the 12 C P V categories. For 10 per cent, 50 per cent and 100 per cent negative data, values respectively reach about 0.82, 0.82 and 0.81 for 33100, 0.77, 0.76 and 0.76 for 33140, 0.83, 0.82 and 0.82 for 33141, 0.75, 0.75 and 0.75 for 33600, 0.76, 0.73 and 0.72 for 33690, 0.29, 0.28 and 0.28 for 34144, 0.74, 0.72 and 0.70 for 34300, 0.29, 0.30 and 0.32 for 45000, 0.41, 0.42 and 0.38 for 45233, 0.20, 0.21 and 0.22 for 60130, 0.51, 0.48 and 0.47 for 66510, and 0.59, 0.62 and 0.62 for 90500.Recall by CPV category across negative sampling ratios
 The box plot presents A U C scores from about 0.60 to 1.00 across the 12 C P V categories. X G B A U C remains highest across every category, with distributions mostly between about 0.92 and 0.99. Its highest values occur near 0.99 for 33100, 33141, 33690 and 34300, while 34144 and 60130 show lower distributions around 0.91 to 0.94 and 0.90 to 0.95. L R A U C varies more widely, from about 0.65 to 0.91, with relatively high distributions for 33141 and 34300 and lower distributions for 60130 and 66510. H F A U C generally ranges from about 0.67 to 0.85, with higher values for 33690 and 34300 and lower values for 33100, 33140, 33600 and 60130.
AUC distributions by CPV category across model specifications (XGBoost vs baselines), 2018–2021
The box plot presents A U C scores from about 0.60 to 1.00 across the 12 C P V categories. X G B A U C remains highest across every category, with distributions mostly between about 0.92 and 0.99. Its highest values occur near 0.99 for 33100, 33141, 33690 and 34300, while 34144 and 60130 show lower distributions around 0.91 to 0.94 and 0.90 to 0.95. L R A U C varies more widely, from about 0.65 to 0.91, with relatively high distributions for 33141 and 34300 and lower distributions for 60130 and 66510. H F A U C generally ranges from about 0.67 to 0.85, with higher values for 33690 and 34300 and lower values for 33100, 33140, 33600 and 60130.AUC distributions by CPV category across model specifications (XGBoost vs baselines), 2018–2021
Aggregate predictive performance across negative sampling ratios
| Negative ratio (%) | AUC | Precision | Recall | F1-Score |
|---|---|---|---|---|
| 10 | 0.946 | 0.902 | 0.580 | 0.683 |
| 50 | 0.957 | 0.909 | 0.575 | 0.681 |
| 100 | 0.964 | 0.912 | 0.570 | 0.679 |
Values represent averages across 48 CPV-year combinations (12 categories × Four years). Differences in AUC are small across sampling conditions, indicating robust performance
Baseline model performance by CPV category under balanced sampling
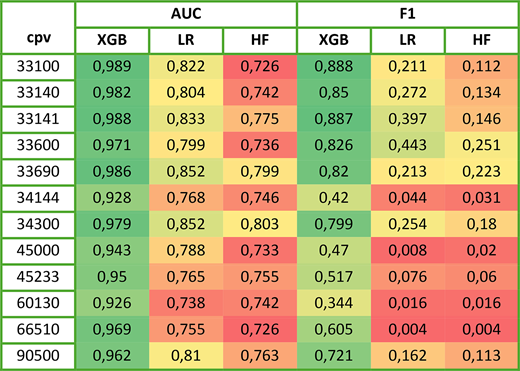 |
Values represent averages across four temporal periods (2018–2021) under balanced sampling conditions (100% negatives). Cell shading is applied independently within AUC and F1 metric groups, with green indicating higher performance and red indicating lower performance within each metric’s range. Categories with largest XGBoost advantages (insurance, transport, construction) exhibit complex multi-party relationships resisting linear modeling
Feature importance across negative sampling ratios
| Feature | 10% | 50% | 100% |
|---|---|---|---|
| Historical frequency (HF) | 0.330 | 0.422 | 0.451 |
| Preferential attachment (PA) | 0.359 | 0.293 | 0.262 |
| Adapted Adamic–Adar (AA) | 0.311 | 0.285 | 0.287 |
Values represent normalized feature gains averaged across all CPV-year combinations. Gains are normalized to sum to 1.0 within each model. The shift toward HF under balanced conditions reflects its role in capturing direct relationship history rather than market-level activity patterns
Predictive performance by temporal period under balanced sampling
| Train year | Test year | AUC | Precision | Recall | F1-Score |
|---|---|---|---|---|---|
| 2018 | 2019 | 0.972 | 0.899 | 0.625 | 0.716 |
| 2019 | 2020 | 0.968 | 0.933 | 0.622 | 0.723 |
| 2020 | 2021 | 0.957 | 0.896 | 0.531 | 0.640 |
| 2021 | 2022 | 0.960 | 0.919 | 0.502 | 0.636 |
Values represent averages across 12 CPV categories for each temporal period. The narrow range in AUC (0.957–0.972) and precision (0.896–0.933) demonstrates temporal stability of structural prediction patterns, while modest variation in recall reflects either changing procurement dynamics or increased relationship complexity in later years

