The paper aims to disentangle the physiological credit risk from the credit risk coming from the inefficient screening and monitoring management process. The analysis is conducted on a sample of 338 Italian banks–56 joint-stock banks (SpA), 23 cooperative banks (Popolari) and 259 mutual banks (BCCs)–over the time period 2006–2017.
The authors use the maximum likelihood method to estimate the efficient frontier, as a set of best management credit practices, which minimises the credit risk defined on the basis of the level of loans granted, the technical structure of the loan portfolio (such as credit lines, mortgages, consumer loans and other technical loan categories) and the interest rate charges.
The empirical results show that the increase in non-performing loans (NPLs) is related both to the severe and protracted recession in Italy, which significantly reduced borrowers' capacity to service their debt, and to other factors, such as banks' lending monitoring policies with limited capacity to work-out defaulted loans.
The authors propose a new approach to the study of the performance of the credit process. With the stochastic frontier, the physiological credit risk, assumed by the bank according to its lending activity and management choices, is separated from the credit risk resulting from an inefficient management of the screening and monitoring process. In addition, the authors analyse the determinants of the excess of NPLs. This aspect is considered particularly original because the scientific contributions which consider the causes of NPLs have largely focused on the level of NPLs not considering the physiological part, linked to the structure of the bank's loan portfolio and its operational strategy and therefore not compressible and in any case not attributable to mismanagement or moral hazard.
1. Introduction
The escalation of non-performing loans [1] (hereinafter NPLs), during periods of financial turbulence, emphasised the relationship between financial stability and economic growth. The strong international link between the soundness of the financial sector and that of public finances has increased the risks for financial intermediaries. The deteriorating loan of banks' portfolio often reveals inherent weaknesses along the credit assessment and monitoring process (Miller and Noulas, 1996). Banks, which in the past experienced problems in managing their loan portfolio, have been characterised by an increased risk resulting in less prudent lending. For this reason, effective management of the credit process makes it possible to detect potential problems in the loan portfolio in advance (Nandi and Choudhary, 2011). In order to detect the first signs of credit deterioration, the bank's management carries out a performance analysis both externally, through the control of the Central Risk Office, and internally, through the analysis of the trend of debits and credits on the accounts of companies using a specific internal office for credit control. This office, by exploiting a significant number of indicators calculated on the performance data and on the basis of the information requested from customers from time to time, may (1) implement all the necessary measures to reduce the negative impact of a default; (2) express an initial assessment of the appropriate classification of the credit and any write-down to be made. However, this information, not being directly observable by the external researcher, makes the direct study of the credit monitoring process and the assessment of its efficiency laborious. This is why scientific literature generally suffers a significant limitation in providing an assessment of the efficiency of the quality of monitoring which is not based on the more or less high presence of problematic loans.
We propose a new approach to the study of the performance of the credit process. With the stochastic frontier, the physiological credit risk, assumed by the bank according to its lending activity and management choices, is separated from the credit risk resulting from an inefficient management of the screening and monitoring process. The gap, which gradually appears between the minimum level of credit risk considered physiological and the actual credit risk adjusted to take account of random errors, is a measure of the inefficiency of the credit process. This inefficiency represents the poor management of the lending process determined either by poorly managed screening of the applicant's creditworthiness or by an ongoing control system which is unlikely to detect early signs of deterioration or both.
Based on a sample of 338 Italian banks–56 joint-stock banks (SpA), 23 cooperative (Popolari) and 259 mutual banks (BCCs)–over the time period 2006–2017, we use the maximum likelihood criterion to minimise the credit risk defined on the basis of the level of loans granted, the technical structure of the loan portfolio (e.g. credit lines, mortgages, consumer loans and other technical loan categories) and the interest rate charged. The empirical results show that the increase in NPLs is related to the severe and protracted recession in Italy, which significantly reduced borrowers' capacity to service their debt. Moreover, at the same time, the fast increase in NPL ratios was also significantly influenced by other factors, such as banks' lending and monitoring policies and limited capacity to work out defaulted loans (Huljak et al., 2020). However, at a certain point, the efficiency of the credit management process (e.g. the screening and monitoring activities) appears improving and becoming effective. Banks' management became more aggressive in managing their NPLs making the process of controlling and disposing of non-performing credits increasingly more efficient. Moreover, by breaking down the analysis according to the size of the banks, while large banks perform better, when considering the physiological level acceptable according to the characteristics of the loan portfolio, size no longer plays a positive role.
We also analyse the determinants of the excess of NPLs. This aspect is considered particularly original because the scientific contributions which consider the causes of NPLs have largely focused on the total level of NPLs not considering the physiological part, linked to the structure of the bank's loan portfolio and its operational strategy and therefore not compressible and in any case not attributable to mismanagement or moral hazard. The decomposition of the NPL ratio makes it possible to independently define the inefficiency of the management of the lending process and therefore to investigate its causes.
A new perspective comes to the fore in the use of the stochastic frontier which extends beyond the mere study of cost and/or production efficiency for the analysis of the performance of financial intermediaries (Berger and Mester, 1997; Coelli, 1998) which, so far, has not been used with reference to the Italian banking system.
The underlying economic intuition is based on different degrees of risk inherent in the credit intermediaries' portfolio. The management of a bank, strategically aware of having acquired riskier debtors, will equip itself accordingly in terms of consistent margins and pricing. But it is also possible that the management may have pockets of inefficiency in the screening and monitoring processes during customer relations. In both scenarios, there could be an increase in the stock of NPLs, but as is easily imaginable, the causes of the expected increase could be of a different nature.
This contribution is structured as follows: the second section presents the literature review. The third section describes the characteristics of the sample. The fourth section presents the methodology adopted, while the fifth section describes in detail the empirical analysis and the results obtained. The sixth section concludes.
2. Literature review
After the introduction of the 1988 Basel Accord on international bank capital standards (Basel I) and subsequent amendments, several contributions investigated the effects of capital adequacy regulations on banks' risk. Ediz et al. (1998) find that bank capital regulation is effective in increasing capital ratios. Salas and Saurina (2003) show that banks with lower capital tend to have higher levels of credit risk in line with the moral hazard hypothesis. Depending on the focus, the literature provides contradictory results as to the effects of capital requirements on bank risk-taking incentives (Freixas and Rochet, 2008). However, the issue of whether higher capital ratios reduce overall banking risk has remained largely unresolved.
Hughes and Mester (1998) provide a prominent contribution to the debate. They argue for the need to consider bank efficiency when analysing the relationship between capital and risk. According to these authors, both capital and risk are likely to be determined by the level of bank efficiency.
In the past 20 years, efficiency analysis has become an “appealing theme” for academic research (Resti, 1997). Data envelopment analysis (DEA) and the stochastic frontier approach (SFA) are the most widely adopted approaches. The advantages of these non-parametric and parametric tools derive from the possibility to improve on methodologies such as discriminant analysis (Retzlaff-Roberts and Puelz, 1996) in order to investigate a firm's inefficiency (through distance from the “best practice”) as an ex ante indicator of business failure and, also, to strengthen the role of qualitative variables in predicting business failure (Becchetti and Sierra, 2003). Several authors have adopted the SFA, developed by Aigner et al. (1977), to assess the efficiency of companies in the financial environment (Aly et al., 1990; Kaparakis et al., 1994; Allen and Rai, 1996; Berger and Mester, 1997) and as a tool with which to detect inefficiency measures in both financial and non-financial sectors (Jondrow et al., 1982; Ferrier and Lovell, 1990; Hunt-McCool et al., 1996).
Looking at the intersection between the problem loans literature and the bank efficiency, Berger and De Young (1997) and Kwan and Eisenbeis (1997) argue that bank efficiency needs to be recognised explicitly in empirical models analysing the determinants of banks' risk. Berger and De Young (1997) employ Granger causality methods to assess the inter-temporal relationships between problem loans, cost efficiency and capital for a sample of US banks from 1985 to 1994 and find that declines in cost efficiency precede increases in problem loans (particularly at thinly capitalised banks) and that problem loans result in reductions in cost efficiency. Kwan and Eisenbeis (1997) use a simultaneous equation framework to test hypotheses about the interrelationships between bank risk, capitalisation and operating efficiency. Williams (2004) uses Granger causality techniques to assess the inter-temporal relationships among problem loans, cost efficiency and financial capital in a sample of European savings banks over the period 1990–1998 and finds that poorly managed banks tend to make more poor quality loans. Altunbas et al. (2007) use a static simultaneous equation framework to investigate the relationship between capital, loan provisions and cost efficiency for a sample of European banks over the period 1992–2000 and, in contrast to Williams (2004), report a positive relationship between inefficiency and bank risk-taking with inefficient European banks appearing to hold more capital and take on less risk. Fiordelisi et al. (2011) assess the inter-temporal relationship between bank efficiency, capital and risk in a sample of European commercial banks employing several definitions of efficiency, risk and capital and using the Granger causality methodology in a panel data framework. Their results suggest that lower bank efficiency with respect to costs and revenues Granger causes higher bank risk and that increases in bank capital precede cost efficiency improvements. The contributions so far outlined recognise the important role of credit monitoring and how the inefficiency of a bank often preceded the increase in non-performing loans and favours the emergence of opportunistic behaviour by banks' management. However, the development of an efficiency indicator for credit monitoring has remained and still remains a highly debated issue in scientific literature.
The importance of credit monitoring has been investigated indirectly through the identification of some specific variables that can influence the quality of loans (González-Hermosillo, 1999; Saba et al., 2012; Jakubík and Reininger, 2013; Messai and Jouini, 2013; Zhang et al., 2016; Piatti and Cincinelli, 2019). Along this line, the work of Berger and De Young (1997) was a “trailblazer”. Other studies (Sufi, 2007; Focarelli et al., 2008; Ivashina, 2009) extend the issue of bank monitoring to the context of syndicated loans. The above confirms the fact that the quality of monitoring is never investigated directly but is always implicitly deduced by observing its consequences in terms of non-performing loans. In literature, the absence of contributions aimed at considering aspects directly related to the quality of credit monitoring is evident, although in the modern theory of financial intermediaries, the justification for their existence is to be referred, in particular, to the advantage they have in monitoring borrowers (Leland and Pyle, 1977; Diamond, 1984). Works exist which empirically use individual determinants of the quality of monitoring, such as the quantity and skills of the monitoring staff (Coleman et al., 2006; Lee and Sharpe, 2009), the expected loss (Billett et al., 1995; Cook et al., 2003; Saurina and Trucharte, 2017), the loss given default (Bastos, 2010) or the recovery rate (Khieu et al., 2012), but with intents other than the building of an efficiency score (Jin et al., 2018).
Hughes and Moon (2018) made a significant contribution to the debate on monitoring the banking process through a new approach to studying the performance of the credit process. The authors, with the help of the stochastic frontier, break down the physiological credit risk, assumed by the bank based on its lending activity and the conscious choices of management, from the credit risk resulting from the inefficient management of the screening and monitoring process. Inefficiency in the conduct of the credit process is measured by the distance from the minimum level of credit risk, considered ”physiological”, and the actual credit risk adjusted for random error. A new perspective emerges in the use of the stochastic frontier which goes beyond the mere study of cost and/or production efficiency in order to analyse the performance of financial intermediaries (Berger and Mester, 1997; Coelli, 1998).
The quality of monitoring is considered a relevant element by the supervisory authorities, which have defined specific guidelines (BI, Bank of Italy, 2006; ECB, European Central Bank, 2017) which banks must respect both in defining their internal process regulation activities and in structuring internal credit controls. From the regulator's perspective, the ability of management to recognise deteriorating customer creditworthiness in a timely manner and to prepare adequate measures to cover future losses is welcomed. The supervisors prefer both a broad and a prudent loss coverage (Agénor and Zilberman, 2015). A high degree of loss coverage, combined with an efficient system of internal controls, also influences the number and intensity of on-site inspections by supervisors, since profitability and capitalisation are the variables often used to define failing banks. It should be noted, however, that the many recommendations and guidelines tend to define the characteristics which the underlying monitoring processes–such as loan classification, adequacy of allocations, adequacy of the recovery process, consistency with the risk premium–should have. On the other hand, the specific variables to be monitored are not specified as they are largely linked to the size and technical characteristics of the banks and left to their discretion. Furthermore, the inefficiency is not considered of the monitoring of the credit process, which permits analysing the gap between the minimum level of credit risk considered physiological and the actual risk to take account of random error. In the Italian banking system, to date, scientific contributions analysing such a breakdown of credit risk do not appear to have been made.
3. The data
3.1 Supervisory and resolution framework of NPLs
Over the last two years, Italian banks experienced a significant decrease in NPLs volumes. Starting from a total of £341bn at the end of 2015, the NPLs stock progressively declined, reaching £264bn at the end of December 2017. All the categories of NPLs, bad loans, unlikely to pay and past due, showed a positive trend [2]. The Bank of Italy adopted the definitions of NPLs in line with the Single Supervisory Mechanism (SSM) and the European Banking Authority (EBA) standards published in 2013. Harmonising the EBA definitions did not change the NPLs aggregate, as it was basically aligned with the definitions already in use in Italy. It was also decided to maintain greater depth of detail in the Italian statistics and to continue to update the time series for NPLs subcategories used in the past (i.e. bad debt, substandard, restructured, past due). This reflects the possibility to measure, in Italy, the subset of NPLs resulting from more serious situations. Gross bad loans decreased to £165bn, reducing by £35bn over the last year. Unlikely to pay and past due registered a declining trend standing at £94bn, from £117bn at December 2016, and £5bn, from £7bn, respectively. The northern regions have a lower gross NPLs stock relative to the ones in the centre and south of the country. Looking at the breakdown of gross NPLs by counterparty, the corporate and the small medium enterprise (SME) sectors hold the greatest share, roughly 66%, followed by the consumer sector, 24% (BI, Bank of Italy, 2017; PwC, Price whaterhouse Coopers, 2017).
The European Union bank resolution regime (i.e. the Single Resolution Mechanism [3] and the Bank Recovery and Resolution Directive [4]) has introduced an important legislative framework in addressing the rise of NPLs. In order to strengthen the capital rules and banking supervision of the member states, the European Central Bank (ECB) established a prudential regime for NPLs. A set of monitoring tools to assess banks' balance sheet through on-site inspections, stress tests and asset quality review represent the architecture of SSM (ECB, European Central Bank, 2017).
Moreover, the 2015 and 2016 Italian reforms have significantly improved the regulatory framework for managing NPLs, introducing targeted measures to reduce recovery times and improve recovery rates. In particular, the Law n. 132 of 6th August 2015, which converted Law Decree n. 83 of 27th June 2015 (the so-called “anti credit crunch decree”), introduced measures to shorten bankruptcies, to facilitate voluntary agreements, to speed up the foreclosure process and to introduced tax deductibility on loan losses and impairments. In January 2016, following an agreement reached with the European Commission, the Italian Government introduced a state guarantee scheme, the so-called GACS (Garanzia sulla Cartolarizzazione delle Sofferenze), to facilitate the removal of bad debts from the books of commercial banks [5]. The Atlante Fund, April 2016, a private sector initiative set up by an independent funds management company (Quaestio Capital Management) that sources capital from financial institutions (banks, insurance companies and foundations that invest on a voluntary basis) which aims to ensure the success of the capital increases required by the regulatory authority of banks and to contribute to the start-up of a market for non-performing bank loans. The Decree Law n. 59 of 2016, converted into law at the end of June 2016, introduced new measures to promote a more effective management of NPLs by banks.
3.2 The sample
The sample includes Italian banks in the form of SpA, Popolari and BCCs from the ABI Banking Database [6]. The sample does not include (1) banks specialised in asset management and investment banks characterised by a heterogeneity of business compared to traditional banks; (2) banks with total assets of less than 100 million euros [7]. As a result, the number of banks considered is 338 (56 joint stock, 23 cooperative, 259 BCC) over the period 2006–2017 representing the 64.68% of the total assets of the Italian banking system.
Table 1 shows the descriptive statistics relating to the variables used to define inefficiency in the credit process. A larger bank size corresponds to a smaller stock of NPLs (both gross and net). Small banks and minor banks–characterised by a volume of intermediated funds between 3.6 and 21.5 billion and less than 3.6 billion euro–have, on average, a gross NPL ratio of 12% relative to banks belonging to the first five banking groups and large banks for which, on average, the level of NPLs is 11% and 9%, respectively. With regard to technical loan categories, small banks and mutual banks have a significant share of mortgage loans compared to larger banks. Mortgage loans represent a significant part of the loan portfolio of mutual banks, at 61.52%, while for large banks and those belonging to the top five banking groups, this percentage is 41.12 and 45.71%, respectively.
Table 2 reports the correlations between variables. Significant relations appear between the size and structure of all the considered technical loan categories, the average rate of the same and the stock of NPLs.
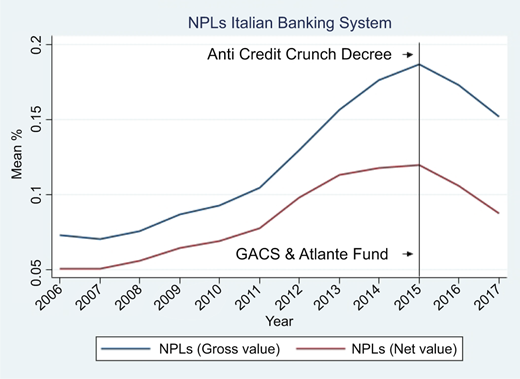
Figure 1 shows the NPLs trend (both gross and net values) in the Italian banking system over the time period 2006–2017. After the peak reached in 2015, the stock of NPLs progressively declined. The Italian reforms–i.e. anti credit crunch decree, GACS and Atlante Fund–were effective in the reduction.
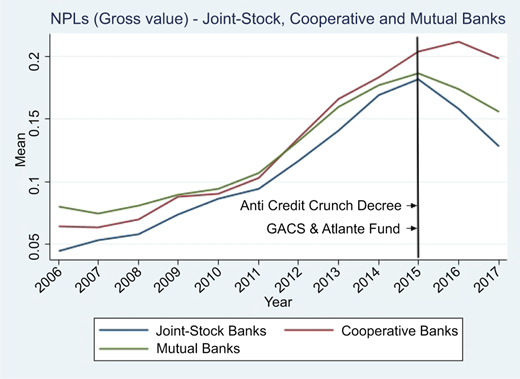
Figure 2 reports the NPLs trend for each kind of bank. As noted for the Italian banking system, each category of bank, in particular the Joint-stock banks, experienced a significantly decline since 2015.
4. Methodology
4.1 Measuring the credit process inefficiency
For a bank, the level of NPLs stands for ex post credit risk. However, it is not entirely synonymous with inefficient credit management. Only a portion of NPLs is attributable to inefficiency which may be measured by the distance from the minimum credit risk level, considered physiological and the actual credit risk adjusted to consider the random error. Following the approach of Hughes and Moon (2018), with the use of the stochastic frontier, we can disentangle the physiological credit risk, assumed by the bank, based on the lending activity, from the credit risk resulting from an inefficient management of the screening and monitoring process. In other words, we examine the level of NPLs according to the level of loans granted by a bank and a series of control variables related to the technical structure of the loan portfolio and the average loan rate applied. The composition of the loan portfolio makes it possible to capture the impact that different technical loan categories have on the probability of default. Three loan categories are considered: (1) opening of credit, (2) mortgages and (3) consumer credits. Moreover, to consider the possible non-linearity of the relations, all the above variables are also entered with their squared term. The average interest rate on loans has been included because, on average, it should take account of a premium risk and thus affect the quality of the loan portfolio itself [8]. In formal terms, we shall use the following specification:
where NPLsi represents the credit risk observed for the i-th bank, measured by the ratio of gross NPLs to total gross loans. Gross NPLs are considered because some banks may present a more aggressive strategy in provisions and loan write-downs. Therefore, gross NPLs have been used to eliminate these distortions and, since they are not influenced by the policies of provisions and write-downs, they are more objective and make possible a more homogeneous comparison between banks; X is a vector including loan level and control variables: X1gross loansi is the value of the gross loan portfolio expressed in millions for the i-th bank; X2; ; ; ; ; ; ; X9 average rate on loans represented by the ratio between interest revenues over total gross loans; ɛi = νi + μi is the compound error term which allows disentangling the random and normally distributed statistical error ν ∼ i.i.d. N(0, σν2) from the systematic excess of credit risk representative of inefficiency. It is assumed that the inefficiency term μi follows an exponential distribution μi(≥ 0) ∼θexp(−θυ). Such term measures the excess of NPLs ratio compared to the best practice minimum level. The deterministic kernel of the stochastic frontier represents the minimum level of NPLs conditioned by control variables. In other words, it represents the minimum level under the assumption that the bank manages the credit process completely efficiently and can be represented as follows:
where Best practice NPLsi is the NPLs frontier, and other terms are known. Equation (2) represents the minimum expected value of NPLs at the deterministic frontier. Given the control variables, the value of best practice NPLs represents the ex post credit risk of a bank as if it had used the maximum efficiency in the conduct of the credit process in terms of both screening and monitoring. The systematic excess between the volume of NPLs observed and adjusted for stochastic noise and the NPLs lying on the frontier, according with Jondrow et al. (1982), is given by:
The random noise can instead be expressed as the expected value of νi conditioned to ɛi:
The NPLs, minus the random error, becomes:
Equation (1) allows disentangling the effective NPLs of each bank into three components: (1) the best practice NPLs (i.e. the minimum level of NPLs in the case of complete efficiency); (2) “fortune/misfortune” (i.e. the statistical noise) and (3) the excess NPLs tied to actual inefficiency in the management of the credit process. In formal terms, we have:
Therefore, in order to achieve higher loan growth, bank managers may have to accept riskier positions potentially generating higher future losses.
We evaluate the yearly inefficiency of credit process for the 2006–2017 time period. On the one hand, we argue that the adoption of multi-period analysis, differently from Hughes and Moon (2018), allows us to estimate the dynamics of inefficiency over time. On the other hand, from an econometric point of view, the choice for cross-sectional instead of panel frontier allows us for a check on robustness of the results for the specific time period related to the global financial crisis and the sovereign debt crisis in Europe (2006–2014), and for 2015, 2016, 2017, i.e. the time period after the Italian reforms on NPLs [9].
Such variation is aimed at estimating the dynamics of inefficiency over time. It is worth noticing that, on the one hand, since the deterioration in quality loans occurs with some delay (Clair, 1992), bank managers may have to accept riskier positions potentially generating higher future losses but which allow them to achieve higher loan growth and to boost short-term profitability to the benefit of shareholders and managers via their performance-based remuneration. In fact, if banks with significant previous losses or with significant levels of NPLs make additional loans (i.e. higher loan growth ratio), they may temporarily reduce the NPLs ratio due to the dilution effect (Zhang et al., 2016; Cincinelli and Piatti, 2017). On the other hand, it is also possible that, over the years, the bank' management may have accumulated inefficiency due to weak appraisal and monitoring of potential borrowers' processes (e.g. the screening of potential borrowers at the point of loan origination, monitoring of credit quality during the life of the loan and awareness of available restructuring options for NPLs). One possible explanation, according to Kokkinis and Miglionico (2020), is that a bad bank' management may rise corporate governance issues of directorial and managerial skills, experience and expertise, quality of oversight and robustness of internal control procedures. According to what is emphasised, banking managers could strike a balance between economic performance and credit risk management and make more appropriate decisions in line with their preferences. In both situations, NPLs could increase, but the causes do not depend on the structure of the loan portfolio.
The determinants of the inefficiency level of credit process are investigated through the following dynamic panel equation:
where yi,t is the dependent variable, related to the i-th bank at time t, alternatively represented by the inefficiency of the credit process, (i.e. the excess of NPLs over the best practice), the level of best practice NPLs (i.e. the level of NPLs without inefficiency), and the NPLs actually observed. Xi,t−1 includes TIER1i,t−1 capital ratio [10]; ROAi,t−1 is the return on asset ratio between profit before taxes and total assets; GLGRi,t−1, i.e. the gross loan growth rate; Cost-to-Incomei,t−1 is the cost-to-income ratio measured by operating expenses over the intermediation margin; GDP growtht−1 captures the macro-economic conditions or business cycle for Italy; Sizei,t−1 is the natural logarithm of total assets.
The model also includes the fixed effect both at bank level and at time level. To overcome issues related to dynamic panels, we will use the generalized method of moments (GMM) system estimator adding time delays of variables by levels and differences (Arellano and Bover, 1995; Blundell and Bond, 1998). In addition, the two-step GMM system with Windmeijer' (2005) correction is used to obtain robust estimates.
5. Empirical analysis
The empirical analysis is composed of two sections. The first (5.1) considers the results tied to the breaking down of the NPLs into three components: (1) excess, (2) best practice level and (3) actually observed level. The second (5.2) reports the results of the inefficiency determinants.
5.1 Inefficiency in the credit process
Table 3 shows the results regarding the stochastic frontier over the time period 2006–2017, as specified in Section 4.
For a given volume of loans, two different relations are reported. First, the period 2012–2017 shows a U-shape where, up to a certain size level, the loans growth rate negatively affects the stock of NPLs. Second, the period 2006–2011 shows an opposite (positive) relation with NPLs ratio relative to the 2012–2017 time frame. The latter is intuitive, higher loans volumes may be associated with higher levels of NPLs. The first relation, instead, could be explained by the impact of the global financial crisis weakened the demand for loans coming from the corporate sector. Under these conditions, at the time of loan origination, companies were characterised by high credit standards with low probability of default. An increase in performing loans led to a decrease in the NPLs ratio. The variable referring to the average interest rate appears statistically significant and positive for the entire period of analysis. On the one hand, banks' management tend to charge higher rates on riskier loans to offset higher loss provisions and capital absorption. On the other hand, riskier loans are more likely to become non-performing.
The impact of technical loan categories is interesting. In particular, bank overdrafts and consumer loans show a U-shaped trend. Up to a certain amount, they have a negative impact on the NPLs ratio while above a certain amount the sign becomes positive. A different relationship is reported by mortgages loans: up to a certain level they contribute to an increase in NPLs, while above the maximum level, their increase contributes to the contraction of NPLs. The sign and significance of the impact therefore tend to differ according to the various technical loan categories and are also a function of the product and customer policies implemented by the bank management, within its business model and technological evolution. The same results hold when the net NPLs are considered as a dependent variable [11].
Table 4 report the results obtained from the stochastic frontier approach and split up into three NPLs ratio components: (1) the correct NPLs to take randomness into account; (2) the best practice NPLs, without inefficiency, representative of the physiological credit risk tied to the level of the loans and to the applied rate controlled for the various technical loan categories and (3) the excess of the NPLs compared to the minimum, associated to actual inefficiency itself.
From Table 4, a higher NPLs ratio is associated with a lower bank size. One possible explanation is that larger banks have more diversification opportunities, and as such they may reduce the level of troubled loans (Salas and Saurina, 2002; Rajan and Dhal, 2003). In addition, larger banks are better able to evaluate loan quality because of their richer resources (HU et al., 2004). Large banks, not belonging to the first 5 groups, seem to perform better than other banks, with a NPLs level of 8.94% on average for the period under observation and with an excess of NPLs compared to best practice of only 2.79%. The mutual banks, surprisingly, show higher values compared to the big banks, but lower than the small banks which are at the bottom tier of the average ranking. It is worth noticing that the diversity of the averages of the break-down elements of the NPLs is statistically significant in terms of size as shown in Table 5.
Table 6 shows the excess of NPLs trend for the Italian banking system and for each kind of group.
Considering the entire sample, the NPLs ratio increases dramatically from 7.09% in 2006 to 18% in 2015 before starting to decrease and reach 15.76% in 2017, with an average value for the entire 2006–2017 period of 12.03%. One possible explanation of such increase is the severe and protracted recession in Italy and in several countries of the euro area, which significantly reduced borrowers' capacity to service their debt. Moreover, at the same time, the fast increase in NPL ratios was also significantly influenced by other factors, such as banks' lending and monitoring policies and limited capacity to work-out defaulted loans (Huljak et al., 2020).
However, at a certain point, the efficiency of the credit management process (e.g. the screening and monitoring activities) appears improving and becoming effective. Banks' management became more aggressive in managing their NPLs making the process of controlling and disposing of non-performing credits increasingly more efficient.
As regards the four banking groups, we note that with regard to NPLs’ levels, larger banks perform better confirming both their broader diversification opportunities and their ability to evaluate more accurately loans quality thanks to their richer resources. However, with regard to the physiological level acceptable according to the characteristics of the loan portfolio (i.e. the best practice level), size no longer plays a positive role.
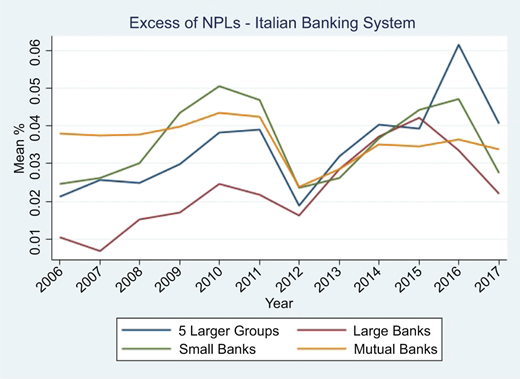
We also investigate the trend of the excess of NPLs in Figure 3. We note that, between 2006 and 2011, larger banks are the most efficient in managing the credit process, followed by the large banks belonging to the first five groups. Small banks and mutual banks seem to be less efficient.
Starting from 2012, the excess of NPLs decreases. One possible explanation is that this variation may be related to several sources of exogenous variations in NPLs ratio. According to Huljak et al. (2020), this change may be related to: (1) the application of a new definition of non-performing exposures [12]; (2) the application of the technical standards on NPLs and forbearance by the EBA (2013) which required banks to record additional provisions and in some cases also affected their capital positions; (3) the transfer of NPLs from banks to asset management companies (AMCs); (4) the impact of supervisory actions and (5) the so called “strategic defaults” [13], i.e. defaulters are unwilling, rather than unable to pay back their loan.
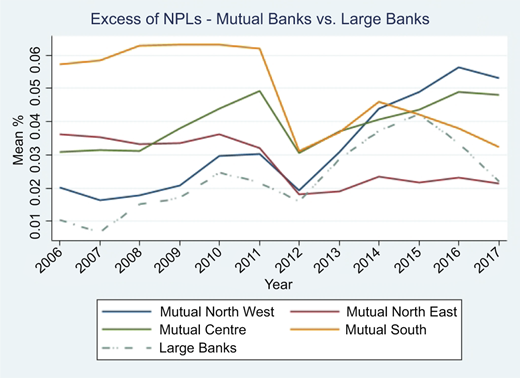
During 2013 and 2017, we also note that mutual banks are the most efficient relative to larger banks. While it is true that larger banks show a lower level of NPLs than smaller banks and mutual banks, the level is much higher than the minimum level, to be considered physiological according to best practice. The smaller banks show a higher level of NPLs, but the gap compared to that considered physiological is smaller than larger banks. From this viewpoint, Figure 4 [14] shows the different evolution of the excess of NPLs for mutual banks (according to their geographical location) and for large banks.
Mutual banks in the northeast show a more stable and improving efficiency as regards the management of the screening and monitoring process, with an important gap not only compared to the other mutual banks, located in different macro-areas, but also compared to the larger banks. It is clear that only the excess of NPLs represents real inefficiency, i.e. the poor management of the lending process determined either by a screening activity unable to correctly assess the creditworthiness of the applicant or by a control system which is not inclined to promptly reveal the first signs of deterioration or by both factors. This excess of NPLs is actually what management should focus on as it represents greater absorption of financial resources which are not adequately remunerated and of which the bank may often not be fully aware.
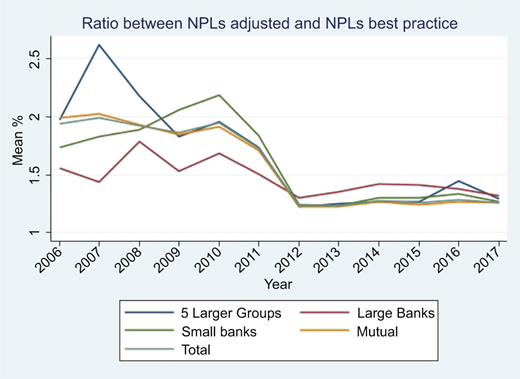
Moreover, Figure 5 compares the NPLs–adjusted to take into account management misfortune (not attributable to management)–with the best practice NPLs, i.e. the minimum level of NPLs observable by best practice if there were no inefficiency. A value higher than one indicates the presence of inefficiency [15].
Until 2012, the NPLs was for some years (2007) and for some banks (5 groups) 2.6, i.e. 160% higher than the physiological level. Since 2012, the level of inefficiency has improved considerably, although there is still more to be done, given that in 2017 there is still an average NPLs level 20/30% higher than physiological, depending on the size of the company. It is worth noticing that the effort to reduce NPLs has involved the entire Italian banking system, regardless of the type of bank.
5.2 Determinants of the excess of NPLs ratio
In this section, we analyse the determinants of the excess of NPLs. This aspect is considered particularly original, because the contributions which consider the causes of NPLs only focused on the total level of the NPLs ratio, without considering the bank' loan portfolio composition and its lending strategy.
Table 7 reports the summary statistics with regard to the determinants of the excess of NPLs [16]. The average level of capitalisation of the banking system, over the period 2006–2017, is 18.3%, while the average profitability is around 2.6%. On average, the change in loans as a percentage of total assets is 2.9% while the cost income ratio is around 69%. Table 8 shows the correlation matrix between dependent and independent variables.
Table 9 reports the empirical results. In columns (1) and (2), the dependent variable is the excess of NPLs. The difference between the columns (1) and (2) is represented by the inclusion, in column (1), of an additional 2-year delay of the dependent variable. In column (3), the dependent variable is the minimum level of NPLs, and in column (4), the dependent variable is NPLs ratio.
It is worth noticing that the only variables statistically significant in explaining the excess of NPLs are (1) the previous levels of the same inefficiency; (2) profitability and (3) the increase in loans compared to total assets. Intuitively, the degree of inefficiency experienced in the past could also influence the current level of inefficiency. The level of inefficiency is negatively correlated to profitability, which has high statistical significance. The higher profitability represented by the ROA makes it possible to reduce inefficiency, thus confirming that the possibility of having more resources to devote to a more effective credit process. Moreover, profitability is significant regardless of the employee variable used. Therefore, the increased resources not only improve process efficiency, but it is also true that banks with a lower stock of NPLs appear more profitable.
Credit efficiency is also negatively linked to loan growth and actual NPLs. This suggests that those banks more oriented towards business financing show a lower level of NPLs. An increase in loans may dilute NPLs inasmuch as non-performing credits being equal (the ratio numerator) loans tend to increase (the ratio denominator). This, however, is only a short-term circumstance. If the objective, in fact, is the simple dilution of the ratio, it is possible that a moral hazard phenomenon be triggered that leads, in the medium term, to an increase in credit risk (Zhang et al., 2016; Cincinelli and Piatti, 2017).
The GDP growth rate has been included as a macro-variable. The negative and statistically significant relationship widely reported in literature is confirmed. What, however, can be seen from our model is that this relationship is significant when the dependent variables are represented by the physiological NPLs and by the one actually observed. Its impact on the degree of inefficiency is not however significant. This circumstance is economically plausible when it is thought that inefficiency in the management of the credit process can lead to a significant increase in NPLs, regardless of economic trends. An approximate degree of screening with little attention to actual creditworthiness together with an ineffective monitoring process in the timely assessment of possible insolvency problems fatally leads to an increase in NPLs even in an expanding economy. Surprisingly, Size, which could in itself, as it appears from literature (Miller and Noulas, 1996; Salas and Saurina, 2002; Rajan and Dhal, 2003), be an element that favours the diversification and rationalisation of processes, in our analysis does not appear significant.
As regards mutual banks, we now want to verify whether any specificities exist for them. In this regard, Table 10 shows the estimated coefficients of the model.
In fact, on the whole, the determining variables appear to also be the same for mutual banks with two specific aspects to be underlined. The first concerns Size, which in the complete model (Table 9) did not appear to be significant and which, instead, as regards mutual banks, takes on some importance. With regard to mutual banks, in fact, size seems to play a major role in relation to the level of NPLs, regardless of the dependent variable considered. For mutual banks, it is true to say that size can offer greater opportunities for diversification in the loan portfolio, allowing, on the one hand, better management in disposal and, on the other hand, favouring the efficiency of the processes themselves. The second factor concerns geographical location. While this variable has not been considered in the general model because it is irrelevant for banks with branches throughout the country, for mutual banks, given their strong territorial and community vocation, it is of strategic importance. In fact, mutual banks located in the centre and south of the country are at a clear disadvantage compared to those located in the northwest (headquarters location) and northeast, solely because of their location. This seems to suggest that the creation of a cooperative banking group is a good thing, as long as it takes responsibility, in the management of the group's overall credit risk, for exploiting diversification.
Some considerations can be drawn from this analysis. First of all, the variables that in some way make it possible to reduce inefficiency in the credit process are also those that generally represent the determinants of NPLs in literature. Nevertheless, the minimum “physiological” NPL level calculated on the stochastic frontier as if banks were totally efficient is not substantially influenced by these variables, except for profitability. From this it is clear that the variables considered in literature, which are decisive for explaining the level of NPLs, do not in actual fact explain this ratio at all. They do make it possible, instead, to explain, as can be seen from the analysis of the paper, the excess of NPLs attributable to inefficiency. The minimum level of NPLs, however, cannot be reduced only through more efficient management of the credit process. This at most reduces pockets of inefficiency, but does not affect the accumulated stock.
6. Conclusions
In this paper, we separated the physiological credit risk, assumed by the bank' management according to its lending activity, from the credit risk resulting from the inefficient management activity (i.e. screening and monitoring lending process). Based on a sample of 338 Italian banks–56 SpA, 23 Popolari and 259 BCCs–over the time period 2006–2017, the inefficiency credit process is measured by the distance from the minimum level of credit risk, considered physiological and the actual credit risk adjusted for random error.
We found that the increase in NPLs is related both to the severe and protracted recession in Italy, which significantly reduced borrowers' capacity to service their debt, and to other factors, such as banks' lending monitoring policies with limited capacity to work-out defaulted loans. We also found that at a certain point, banks' management became more aggressive in managing their NPLs making the process of controlling and disposing of non-performing credits increasingly more efficient.
We investigated the determinants of the excess of NPLs and we found that ROA, loan growth rate and business cycle are the prominent variables affecting it. We also found that mutual banks located in the centre and south of Italy increased the excess of NPLs ratio.
Our study also provides important policy implications for regulators. First, an increase in NPLs may have a negative impact on the resilience of the banking sector to shocks, thus increasing systemic risk. Second, an increase in NPLs may also be associated with higher funding costs and a lower supply of credit to the real economy. Third, banks' corporate governance provides challenges that are different to those provided by corporate governance as a whole. It is not only focused on the minimisation of managerial agency costs and the harmonisation of management' interest with those of shareholders. Banks' corporate governance is become a prominent part of the micro-prudential framework that aims to face the risk of failure of individual financial institutions.
Micro- and macro-prudential supervisors should monitor developments in risk-taking in the financial system and should seek to anticipate future non-performing credit problems, through the development of early warning systems to monitor the risks of credit portfolio deterioration. They also play the vital role of adopting and bringing bank governance into line with existing legislation. Nevertheless, banks' management continues to be responsible for adequately managing their loan portfolios.
The monitoring of loans should ensure that banks have adequate mechanisms in place to provide accurate information on the status of loans. Adequate and effective loan monitoring enables timely action to be taken against borrowers with early warnings of poor performance. Banks' management, which monitor their exposures thoroughly and are able to address emerging problems in a timely manner (e.g. when the loan is still outstanding or has recently expired), should be in a better, almost “privileged” position to avoid significant increases in NPLs.
Future studies should focus on a number of key areas outside both micro- and macro-prudential supervision, which are strongly rooted in the economic environment in which a banking system operates.
Notes
The presence of different definitions of non-performing loans among the different banking systems requires a cautious interpretation of the stocks being compared. To this end, scientific literature acknowledges, as a common reference point, the definition of default provided by the Basel Committee, i.e. “an obligor is unlikely to pay its credit obligations to the banking group in full, without recourse by the bank to actions such as realising security (if held)”; or “the obligor is past due more than 90 days on any material credit obligation to the banking group”, (BCBS, Basel Committee on Banking Supervision, 2009, paragraph n. 452).
The three subcategories are (1) bad loans: exposures to debtors that are insolvent or in substantially similar circumstances; (2) unlikely-to-pay exposures: (aside from those included among bad loans) are those in respect of which banks believe the debtors are unlikely to meet their contractual obligations in full unless action such as the enforcement of guarantees is taken; (3) overdrawn and/or past due exposures: (aside from those classified among bad loans and unlikely-to-pay exposures) are those that are overdrawn and/or past-due by more than 90 days and for above a predefined amount. See EBA (2013) and ECB (2014) reports.
Regulation (EU) N. 806/2014 of the European Parliament and of the Council of 15th July 2014.
Directive 2014/59/EU of the European Parliament and of the Council of 15th May 2014.
The GACS is available for senior tranches of securitised bad debts.
The ABI Banking database belongs to the Italian Banking Association (ABI).
Following mergers between banks, limited to Banca San Paolo di Torino and Unicredit and due to high values, the accounting assets and liabilities of the merged banks were added to incorporated banks in the years prior to incorporation. No adjustments were made for the other banks. Therefore, the sample only includes banks that may have incorporated other banks, but there are no incorporated banks.
Alongside these control variables, Hughes et al. (2019) also consider the market conditions in which a bank operates and a number of macroeconomic conditions. We have decided not to include these variables in our analysis, since, unlike the analysis carried out by Hughes et al. (2019), ours refers only to Italy and therefore banks find themselves, regardless of their size, operating in a substantially homogeneous market.
We follow the approach adopted by Hughes et al. (2019). The authors, in addition to data from 2013, examine 2003 data capturing the period five years before the crisis and from 2016, when the fintech phenomenon began to gain traction. Moreover, although panel data methodology is desirable in stochastic frontier analysis see for example: Greene (1980) and Kumbhakar and Lovell (2003), to our knowledge, we would have obtained a temporal variability of inefficiency which it would not been suitable for the aim of this research.
The regulatory solvency measures established by the Basel Committee (TIER 1, TIER 2 and Total Capital TIER, Equity TIER 1, Additional TIER 1 and Total Capital under Basel III, as well as other key solvency measures, such as Core TIER 1 or TIER 1 Common) are defined in terms of risk weighted assets (RWA). However, Basel III will gradually introduce a new solvency measure, the leverage ratio, initially defined as TIER 1 capital on total non-weighted and off-balance sheet assets. Because of the holding period taken into account, this document takes into account the RWA ratio (Le Leslé and Avramova, 2012).
The results, related to the net NPLs, are shown in Table A1 in the Appendix.
In 2006, the International Monetary Fund (IMF) recognises that reporting practices, regarding the comparability of NPLs ratio, were different among countries.
Strategic defaults tend to occur when borrowers see other borrowers defaulting on their obligations without any immediate implication for them.
In the Appendix section, Table A2 reports the summary statistics for mutual banks by geographic position.
As an example, a value of 1.7 means that the level of noise adjusted NPLs is 1.7 times the level of best practice NPLs. In other words, the NPLs level is 70% higher than the physiological level, given the structure of the loan portfolio.
In the Appendix, Table A3 shows the descriptive statistics considering each bank group.