


Buckling should be carefully considered in steel assemblies with members subjected to compressive stresses, such as bracing systems and truss structures, in which angles and built-up steel sections are widely employed. These type of steel members are affected by torsional and flexural-torsional buckling, but the European (EN 1993-1-2) and the American (AISC 360-16) design norms do not explicitly treat these phenomena in fire situation. In this work, improved buckling curves based on the EN 1993-1-2 were extended by exploiting a previous work of the authors. Moreover, new buckling curves of AISC 360-16 were proposed.
The buckling curves provided in the norms and the proposed ones were compared with the results of numerical investigation. Compressed angles, tee and cruciform steel members at elevated temperature were studied. More than 41,000 GMNIA analyses were performed on profiles with different lengths with sections of class 1 to 3, and they were subjected to five uniform temperature distributions (400–800 C) and with three steel grades (S235, S275, S355).
It was observed that the actual buckling curves provide unconservative or overconservative predictions for various range of slenderness of practical interest. The proposed curves allow for safer and more accurate predictions, as confirmed by statistical investigation.
This paper provides new design buckling curves for torsional and flexural-torsional buckling at elevated temperature since there is a lack of studies in the field and the design standards do not appropriately consider these phenomena.
1. Introduction
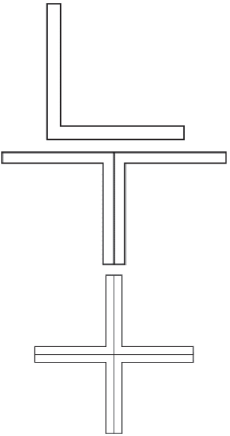
Steel angle, cruciform and tee sections are frequently employed in bracing systems or in truss structures, in which they are mainly subjected to compressive actions. Thus, their resistance can be affected by instability phenomena. Local effects are negligible for compact sections and global buckling modes govern the behaviour of the steel elements. Unless flexural buckling is prevented by lateral restraints, in compressed hot-rolled or welded I or H profiles, torsional effects are rare. Nonetheless, for angle, tee and cruciform steel sections, torsional or flexural-torsional buckling can be relevant, notably in a low slenderness range. Hereafter angles, tee and cruciform sections are referred to as L, T and X sections, respectively.
Bracing systems and truss structures can be commonly found, for instance, in single-storey buildings, such as industrial halls. These structures may store large quantities of combustible material; thus, fire can be a significant threat. Consequently, assessment of the structural fire performance becomes paramount. In addition, these building typologies are generally characterised by large floor areas that increase the probability of ignition. Indeed, also the fuel material may be of particular hazardous nature, e.g. chemical substances, paints, that enhance the danger of fire occurrence too. Hence, the spread of a fire may have significant consequences. In terms of fire risk, for instance Possidente et al. (2020) showed an example of application of fire risk assessment applied to a multi-storey steel building.
In the European norm, prescriptions for the design of compressed steel members are given in two separate codes for ambient, EN 1993-1-1 (CEN (European Committee for Standardisation), 2005a), and elevated temperature, EN 1993-1-2 (CEN (European Committee for Standardisation), 2005b), respectively. Instead, the American Specification for Structural Steel Buildings AISC 360-16 (AISC American Institute of Steel Construction, 2016) considers the behaviour of steel members at both ambient and elevated temperature, though the latter is described only in Appendix 4 (AISC American Institute of Steel Construction, 2016). In both the European and American specifications, the resistance of axially compressed steel members is reduced according to the slenderness of the element. The evolution of the design resistance with the slenderness is summarised into the form of buckling curves. These curves were based on experimental and numerical results for H- and I-profiles and later, were calibrated and extended to other profiles, such as L profiles. In detail, in EN 1993-1-2 flexural buckling is considered according to the model presented by Franssen et al. (1995), whereas the indications given in AISC 360-16 are based on the more recent buckling curve proposed by Takagi and Deierlein (2007). Only pure flexural buckling of compressed steel members in fire situation is analysed in both norms, whilst curves for flexural-torsional and torsional buckling are not explicitly integrated. Apparently, the prescribed buckling curves are deemed adequate also for the design of steel elements prone to flexural-torsional and torsional buckling at elevated temperature.
In the last decades, researchers investigated different instability phenomena in steel elements in fire situation, such as lateral-torsional buckling (Bailey et al., 1996; Vila Real and Franssen, 2000; Vila Real et al., 2004b) and its interaction with local instabilities (Vila Real et al., 2004a; Couto et al., 2014; Prachar et al., 2015; Couto et al., 2016; Couto et al., 2018; Franssen et al., 2016). Nevertheless, there is a lack of studies about the torsional and flexural-torsional buckling of angles and built-up steel members in compression at elevated temperature made of hot-rolled profiles, whereas such buckling phenomena have been studied for cold-formed steel profiles at both ambient and elevated temperatures (Schafer, 2008; Popovic et al., 2001; Ranawaka and Mahendran, 2010; Silvestre et al., 2013; Laím and Rodrigues, 2018; Craveiro et al., 2018; Arrais et al., 2021). Indeed, owing to the shape and the small thickness, an interaction of local, distortional and global buckling influences the resistance of L, T and X thin-walled members at ambient temperature, as demonstrated by Dinis et al. (2010). Further discussions about X sections were provided in Dabrowski (1988), Chen and Trahair (2006) and Trahair (2012).
In this context, the present paper treats the torsional and flexural-torsional buckling of compressed L, T and X steel profiles, obtained by coupling L sections or by cutting H or I hot-rolled profiles. Two dedicated buckling curves that better reproduce the results of a numerical investigation were proposed based on the EN 1993-1-2 and AISC 360-16 curves, respectively. A statistical investigation allowed for an additional discussion about the results of the proposed curves and the ones prescribed in the European and the American codes.
2. European and American norm provisions
The current approaches for the evaluation of the resistance of compressed steel members in fire recommended in the European and American standards are briefly presented in this section. In the Eurocodes, fire is treated separately and provisions for structural steel of EN-1993-1-1 (CEN (European Committee for Standardisation), 2005a) are modified and adapted to the fire situation in EN-1993-1-2 (CEN (European Committee for Standardisation), 2005b). The degradation of mechanical properties at elevated temperature is taken into account and equations for the definition of the design buckling resistance at time are furnished for compression members with a uniform temperature and with a class 1, class 2 or class 3 cross-section, i.e. cross-sections that are not sensitive to local buckling. Conversely, AISC 360-16 (AISC American Institute of Steel Construction, 2016) is a single and comprehensive document, confronting with different aspects of the design of steel structures. The recommendations for the structural design for fire conditions are integrated in this standard and are given in Appendix 4. In this norm, the coefficients for the reduction of the mechanical properties are slightly different from the ones prescribed in EN-1993-1-2, as shown in Figure 1 for the temperature range to which the analyses and considerations of this paper apply (400–800 C). The American standard specifies the approach for the evaluation of the nominal strength for compression of non-slender elements . The design strength is obtained reducing the value of , for instance, by multiplying by Φc = 0.9 for the load and resistance factor design (LRFD). in the European norm and Φc in the American norm represent essentially the same quantity. Later in this paper, the reader can find other quantities with the same meaning but different symbols in the two standards. For sake of simplicity, these quantities are summarised in Table 1.
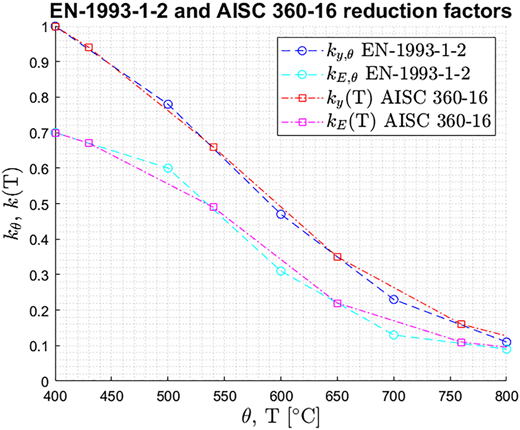
Reduction factors for the steel yield strength and elastic modulus at elevated temperature in EN-1993-1-2 and AISC 360-16
Reduction factors for the steel yield strength and elastic modulus at elevated temperature in EN-1993-1-2 and AISC 360-16
2.1 EN 1993-1-2 provisions
According to EN 1993-1-2, the resistance of steel members should be reduced to account for the effect of buckling at elevated temperature. For compressed elements with a uniform temperature and class 1, class 2 or class 3 cross-sections, the design buckling resistance is determined as follows:
where is the material safety factor for the fire design situation, is the area of the cross-section, is the reduction factor for the yield strength of steel at temperature and is the yield strength. Since , the design resistance equals the nominal buckling resistance and can be directly compared with the nominal strength for compression from AISC 360-16 norm. is the flexural buckling coefficient in the fire design situation and is obtained according to the following equation:
With
The generalised imperfection factor is defined as
the factor depends on the yield strength expressed in MPa
While the non-dimensional slenderness at the temperature is
is the reduction factor for the Young's modulus at steel temperature , is the non-dimensional slenderness at ambient temperature, as defined in EN 1993-1-1 (CEN (European Committee for Standardisation), 2005a).
is the lowest elastic critical load at ambient temperature. Hence, the slenderness is associated with the lowest relevant buckling mode that in some cases might be torsional or flexural-torsional.
It should be pointed out that EN 1993-1-2 may generate confusion by defining also as the smaller between the flexural buckling coefficients and . This implies the use of and in Eq. (6) obtained employing the pure flexural buckling loads or in Eq. (7). This statement is in contrast with the definition of in EN 1993-1-1 (CEN (European Committee for Standardisation), 2005a) since should be the lowest relevant buckling mode. Indeed, in some cases might be associated with torsional or flexural-torsional buckling, and thus, it does not always correspond to or . In this work, though in principle, the use of seems more correct, the highest between and was employed to present the results and to determine the buckling curves since it was shown (Popovic et al., 2001; Possidente et al., 2020a; Taras and Greiner, 2007) that improved predictions can be achieved with this adaptation. Hence, instead of Eq. (7), the following equation was used for .
An analogous argumentation has been extended to the AISC 360-16 buckling curves.
2.2 AISC 360-16 provisions
The Specification for Structural Steel Buildings AISC 360-16 reccomends to determine the nominal strength for compression as the product between the critical stress and the gross-sectional area of the member
The equation for the definition of the critical stress in fire situation is provided in Appendix 4 and is based on the work from Takagi and Deierlein (2007)
Where is a parameter that defines the shape of the buckling curve, is the yield stress at temperature T and is the critical elastic buckling stress, calculated through an elastic buckling analysis, or according to
With the elastic modulus at elevated temperature , the effective length and the radius of gyration. Eq. (10) was calibrated on numerical results for elements subjected to pure flexural buckling and no alternative equation is furnished in the standard to deal with torsional and flexural-torsional effects. As for the EN 1993-1-2, in this paper, the buckling curves from the American standard are presented and compared with the numerical results in respect to the slenderness for flexural buckling, i.e. by calculating as in Eq. (11) with the effective length and the radius of gyration calculated for flexural buckling on the weak axis.
For comparison purposes, the equations from the Specification for Structural Steel Buildings can be rewritten substituting some quantities with the equivalent counterpart of EN 1993-1-2 (Table 1). Eq. (10) can be rewritten observing that both and define the yield stress, that is the critical load , and considering Eqs. (6), (8).
With
Thus Eq. (9) can be rewritten as
Finally, an equivalent reduction factor to reduce the full nominal strength for compression at elevated temperature can be derived for the AISC 360-16 norm
from EN 1993-1-2 and as derived for AISC 360-16 can be directly compared with numerical results expressed in terms of failure load over yielding load .
3. Numerical simulation
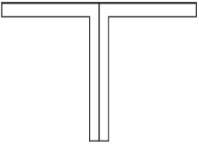
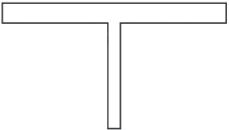
An extensive numerical campaign, consisting of more than 41,000 analyses was carried out to investigate the behaviour of concentrically compressed steel members subjected to fire that may be sensitive to torsional or flexural-torsional buckling. Geometrically and materially imperfect non-linear analyses (GMNIA) by means of finite element analysis (FEA) were performed, and results were collected in terms of resistance and later compared with the buckling curves predictions from EN-1993-1-2 and AISC 360-16. The set of investigated sections consisted of L, T or X cross-sections, defined by coupling L sections back-to-back, in case of T and X sections, or by cutting in two halves H or I hot-rolled steel profiles for additional T sections. In the case of coupled sections, it was assumed that the spacing of the connections was short enough to check the closely built-up members for buckling as single integral members (CEN (European Committee for Standardisation), 2005a). Meaningful predictions of the behaviour of coupled members were obtained with this assumption in several papers (Dinis et al., 2010; Dabrowski, 1988; Chen and Trahair, 2006; Trahair, 2012). Nevertheless, connecting plates or battens could be considered in more refined numerical models. The length, the temperature and the steel grade of the compressed members were varied in the analyses. Three steel grades were selected, namely S235, S275, S355. Members subjected to five different uniform temperatures were studied: 400, 500, 600, 700 and 800 C. Indeed, the temperature range 400–800 C is usually the most relevant temperature range, as proved for columns that buckle flexurally in Franssen et al. (1995) and confirmed by preliminary analyses for the cross-sections studied in this work. For each temperature about 8,200 columns were analysed with a length-to-width ratio higher than 3, in order to limit the analyses to columns of practical interest. Table 2 summarises the partial and the total number of the performed analyses. The analyses that showed convergence problems were discarded and were not considered in the count. A total of 45 different equal leg L profiles of commercial dimensions were studied. 68 T section and 45 X sections were made of 2 and 4 coupled L sections respectively. 129 T sections were obtained by dividing into two halves hot-rolled H- or I-sections. The different section types are summarised in Table 3. The set of the investigated columns was selected so that according to the classification of the sections in fire situation of EN 1993-1-2 and AISC 360-16, only class 1, class 2 or class 3 cross-sections, or non-slender-elements were investigated.
Performed analyses
| Section type | N. of sections | N. of analyses* |
|---|---|---|
| L sections (equal leg L) | 45 | 7,695 |
| T sections (2 equal leg L) | 45 | 7,397 |
| X sections (4 equal leg L) | 45 | 3,729 |
| T sections (2 unequal leg L) | 23 | 2,392 |
| T sections (half H or I) | 129 | 19,803 |
| Sum | 287 | 41,016 |
| Average number of analyses for each of the 5 temperatures | 8,203 | |
Note(s): *Numerical analyses with convergence problems were discarded. Only the considered analyses are reported here
Investigated sections
| Classification | ||||||
|---|---|---|---|---|---|---|
| All sections are Class 1-3 EN 1993-1-2 and nonslender-element sections AISC 360-16 | ||||||
| Section type | Dimensions of the angles composing the sections (Flange depth × web height × flange thickness × web thickness in mm) | |||||
L, T and X sections (1, 2or 4 equal leg L) | 45×45×7×7 | #+ | 150×150×20×20 | • #+ | ||
50×50×9×9 | • #+ | 150×150×18×18 | •# | |||
60×60×10×10 | • #+ | 160×160×17×17 | • | |||
65×65×11×11 | •# + | 180×180×19×19 | • | |||
65×65×10×10 | • #+ | 200×200×28×28 | • #+ | |||
70×70×9×9 | • #+ | 200×200×26×26 | •#+ | |||
90×90×16×16 | •#+ | 250×250×34×34 | • #+ | |||
100×100×16×16 | •#+ | 250×250×33×33 | • #+ | |||
100×100×15×15 | •#+ | 250×250×32×33 | •# + | |||
110×110×12×12 | • | 250×250×27×27 | • | |||
120×120×15×15 | •# | 300×300×33×33 | • | |||
120×120×13×13 | • | 300×300×32×32 | • | |||
140×140×16×16 | •# | |||||
T sections (2 unequal leg L) | 65×100×9×9 | • | 90×130×12×12 | • | ||
65×100×10×10 | •# | 90×130×14×14 | •#+ | |||
65×100×12×12 | •#+ | 90×140×12×12 | • | |||
70×110×10×10 | •# | 90×140×14×14 | •# | |||
70×110×12×12 | •#+ | 100×150×14×14 | •# | |||
80×120×12×12 | •# | 100×200×16×16 | • | |||
From half | From half | |||||
120×54,5×4,2×5,5 | HE 120 AA | •#+ | 248×135×18×32 | HE 240 M | •#+ | |
120×57×5×8 | HE 120A | •#+ | 280×140×10,5×18 | HE 280 B | •#+ | |
64×60×4,4×6,3 | IPE 120 | •# | 268×145×18×32,5 | HE 260 M | •#+ | |
120×60×6,5×11 | HE 120 B | •#+ | 300×150×11×19 | HE 300 B | •#+ | |
140×64×4,3×6 | HE 140 AA | •# | 288×155×18,5×33 | HE 280 M | •#+ | |
140×66,5×5,5×8,5 | HE 140A | •#+ | 300×160×11,5×20,5 | HE 320 B | •# | |
T sections (half H or I) | 126×70×12,5×21 | HE 120 M | •#+ | 310×170×21×39 | HE 300 M | •#+ |
140×70×7×12 | HE 140 B | •#+ | 300×170×12×21,5 | HE 340 B | •# | |
160×74×4,5×7 | HE 160 AA | • +# | 309×179,5×21×40 | HE 320 M | •#+ | |
160×76×6×9 | HE 160A | •#+ | 300×180×12,5×22,5 | HE 360 B | •# | |
146×80×13×22 | HE 140 M | •#+ | 309×188,5×21×40 | HE 340 M | •#+ | |
160×80×8×13 | HE 160B | •#+ | 308×197,5×21×40 | HE 360 M | •#+ | |
180×85,5×6×9,5 | HE 180 A | •# | 300×200×13,5×24 | HE 400 B | • +# | |
166×90×14×23 | HE 160M | •#+ | 307×216×21×40 | HE 400 M | •#+ | |
180×90×8,5×14 | HE 180 B | •#+ | 307×239×21×40 | HE 450 M | •#+ | |
200×95×6,5×10 | HE 200A | •# | 306×262×21×40 | HE 500 M | •#+ | |
186×100×14,5×24 | HE 180M | •#+ | 306×286×21×40 | HE 550 M | •# | |
200×100×9×15 | HE 200B | •#+ | 305×310×21×40 | HE600M | • v+ | |
220×105×7×11 | HE 220A | •# | 310×316×25,5×46 | HE600x337 | •#+ | |
206×110×15×25 | HE 200M | •#+ | 315×324×30×54 | HE600×399 | •#+ | |
220×110×9,5×16 | HE 220B | •#+ | 309×340×25×46 | HE650×343 | •# | |
240×115×7,5×12 | HE 240A | •# | 314×348×29,5×54 | HE650×407 | •#+ | |
226×120×15,5×26 | HE 220M | •#+ | 308×364×25×46 | HE700×352 | • +# | |
240×120×10×17 | HE 240B | •#+ | 313×372×29,5×54 | HE700×418 | •# | |
260×125×7,5×12,5 | HE 260A | • +# | 313×421×30×54 | HE800×444 | • +# | |
260×130×10×17,5 | HE 260 B | •#+ | ||||
Note(s):•S235; #S275; +S355 | ||||||
3.1 GMNIA analyses and finite elements
Each one of the GMNIA analyses, performed for a column with given cross-section, length, steel grade and temperature, consisted of a three-step procedure.
Step 1. A linear eigenvalue analysis was performed at ambient temperature to determine the shape of the lowest buckling mode.
Step 2. The buckling mode obtained from STEP 1 was scaled so that the maximum nodal displacement along the column equalled 1/1,000 of the length and was introduced as initial imperfection in the numerical model of the column.
Step 3. A numerical analysis of the imperfect member at the given temperature was performed to determine its resistance, by increasing the applied load.
The numerical analyses were performed with the 3D beam and shell thermomechanical finite elements presented in Possidente et al. (2019, 2020b). The elasto-plastic behaviour of steel was modelled based on the Von Mises yield function and on the uniaxial stress-strain relationship given in EN 1993-1-2. Residual stresses were neglected since it was found that their effect on the resistance of steel member in fire is not significant (Franssen et al., 1995; Vila Real et al., 2004a; Ranawaka and Mahendran, 2010; Quiel and Garlock, 2010; Couto et al., 2015). The Young's modulus value at ambient temperature was set to 210 GPa, and the Poisson ratio was equal to 0.3. Monosymmetric sections (L and T sections) were investigated by means of the 3D beam finite elements developed in Possidente et al. (2020b), whereas for the X sections the shell element proposed in Possidente et al. (2019) was employed. Indeed, shell elements were used as the introduction of imperfections associated to a pure torsional buckling would not be possible in beam elements-based analyses. However, beam elements were preferred for the monosymmetric cross-sections since they enable faster analyses and an easier definition of the boundary conditions, allowing for the investigation of simply supported columns with the rotational degree of freedom along the longitudinal axis blocked. Instead, columns with clamped end conditions were analysed when shell elements were used. The lateral displacements were blocked only at the centroids of the two clamped ends, to allow for thermal expansion. The axial displacement was fixed on one end and free conditions were imposed at the opposite end, which was loaded. The axial load was applied to the centroid and master-slave constraints allowed for a uniform axial displacement of all the other nodes of the loaded end. According to preliminary convergence analyses, 30 elements were sufficient for accurate solutions for beam models, while in the shell-based simulation it was necessary to vary the mesh with the length of the column. A minimum of six elements in each dimension of the section were always used.
The 3D beam and shell thermomechanical finite elements presented in Possidente et al. (2019, 2020b) were employed in the numerical analyses since they have been shown to provide accurate and reliable results and are well-suited for the purpose of the analyses. In particular, the 3D beam element was specifically conceived to properly consider torsion and warping in thin-walled elements with open cross-section at elevated temperature. In addition, the ability of these elements to capture flexural-torsional buckling was numerically validated in Possidente et al. (2020a), since no experimental tests were available in literature. The beam and shell elements gave comparable results for the buckling mode identification and the associated buckling load evaluation of members prone to flexural-torsional buckling. Excellent agreement was found in the analyses at elevated temperature with initial imperfections, determined by scaling the identified buckling modes. In addition, according to the procedure proposed in Jönsson and Stan (2017), it was also proved that the numerical framework can reproduce the flexural buckling curves at ambient temperature from the EN 1993-1-1 (CEN (European Committee for Standardisation), 2005a) by applying an equivalent lateral initial imperfection into the model of an IPE300 profile. The equivalent lateral initial imperfection was defined as , where is the kernel radius of the section for the relevant buckling direction. To show that the results of the employed numerical framework are in good agreement also with the numerical results on which the AISC 360-16 is based, a further validation test is proposed in this work. A comparison between the numerical outcomes of the 3D beam model and the ones presented by Takagi and Deierlein (2007) is illustrated in Figure 2 for a W14 × 90 profile, with a steel grade of 50 ksi (345 MPa) and a uniform temperature distribution of 500 C. The buckling curves from both the European and American standards are depicted in figure as a reference. The pure flexural buckling of the section was investigated for different values of slenderness. Buckling about the weak and the strong axis was ensured in the beam analyses by introducing lateral restraints along the member length in the direction perpendicular to the buckling one. Though in Takagi and Deierlein (2007), a shell model and consequently different boundary conditions were used to ensure weak or strong axis buckling, good agreement was found between the results from the numerical framework employed in the present work and from Takagi and Deierlein (2007).
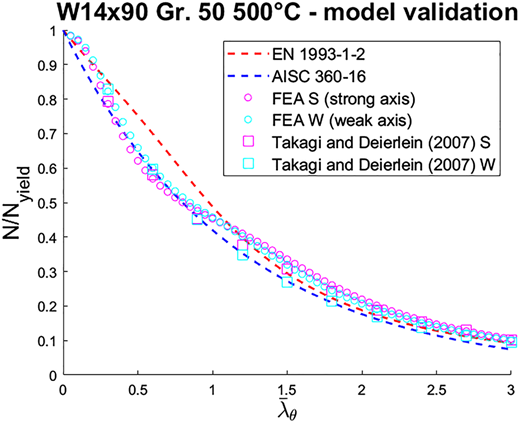
FEA vs buckling curves. W14 × 90 Gr. 50 (fy = 345 MPa) at 500 C with strong and weak axis imperfection l/1,000
FEA vs buckling curves. W14 × 90 Gr. 50 (fy = 345 MPa) at 500 C with strong and weak axis imperfection l/1,000
3.2 Considerations about the numerical results
The outcomes of the analyses are compared against the buckling curves from the European and American standards, i.e. the reduction factors of the full resistance to compression at elevated temperature (Eq. 2) and (Eq. 15), and how they vary with the non-dimensional slenderness. The reduction factors were compared with the numerical failure load over the yielding load at elevated temperature . The evolution of these quantities with the non-dimensional slenderness at elevated temperature from Eq. (6) is presented in Figures 3 and 4.
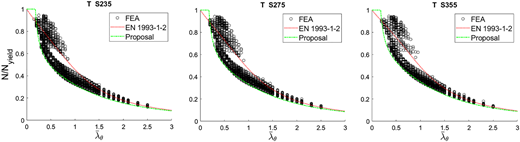
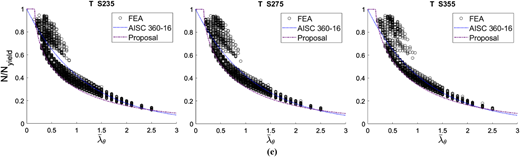
Buckling curves for T sections obtained from half H or I section (L, T and X made of coupled leg sections can be found in Possidente et al. (2020)). S235, S275 and S355 steel grade
Buckling curves for T sections obtained from half H or I section (L, T and X made of coupled leg sections can be found in Possidente et al. (2020)). S235, S275 and S355 steel grade
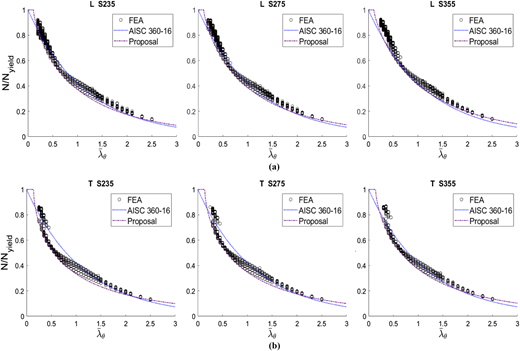
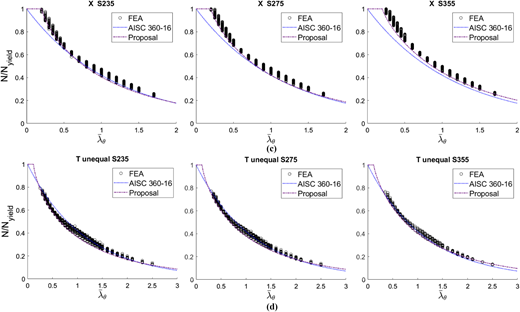
Buckling curves for S235, S275 and S355 steel grade. (a) L, (b) T and (c) X made of coupled equal leg L sections, (d) T obtained from unequal leg L sections and (e) T obtained from half H or I section
Buckling curves for S235, S275 and S355 steel grade. (a) L, (b) T and (c) X made of coupled equal leg L sections, (d) T obtained from unequal leg L sections and (e) T obtained from half H or I section
It should be observed that, though and are formally equivalent to and to compare the numerical results with the AISC 360-16 buckling curve, and should be adjusted according to the reduction factors and from the AISC 360-16 norm. However, despite the difference between and factors is very small (Figure 1), the adjustment would lead to inconsistencies since the reduction factors and from the EN-1993-1-2 were implemented in the numerical model. Thus, consistently with the work by Takagi and Deierlein (2007), on which the AISC 360-16 curve is based, the analyses and the variables are defined according to the EN 1993-1-2 reduction factors. Hence, it can be assumed
In Figure 3 the results are presented for the T sections consisting of half H or half I only since a comparison with the EN 1993-1-2 for the remaining sections was already proposed in Possidente et al. (2020a). Instead, the numerical results are shown for all the cross-sections in Figure 4, in which the outcomes of the analyses are compared with the AISC 360-16 curve. The buckling curves are expressed with respect to the pure flexural buckling slenderness, allowing for a better representation of the length of the member and improved predictions (Popovic et al., 2001; Possidente et al., 2020a; Taras and Greiner, 2007). From the figures, it can be observed that the design buckling curves from the European and American norms give inaccurate results and over- or underestimate the ratio in most of the cases, providing unsafe or too conservative predictions. Hence, a different formulation for buckling curves to improve the accuracy and safety of the predictions would be beneficial.
In almost all the analyses, the X sections buckled in their pure flexural form. Moreover, few very stocky columns attained failure loads higher than the yielding load . These results are removed and are not reported in Figure 4c as they would imply buckling reduction coefficients higher than 1. Failure loads exceeding the yield load in shell analyses were also found in several works about the fire behaviour of steel elements subjected to lateral-torsional buckling and of cold-formed steel beams with open cross-sections (Couto et al., 2016; Couto et al., 2018; Laím and Rodrigues, 2018).
For T sections consisting of half hot-rolled H or I profiles, numerical results are more spread compared with the ones of the other sections (Figures 3 and 4e). This is mainly because these sections have very different geometric dimension, especially when it comes to the depth-to-thickness ratio of the flanges and of the web. Moreover, in some cases, the strong axis of the section is directed along the web, but in the others, it has the same orientation of the flanges. This is not the case for T sections made of coupled L profiles. Indeed, coupling equal leg profiles the strong axis is always directed along the web. A further difference consists in the fact that for T sections consisting of coupled L profiles the web thickness is always two times the flange thickness, while for sections obtained from H- or I-profiles the web thickness is smaller than the flange thickness. For these sections, the actual buckling curves are both conservative and non-conservative. However, since it seems difficult to achieve very dense predictions in this case, buckling curves mainly on the safe side should be preferred.
4. New buckling curve proposals
Buckling curves that allow for a better representation of the results of numerical simulation were developed. The first proposal is based on the curves prescribed in EN 1993-1-2. Its formulation was already described in Possidente et al. (2020a) and is briefly summarised in the following paragraph. A second proposal was developed in this work starting from the equation provided in the AISC 360-16 norm. The predictions obtained with the proposals are compared with the ones from the original curves.
4.1 Modified EN 1993-1-2 buckling curve
To improve the buckling curve formulation from EN 1993-1-2, the generalised imperfection factor was modified. The generalised imperfection factors for the original and the modified curves are reported in Table 4.
Generalised imperfection factors
Note(s): EN 1993-1-2 and associated proposal for modification
The new generalised imperfection factor introduces a plateau up to slenderness , while the shape of the curve depends on and . The factor is defined according to Eq. (5) and thus, the parameters , and allow for the complete description of the buckling curve. Since a plateau was introduced, Eq. (2) should be replaced by
The values of , and were calibrated to propose curves on the safe side. The selected values are summarised in Table 5.
Selected values for the parameters of the proposed buckling curve
| L | T (2 equal leg L) | T (2 unequal leg L) | T (half H or I) | X (4 equal leg L) | |
|---|---|---|---|---|---|
| 1.00 | 1.25 | 1.10 | 1.50 | 0.85 | |
| 0.50 | 0.80 | 0.50 | 0.50 | 0.35 | |
| 0.15 | 0.22 | 0.20 | 0.18 | 0.20 |
The proposed buckling curves were compared with the numerical results and the EN 1993-1-2 buckling curve for T sections consisting of half hot-rolled H or I profiles in Figure 3. The results for the other section types can be found in Possidente et al. (2020a). Predictions from the proposal are safer and the introduction of a plateau together with the change of the shape of the curve , allow for a better representation of the numerical outcomes.
4.2 Modified AISC 360-16 buckling curve
Analogously to the previous proposal, another curve was developed modifying the parameters of the original AISC 360-16 curve. In this case, the modifications are applied to the imperfection factor . This factor is not explicitly described in the standard. For the modified curve, a more elaborate formulation was developed to introduce a plateau and to deal with the effects of different steel grades and temperatures. The imperfection factor for the AISC 360-16 curve and for the proposal are reported in Table 6.
Like the parameter in the EN 1993-1-2 norm, the parameter and account for the influence of different steel grades on the results and are defined as follows
Due to the introduction of a plateau, the following limits of validity are defined
Since has the same role as in the previous proposal, i.e. providing the slenderness limit below which the full resistance is not reduced by the effects of buckling, the same symbol was kept in this proposal. Again, three parameters describe the curve, namely , and . These values were calibrated to obtain curves on the safe side and are summarised in Table 7.
4.3 Imperfection factors analysis
In order to provide safe predictions, additional checks on the and factors were performed. For this purpose, the data relative to the envelope of the minimum values of the numerical results in Figure 3 and from Possidente et al. (2020a) and in Figure 4 were selected. Equivalent numerical factors and associated to these data were compared with and (Table 4), and and (Table 6), respectively.
The numerical generalised imperfection factor was obtained considering that both the EN 1993-1-2 curve and its modification are derived from the following equation based on the Ayrton-Penny formulation (Ayrton and Penny, 1886).
Substituting the reduction factor at elevated temperature in Eq. (20) with the data relative to the envelope of the minimum values of the numerical results , it holds
Similarly, the numerical imperfection factor for the AISC curve formulation was derived solving Eq. (12) for .
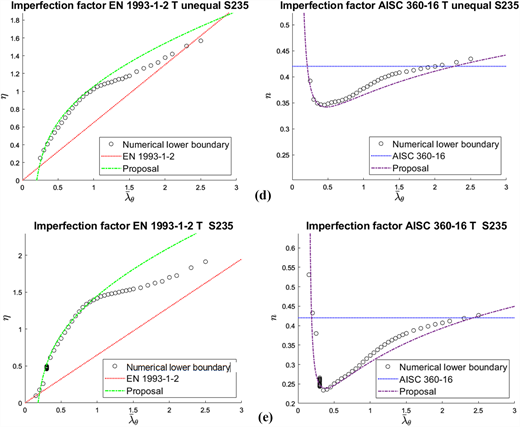
In Figure 5 the evolution as a function of the slenderness of the generalised imperfection factor and of the imperfection factor are compared for all the section types with a steel grade of 235 MPa, but similar figures are obtained for the other steel grades. Generalised factors higher than entail safe results for the design buckling curves. Conversely, when is higher than the buckling curves give unsafe results.
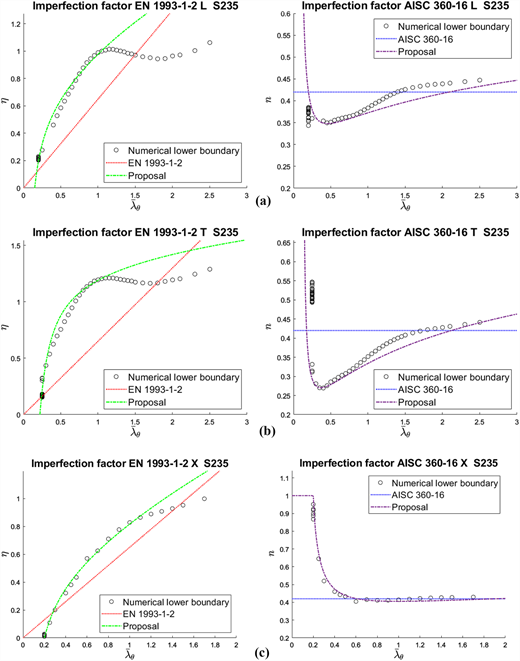
Imperfection factors: evolution with the slenderness at elevated temperature for steel S235: (a) L, (b) T and (c) X made of coupled equal leg L sections, (d) T obtained from unequal leg L sections and (e) T obtained from half H or I section
Imperfection factors: evolution with the slenderness at elevated temperature for steel S235: (a) L, (b) T and (c) X made of coupled equal leg L sections, (d) T obtained from unequal leg L sections and (e) T obtained from half H or I section
In Figure 5, the generalised imperfection factor is proportional to the slenderness and does not reproduce well the non-linear behaviour exhibited by . Instead, is in good agreement with for slenderness lower than 1. Better agreement could be found for higher slenderness by introducing further terms in the expression of , but this would introduce an unnecessary complexity in the model. In fact, the higher the slenderness, the lesser the difference between the generalised imperfection factor and affects the buckling coefficient . Analogously, since is a constant value, it is not accurate in reproducing the evolution of with the slenderness (Figure 5). Instead, the formulation proposed for allows for a satisfactory agreement with the envelope of the minimum numerical values and further terms to capture the non-linear behaviour of do not seem necessary. Also, in the case of X sections, in which is in good agreement with since the members mainly fail owing to pure flexural buckling, allows for a much better agreement for slenderness region < 0.5. The discussion reported here for the S235 steel grade are still valid for the S275 and S355 grades.
4.4 Statistical analysis
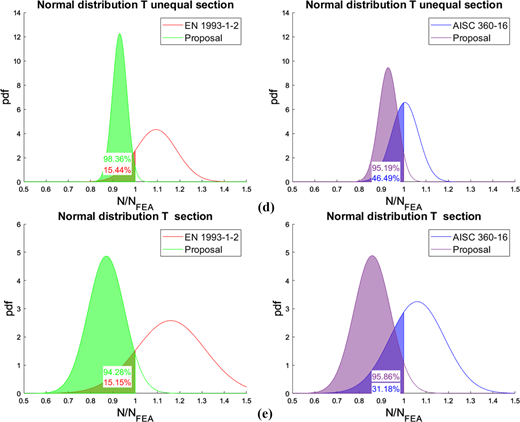
The degree of safety of the buckling curves was assessed by comparison with the results from numerical simulation. For each non-dimensional slenderness employed in the numerical analyses, the predictions from the buckling curves were divided by the numerical failure load The statistical investigation illustrated in Figure 6 was performed on the ratios assuming a normal distribution. The safe-unsafe limit was drawn at , with the areas below the distribution curves on the left of this limit indicating the regions of safe results. Figure 6 shows that lower standard deviations and higher frequencies were attained for both the proposals compared to the associated original curves, meaning that the numerical results are much better represented by the modified curves. Higher frequencies and mean values closer to 1 were found for the proposal derived from the EN 1993-1-2 curve. Such proposal has a probability of safe predictions higher than 96% for sections made of single or coupled L sections and higher than 94% for the T sections obtained from half H or I section. Instead, the modified AISC 360-16 buckling curve gives a probability of safe predictions higher than 95% for all the types of section. These probabilities of non-exceedance of the safe-unsafe limit are significantly higher compared to the ones from the original design curves.
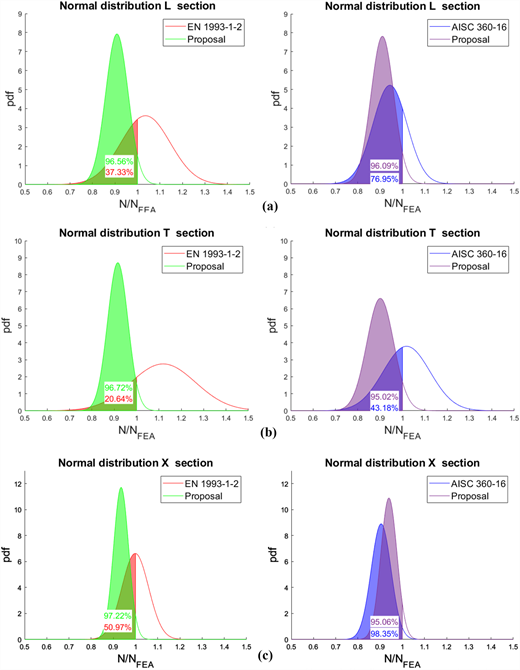
Statistical investigation. (a) L, (b) T and (c) X made of coupled equal leg L sections, (d) T obtained from unequal leg L sections and (e) T obtained from half H or I section
Statistical investigation. (a) L, (b) T and (c) X made of coupled equal leg L sections, (d) T obtained from unequal leg L sections and (e) T obtained from half H or I section
It should be observed that the AISC 360-16 design curve always provides better and safer results than the EN 1993-1-2 curve. This can be explained by the fact that Takagi and Deierlein (2007) developed the curve implemented in the AISC 360-16 standard based on numerical and experimental results, regardless from the existing formulations at ambient temperature. Conversely, the EN 1993-1-2 curve was derived fitting numerical and experimental results in the framework of the curve for ambient temperature from EN 1993-1-1 (CEN (European Committee for Standardisation), 2005a). Moreover, the curve by Takagi and Deierlein (2007) seems to be calibrated on the lowest numerical values of resistance collected in their analyses, whereas in EN 1993-1-2 parameters were calibrated so that only 50% of the numerical outcomes were higher than the buckling curve predictions. Hence, the AISC 360-16 buckling curve better captures the numerical outcomes and is safer for the flexural buckling situation, as clearly confirmed for X sections in Figure 6c. From this standpoint, it seems reasonable to expect better predictions from the AISC 360-16 curve also when flexural-torsional and torsional buckling are involved.
5. Conclusions
In this paper, fire buckling curves for the prediction of the resistance of compressed hot-rolled steel L profiles or closely spaced built-up members at elevated temperature were proposed. These curves consider the flexural and flexural-torsional behaviour in fire situation, which seems to be ignored in the current provisions of the European and the American standards, namely EN 1993-1-2 (CEN (European Committee for Standardisation), 2005b) and AISC 360-16 (AISC American Institute of Steel Construction, 2016). Moreover, though the profiles investigated in this work are widely used in the design practice, very few fundamental studies can be found in the literature. Indeed, the scientific community mainly focused on flexural and flexural-torsional behaviour of cold-formed steel members and rarely at elevated temperatures, while such a behaviour in the fire situation was not investigated for hot-rolled or welded profiles. To propose accurate and safe buckling curves, the behaviour of concentrically compressed L, T and X sections was investigated numerically in a parametric study consisting of more than 41,000 GMNIA analyses. Numerical analyses were performed on members with a uniform temperature distribution in the 400–800 C range, since this is usually the most relevant range for steel members in fire situation. Class 1 to class 3 members according to the classification of EN 1993-1-2 and non-slender elements according to AISC 360-16 were selected to study elements that are not sensitive to local buckling. It was found that flexural and flexural-torsional buckling affects the resistance of the investigated sections at elevated temperature, notably in the low slenderness range. The buckling curves were expressed with respect to the pure flexural buckling slenderness, allowing for a better representation of the length of the member and improved predictions. Compared with numerical outcomes, the actual provisions of the European and the American norms lead to both conservative and unconservative predictions. Two new buckling curves were proposed by modifying the formulation of the EN 1993-1-2 and the AISC 360-16 curves, respectively. The proposed factors depend on three parameters each, which were calibrated for each investigated cross-section shape. Both the proposals were proved to be safer and more accurate than the original curves. A statistical investigation was performed assuming a normal distribution, and probabilities of safe predictions higher than 94% for the modified EN 1993-1-2 curve, and higher of 95% for the modified AISC 360-16 curve were reached. For T sections made of half an H or I section, the proposals were less accurate, but still safer and more reliable than the original curves. In conclusion, it was demonstrated that buckling curves that better account for flexural-torsional and torsional buckling can be obtained with simple modifications of the buckling curves implemented in the current European and American norms.
The authors acknowledge funding from the Italian Ministry of Education, University and Research (MIUR) in the frame of the Departments of Excellence Initiative 2018-2022 attributed to DICAM of the University of Trento.

