Skip to article sections
Purpose

Queensland redesigned its small and medium-sized enterprise (SME) business grants after the pandemic; this paper aims to assess whether the fixed micro-grants (Basics), mid-tier systems grants (Boost) and capital-equipment grants (Growth Fund) align with owners’ risk profiles and lifecycle stages (QSBC, 2024). Despite gains in productivity, funding and leverage, succession readiness is neglected. The author proposes policy adjustments to extend the persona-aligned architecture and specify KPIs (Key Performance Indicators) to evaluate whether triage “worked”.

Design/methodology/approach

The author triangulates open administrative datasets for Queensland grants (2018–2024) to derive year-on-year volume, value and geographic metrics; overlay QSBC personas to test behavioural alignment; and benchmark against peer-reviewed evaluations and official guidelines (Xiang and Worthington, 2018; Srhoj et al., 2021; NSW Treasury, 2022; ACT Government, 2023; DESBT, 2024). Analysis is descriptive and includes case vignettes. In preparing this paper, the author used OpenAI’s ChatGPT as an assistive tool for background literature searching, summarising publicly available documents, preliminary data exploration and drafting initial outlines. The tool was also used to check grammar and consistency across different sections. All content generated by the AI was critically reviewed, verified against primary sources for accuracy and extensively edited by the authors. No confidential or sensitive data was input into the AI system, and no content was taken directly from the AI outputs without author oversight. The author confirms that they retain full responsibility for the integrity, analysis and interpretation of the data and for the final wording of the manuscript.

Findings

Grant counts plummeted after 2021 while average cheques and co-investment ratios rose, signalling a shift from triage to capital deepening. Uptake patterns mirror personas: vigilant operators cluster in Basics, competitors in Boost and entrepreneurs in Growth (QSBC, 2024; DESBT, 2024). Regional networker grants deliver low-cost peer learning outside South-East Queensland.

Research limitations/implications

Administrative data lack counterfactual revenue and long-run productivity measures, and behavioural alignment is inferred rather than tested experimentally. Future work should use matched quasi-experimental designs and randomised nudges to test uptake and track succession outcomes beyond two years (Srhoj et al., 2021).

Practical implications

The author outlines checklists. For managers: identify a 90-day capability gap; document handover assets (SOPs, CRM); invest in durable systems. For policymakers: add a succession readiness voucher to Boost; set tier-specific leverage floors; expand Regional Networker with outcome pay; create a one-front-door portal; and schedule post-grant diagnostics at 6 / 18/36 months

Social implications

Behaviourally tuned micro-grants can widen inclusion and efficiency, spreading capability beyond metropolitan cores. Enhancing succession readiness protects local jobs, preserves community-embedded firms and prevents wealth destruction during ownership transitions (QSBC, 2024).

Originality/value

To the best of the author’s knowledge, this is the first study to merge open grant data with a behavioural taxonomy of owner personas, showing how instrument design shapes who applies and which capabilities are built. It reframes post-pandemic grants in terms of leverage and succession readiness, offering a replicable template for federated systems (Xiang and Worthington, 2018; Srhoj et al., 2021).

Queensland’s small-business grant architecture has undergone a dramatic evolution since the pandemic triage of 2021. This viewpoint article examines that evolution through a social-impact lens, asking whether the current portfolio – anchored in fixed micro-grants (Business Basics), mid-tier systems grants (Business Boost) and capital-equipment grants (Business Growth Fund) – aligns with owner risk profiles and lifecycle stages to build capabilities that matter for continuity and succession.

Most social-impact research on small-business assistance focuses on macro-level outcomes, such as employment or regional growth, and pays less attention to behavioural alignment or succession readiness. We address this gap by fusing administrative open-data on grants with a behavioural taxonomy of owner personas, showing how cheque size, co-contribution rules and delivery channels act as choice architecture. Our behavioural-fusion approach extends dynamic-capabilities theory to micro-grant design (Teece et al., 1997), explaining how grants can deliberately build sensing, seizing and reconfiguring routines.

Research questions. We address three post-pandemic questions:

RQ1.

How should Queensland’s tiered grants be redesigned to build capabilities that matter for succession readiness?

RQ2.

Which behavioural design choices (e.g. ballot vs “first-come”, reporting burden, framing) improve alignment with owner mindsets while protecting equity and probity?

RQ3.

What KPI set would credibly indicate that triage objectives have been met so policy can pivot toward productivity (NSW Treasury, 2022; PM&C/BETA, 2018)?

The QSBC survey profiles six personas – competitor, traditionalist, soloist, entrepreneur, risk-taker and vigilant operator – each with distinct appetites for risk, growth and administration (QSBC, 2024). We aggregate these into two behavioural clusters. Stability-oriented owners (traditionalists and soloists) value predictability, avoid debt and prefer incremental change. Growth-oriented owners (competitors, entrepreneurs and risk-takers) are willing to invest for scale and experiment with new technology. Vigilant operators straddle both, focusing on compliance and continuity.

When these personas are mapped onto Queensland’s grant tiers, clear patterns emerge. Basics grants, which are fixed at A$5 000 and paid upfront with no Co.-contribution (DESBT, 2024), attract stability-oriented owners seeking low-risk capability boosts such as digital adoption or basic training. Boost grants (A$10k–20k with an equal co-contribution, paid on acquittal) appeal to owners ready to embed systems and automation (DESBT, 2023). Growth-Fund grants (typically A$50–75k with a ≥ 40% match) attract entrepreneurs investing in specialised equipment (Business Queensland, 2025). The Regional Networker micro-grant (A$2 000 for peer-learning events) is popular among traditionalists who prefer networks and trusted advisers to formal training (DESBT, 2024). This behavioural alignment reduces adverse selection and ensures that public funds support firms capable of translating grants into lasting capability. Table A5 (see  Appendix) shows how the QSBC “Lifecycle and Mindset” study deepens our reading of the 2020 24 grant data.

We triangulate three evidence streams. First, we clean and aggregate DESBT/DYJESBT open-data files covering 6 700 Queensland grant awards (2018–2024) to derive year-on-year metrics for volume, value and geographic dispersion. These data sets were selected because they are comprehensive, public and contain recipient postcodes and grant amounts, unlike other administrative sources that suppress location fields (DESBT, 2022; DESBT, 2024).

Secondly, we overlay owner personas and lifecycle stages from the 2024 Lifecycle and Mindset survey conducted by the Queensland Small Business Commissioner (QSBC, 2024). This behavioural taxonomy includes six archetypes – competitor, traditionalist, soloist, entrepreneur, risk-taker and vigilant operator. For exposition, we transparently aggregate them into “stability-oriented” and “growth-oriented” clusters, while acknowledging that real owners may exhibit hybrid traits.

Thirdly, we benchmark our descriptive findings against peer-reviewed Australian program evaluations and official guidelines to test leverage, probity and outcomes (Srhoj et al., 2021; NSW Treasury, 2022; DESBT, 2023). Given the viewpoint format, our analysis is descriptive; causal claims are avoided.

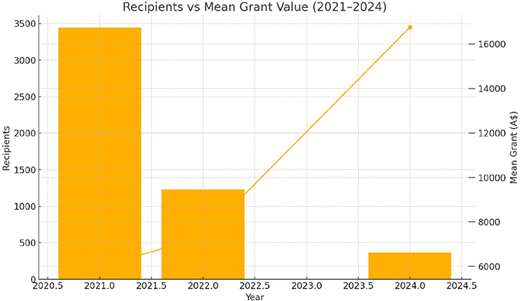
Table A1 and Figure 1 (see  Appendix) show that award volume dropped from over 3,400 Basics grants in 2021 to 365 in 2024, while average cheque size rose from A$5 000 to over A$70 000 (DESBT, 2022; DESBT, 2024). Interpretation: the State has shifted from “cheques to everyone” towards targeted capital deepening, consistent with dynamic-capabilities theory.

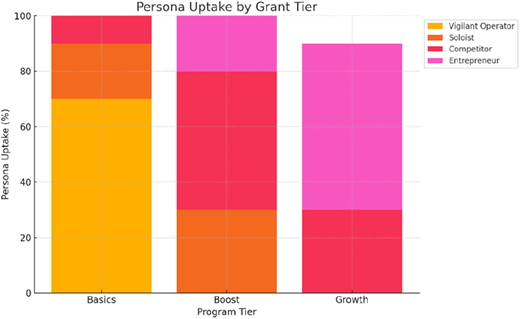
Table A2 and Figure 2 (see  Appendix) show that vigilant operators (37% of SMEs) accounted for 52% of Basics grants. Conversely, entrepreneurs (15% of SMEs) captured nearly half of the Growth Fund awards (QSBC, 2024). Interpretation: persona-aligned design appears to reduce adverse selection.

Brisbane LGA alone accounts for 34% of the dollars; combined SEQ LGAs capture 73% (DESBT, 2024). By contrast, 60% of Regional Networker grants go to Cairns, Bundaberg, Toowoomba and Rockhampton. Interpretation: event-based microgrants are a cost-effective way to disseminate know-how outside SEQ (QSBC, 2024).

Website upgrades represented 45% of spend in 2021, but only 12% in 2024; automation and manufacturing equipment now account for 38% (DESBT, 2024). Interpretation: micro-grants have evolved from “getting online” to “lifting throughput.”

Growth-Fund projects leverage at least A$1.6 in private capital for each public dollar (Business Queensland, 2025). Accountant letters and staged payments keep fraud low. Ballots for Basics reduce speed-of-click bias (NSW Treasury, 2022). Interpretation: transparent co-funding and randomisation support both equity and probity.

Basics requires minimal paperwork; Boost needs an accountant’s letter; Growth demands an expression of interest (EOI), a full application and a pitch (DESBT, 2023). Tables 3 and 4 (see  Appendix) headline differences pre vs post COVID. Interpretation: aligning administrative burden with cheque size balances accessibility and accountability, but may deter stability-oriented owners from moving up.

Only 1.8% of projects mention succession or SOPs, despite 39% of owners planning to exit within 10 years (QSBC, 2024). Interpretation: without targeted support, a forthcoming wave of retirements could erode jobs and community capital.

Murri’s on the Move (Sunshine Coast). A driver-training social enterprise used a Workforce Connect Fund grant to hire two instructors. It increased revenue by 45% and licensed 60 Indigenous students within 18 months. Upfront payment and tailored mentorship were critical (DESBT, 2024).

Great Coffee Moments (Port Fairy, Victoria). A A$5 000 micro-grant under the Victorian Digital Adaptation Program funded an online ordering system and digital marketing. Online sales rose to 18% of turnover, and admin hours dropped by eight per week (Victorian Government, 2022).

Ceres Tag (Queensland). A 2020 Accelerating Commercialisation grant leveraged A$3.5m in venture capital and enabled export of a livestock-monitoring tag to 14 countries. A 50% co-contribution signalled credibility to investors (DISR, 2021).

Sun Med (Sunshine Coast). During the pandemic, Sun Med secured a Small Business COVID-19 Activation Grant (≈A$9,700) for marketing, videos and business coaching. The straightforward process provided relief and allowed the firm to better target customers, increase sales and expand its team (DESBT, 2024).

Purpose restated and answers to RQs. This paper examined Queensland’s post-pandemic small-business grants through a behavioural lens:

RQ1.

Tiered grants should map to capability pathways – Basics for resilience, Boost for systems and people, Growth for equipment – while introducing a succession-readiness voucher to address a glaring gap.

RQ2.

Behavioural design choices such as ballots, simplified reporting, persona-aligned messaging and staged payments improve equity and alignment without compromising probity (PM&C/BETA, 2018; NSW Treasury, 2022).

RQ3.

A KPI suite – survival retention, FTE change, time-to-recovery, durable digital adoption and low irregularity rates – would credibly signal the end of triage and the shift to productivity.

By fusing administrative data with owner personas, we extend behavioural public policy into grant design and demonstrate how micro-level choice architecture builds dynamic capabilities (Teece et al., 1997). Grants are not neutral transactions; their design nudges owners to invest in sensing, seizing and reconfiguring routines that underpin social impact.

For managers: Conduct a 90-min diagnostic (cash buffer, processes, owner dependency); prioritise one measurable capability gap; document SOPs and governance; invest grant funds in systems and automation that outlast the grant; plan your co-contribution before applying.

For policymakers: Adopt a one-front-door application; add a Succession Readiness Voucher (A$3–5 k) within Boost for diagnostics and governance capture; use ballots for high-demand micro-grants; publish a KPI dashboard and run quick-turn evaluations; maintain persona-aligned co-contributions to preserve self-selection (DESBT, 2023; Business Queensland, 2025).

Limitations and future research. Our analysis is descriptive and Queensland-specific. Administrative data lack counterfactual revenue or profit measures and long-run productivity metrics; behavioural alignment is inferred, not tested experimentally. Future research should employ synthetic control or difference-in-differences designs, embed randomised nudges (e.g. messaging frames) and track outcomes (ownership changes, staff retention, customer churn) over at least three years (Srhoj et al., 2021).
Business Queensland
(
2025
), “
Business growth fund
”,
Brisbane
:
Queensland Government
.,
available at:
Business growth fundLink to the cited article. (
accessed
26 August 2025).
Deakin University
(
2024
),
Efficacy of Australian Commonwealth Business Grants: White Paper
,
Deakin University/IPA-Deakin SME Research Centre
,
Melbourne
.
DESBT
(
2022
),
Business Basics – Round 3 Open Data
,
Department of Employment, Small Business and Training
,
Brisbane
.
DESBT
(
2023
),
Business Boost Grants Program – Round 3 Guidelines
,
Department of Employment, Small Business and Training
,
Brisbane
.
DESBT
(
2024
),
Business Basics – Round 5 Guidelines
,
Department of Employment, Small Business and Training
,
Brisbane
.
DISR
(
2021
),
Accelerating Commercialisation – Case Studies
,
Department of Industry, Science and Resources
,
Canberra
.
NSW Treasury
(
2022
),
Economic and Outcomes Evaluation of the 2020 NSW Government COVID-19 Small Business Grants
,
NSW Treasury
,
Sydney
.
PM&C/BETA
(
2018
),
Behavioural Insights for Public Policy: Guide and Case Compendium
,
Department of the Prime Minister and Cabinet, Behavioural Economics Team of the Australian Government
,
Canberra
.
QSBC
(
2024
),
Understanding the Lifecycle and Mindset of Queensland Small Businesses
,
Queensland Small Business Commissioner
,
Brisbane
.
Srhoj
,
S.
,
Lapinski
,
M.
and
Walde
,
J.
(
2021
), “
Impact evaluation of business development grants on SME performance
”,
Small Business Economics
, Vol.
57
No.
3
, pp.
1285
-
1301
.
Teece
,
D.J.
,
Pisano
,
G.
and
Shuen
,
A.
(
1997
), “
Dynamic capabilities and strategic management
”,
Strategic Management Journal
, Vol.
18
No.
7
, pp.
509
-
533
.
Victorian Government
(
2022
), “Supporting small businesses to tap into Tech”,
State of Victoria
,
Media Release, Melbourne
.
ABS
(
2023
),
Counts of Australian Businesses, Including Entries and Exits
,
Australian Bureau of Statistics
,
Canberra
.
ACT Government
(
2023
),
Evaluation of the Business Support Grant and Small-Business Hardship Scheme
,
Chief Minister, Treasury and Economic Development Directorate
,
Canberra
.
Moore
,
C.
(
2024
), “
Regulating the rorts: the legal governance of grants programs in Australia
”,
Federal Law Review
, Vol.
52
, pp.
1
-
26
.
QGSO
(
2024
),
Queensland Business Characteristics
,
Queensland Government Statistician’s Office
,
Brisbane
.
Xiang
,
D.
, and
Worthington
,
A.
(
2018
),
Government Financial Assistance and SME Performance: Evidence from Australia
,
Griffith University Working Paper
.
Published by Emerald Publishing Limited. This article is published under the Creative Commons Attribution (CC BY 4.0) licence. Anyone may reproduce, distribute, translate and create derivative works of this article (for both commercial and non-commercial purposes), subject to full attribution to the original publication and authors. The full terms of this licence maybe seen at Link to the terms of the CC BY 4.0 licenceLink to the terms of the CC BY 4.0 licence.

Data & Figures

Figure 1.
A combined bar and line chart shows recipients decreasing from 2021 to 2024 while mean grant value increases over the same period.The chart presents recipients and mean grant value across years 2021, 2022, 2023, and 2024. The left vertical axis represents recipients. The right vertical axis represents mean grant value in Australian dollars. The recipients are about 3450 in 2021, about 1230 in 2022, and about 350 in 2024. The mean grant value is about 7000 Australian dollars in 2021, about 9000 Australian dollars in 2022, and about 16500 Australian dollars in 2024. The number of recipients decreases across the years while the mean grant value increases.

Recipients and mean grant value, 2021–2024

Source: Created by author

Close Figure 1.
Figure 2.
A stacked bar chart shows persona uptake across Basics, Boost, and Growth tiers with varying shares of vigilant operator, soloist, competitor, and entrepreneur.The chart presents persona uptake in percentage across programme tiers labelled Basics, Boost, and Growth. The categories are vigilant operator, soloist, competitor, and entrepreneur. In Basics, vigilant operator is 70 percent, soloist is 20 percent, competitor is 10 percent, and entrepreneur is 0 percent. In Boost, vigilant operator is 0 percent, soloist is 30 percent, competitor is 50 percent, and entrepreneur is 20 percent. In Growth, vigilant operator is 0 percent, soloist is 0 percent, competitor is 30 percent, and entrepreneur is 60 percent. The distribution varies across tiers.

Grant-tier uptake by QSBC persona (Illustrative)

Source: Created by author

Close Figure 2.

Table A1. Year-on-year program metrics (2021–2024)

YearRecipientsPublic funding (a$)Mean grant (a$)
20213,44220,506,1145,958
20221,2309,044,3577,353
20243656,116,95516,759
Source(s):

Created by author

Table A2. Grant architecture and behavioural alignment

Program tierCheque sizePrimary objectiveDominant persona(s)
Business basicsA 5,000-fixedStability and digital readinessVigilant operator, soloist
Business boost≤ A$25 000 (30% co-contrib)Systems productivity and automationCompetitor
Business growth fund≤ A$75 000 (≥50% co-contrib)Cap-ex scale-up and jobsEntrepreneur
Regional networkerA 2,000-fixedPeer networking outside SEQVigilant operator (regional)
Source(s):

Created by author

Table A3.

Queensland Small-business grants – pre-COVID (2018–2020) vs post-COVID (2021–2024)

PeriodMain programs activeTotal recipients*Total public $$ (a$)Mean grant (a$)Program mix and strategic intent
2018-2020 (pre-COVID)• Business Growth Fund (tranches 1-6)• Social Enterprise Grants (2020 pilot)• Artisan micro-grants1403.54 m≈ 25 kCapital equipment for scale-up (growth fund); small targeted pilots for social-impact and creative industries
2021-2024 (post-COVID)• Business Basics (Rnds 1-5)• Business Boost (Rnds 1-3)• Business Growth Fund (Rnds 3-5)• Regional Networker micro-grants4,80629.9 m≈ 6.2 kMass digital-capability and resilience grants (basics/boost) layered with larger scale-up capital (growth fund) and low-cost regional networking support
Source(s):

Created by author

Table A4.

Five headline differences pre- vs post-COVID

#Change observed
1. Orders-of-magnitude growth in reachRecipients jumped from 140 to 4 806 – a 34-fold increase – driven by the creation of the fixed-value Business Basics micro-grants (2 030 awards in Round 1 alone). The government pivoted from selective capital funding to rapid, broad-base assistance when lockdowns disrupted trading
2. Average cheque size collapsedThe mean grant fell from ∼A$ 25k to ∼A$ 6k because > 80% of post-COVID awards are the $5 000 Basics grants. The policy lever shifted to “small amounts, many firms” for immediate digital and continuity upgrades
3.Yet large-ticket capital support is getting biggerWhile the number of Growth Fund awards dipped (42 → 31 between 2022 and 2024), the mean grant increased by 53% (≈ A$46 k → A$71 k). The State is backing fewer but bolder expansion projects as the economy moves from recovery to growth
4. New program architecture introducedPost-COVID portfolio now has three-tiered layers: • Basics – foundational digital and continuity skills (fixed $5 k) • Boost – systems automation and resilience (≈$15 k, 30% co-contribution) • Growth Fund – cap-ex and job creation (≤$75 k, ≥ 50% co-contribution) plus regional micro-grants to seed networking outside SEQ
5.Funding emphasis pivots from web-presence to productivity techGeneral equipment upgrades dominated Pre-COVID Growth-Fund projects; COVID-era Basics Rnd 1 spent 45% on website-commerce builds; by 2024, the top funded priority across all programs is specialised manufacturing/automation equipment, signalling a move from survival to competitiveness
Source(s):

Created by author

Table A5.

How the QSBC “lifecycle and mindset” study deepens our reading of the 2020–2024 grant data

Grant-program trend (from the datasets)Fresh context from the QSBC reportWhy the Two align/diverge
1. Explosion of very small, fixed-value grants in 2021-22 (Business Basics Rds 1-3)Most Queensland owners “preference stability over growth” and look for low-risk capability boosts rather than big leapsBasics grants ( A$ 5k) match this psychology: micro-spends that shore up operations (websites, digital tools) without forcing major risk
2. Sharp contraction of Basics after 2022 (-79% recipients) and return to a higher-value, cap-ex Growth-Fund projects in 2024Once a platform of stability is achieved, firms oscillate between growth spurts and stabilisation rather than climbing a linear staircaseThe government pulled back broad “triage” grants as pandemic turbulence eased; firms that regained stability were ready for the subsequent growth oscillation–hence bigger, fewer growth-fund cheques
3. Average Growth-Fund cheque up 53% (2022–2024)A small subset of owners fit the entrepreneur or risk-taker personas–prepared to take calculated risks when the opportunity emergesPrograms channel more to these high-impact cohorts, consistent with the report’s view that only some mindsets will chase scale once stability is banked
4. Metro skew intensifies in high-value rounds; new 2 k “Regional Networker” micro-grants appeared in 2024Regional owners interact with government and external advisers more than metro peers and rely on networks for capability gapsTiny event-based grants are a policy response to that behavioural insight – cheaper for the government but leveraging the networking impulse noted in the study
5. Firms in the initiation stage draw heavily on analytics/external advice; uptake plunges at the exit stage (report)New and very young firms swamped basics rounds; exit-oriented owners were under-represented in all programsIt helps explain why basics demand collapsed once the early-stage pipeline was reduced and why exit-stage owners are less visible in grant rosters
6. Low appetite for risk and only “mild” proactiveness overallBoost round caps at ∼A$ 15k with 30% co-contribution–small enough to feel safe yet nudging owners toward systems upgradesThe design mirrors the median mindset: owners will modernise if the downside is limited, and the upside is framed as stability/productivity rather than aggressive expansion
Source(s):

Created by author

Supplements

References

Business Queensland
(
2025
), “
Business growth fund
”,
Brisbane
:
Queensland Government
.,
available at:
Business growth fundLink to the cited article. (
accessed
26 August 2025).
Deakin University
(
2024
),
Efficacy of Australian Commonwealth Business Grants: White Paper
,
Deakin University/IPA-Deakin SME Research Centre
,
Melbourne
.
DESBT
(
2022
),
Business Basics – Round 3 Open Data
,
Department of Employment, Small Business and Training
,
Brisbane
.
DESBT
(
2023
),
Business Boost Grants Program – Round 3 Guidelines
,
Department of Employment, Small Business and Training
,
Brisbane
.
DESBT
(
2024
),
Business Basics – Round 5 Guidelines
,
Department of Employment, Small Business and Training
,
Brisbane
.
DISR
(
2021
),
Accelerating Commercialisation – Case Studies
,
Department of Industry, Science and Resources
,
Canberra
.
NSW Treasury
(
2022
),
Economic and Outcomes Evaluation of the 2020 NSW Government COVID-19 Small Business Grants
,
NSW Treasury
,
Sydney
.
PM&C/BETA
(
2018
),
Behavioural Insights for Public Policy: Guide and Case Compendium
,
Department of the Prime Minister and Cabinet, Behavioural Economics Team of the Australian Government
,
Canberra
.
QSBC
(
2024
),
Understanding the Lifecycle and Mindset of Queensland Small Businesses
,
Queensland Small Business Commissioner
,
Brisbane
.
Srhoj
,
S.
,
Lapinski
,
M.
and
Walde
,
J.
(
2021
), “
Impact evaluation of business development grants on SME performance
”,
Small Business Economics
, Vol.
57
No.
3
, pp.
1285
-
1301
.
Teece
,
D.J.
,
Pisano
,
G.
and
Shuen
,
A.
(
1997
), “
Dynamic capabilities and strategic management
”,
Strategic Management Journal
, Vol.
18
No.
7
, pp.
509
-
533
.
Victorian Government
(
2022
), “Supporting small businesses to tap into Tech”,
State of Victoria
,
Media Release, Melbourne
.
ABS
(
2023
),
Counts of Australian Businesses, Including Entries and Exits
,
Australian Bureau of Statistics
,
Canberra
.
ACT Government
(
2023
),
Evaluation of the Business Support Grant and Small-Business Hardship Scheme
,
Chief Minister, Treasury and Economic Development Directorate
,
Canberra
.
Moore
,
C.
(
2024
), “
Regulating the rorts: the legal governance of grants programs in Australia
”,
Federal Law Review
, Vol.
52
, pp.
1
-
26
.
QGSO
(
2024
),
Queensland Business Characteristics
,
Queensland Government Statistician’s Office
,
Brisbane
.
Xiang
,
D.
, and
Worthington
,
A.
(
2018
),
Government Financial Assistance and SME Performance: Evidence from Australia
,
Griffith University Working Paper
.

Languages

or Create an Account

Close subscription notice
Close access options
