The failure mechanism of a gravity dam under blast loading is much more complex than failure under other dynamic loads such as earthquakes. It is therefore important to evaluate the safety performance of these structures under blast load. The structural dynamic behaviour of Koyna dam, India, subjected to underwater explosion (UndEx) was investigated. The Johnson–Holmquist 2 model was used to capture the non-linear response of concrete. The dam–reservoir interaction was modelled using the coupled acoustic–structural technique, which employs a total wave formulation to incorporate the propagation of spherical shock waves. Dynamic responses such as displacement, damage profiles and principal stresses under various detonation depths, weights and reservoir levels were examined. The findings indicated that areas facing the explosion experience the most damage, while local damage occurred at the dam’s heel as the explosion depth increased. Additionally, displacement decreased notably as the TNT depth increased for a consistent explosive amount. The damage distribution in the dam was found to depend on both TNT depth and weight. Damage accumulation in the dam was substantially reduced by lowering the reservoir height (five different levels were assessed). The results provide valuable insights into the Koyna gravity dam’s response to UndEx under varying conditions.
Notation
- A, B, C, M, N
material parameters
- D
damage variable
- D1, D2
damage variables
fluid density
- d
structure’s density
- K1, K2, K3
material constants
field variables
normal to structural surface, towards inside the fluid
normalised pressure
pressure at Hugoniot elastic limit (Hel)
peak pressure of wave at specific target point
- p
excess pressure in fluid
applied pressure on wet surface of structure
cavitation limit of fluid
static pressure
pseudo pressure
- R
standoff distance
bulk modulus of fluid
normalised maximum tensile hydrostatic pressure
- Tmax
maximum tensile pressure
- t
drag force of structure
- tsw
time taken for shock wave to reach target point
displacement, velocity and acceleration of structure at one point
velocity of fluid particle
acceleration of fluid particle
- W
weight of TNT (kg)
- x
spatial position of fluid particle
volumetric drag
- ,
constants
damping factor
plastic strain
increase in pressure due to damage
virtual displacement with respect to virtual strain
variational displacement field
actual rate of strain
dimensionless strain
fractured plastic strain
exponential decay time constant
- ρ
current density
- ρo
initial density
structure’s nodal stress
normalised fracture stress
damaged strength material parameter
normalised equivalent stress
undamaged strength material parameter
1. Introduction
In recent decades there has been a notable surge in catastrophic events causing significant damage or destruction to important civil infrastructures due to terrorist attacks, military conflicts and bomb explosions. Critical structures such as dams, railways and liquid storage tanks face heightened risks from dynamic loads like earthquakes and blast impacts. Recent studies on failure analysis due to blast loads on structures like buildings (Ghalehnoei, 2021) and dams (Moradloo et al., 2019; Tarinejad et al., 2024; Zhu et al., 2022) suggest the need for more detailed research in this area. Technological advancements have led to a substantial increase in the accuracy of the analysis of structural destruction under blast loads.
Dams, with their complex configurations, present particularly critical challenges in the event of blast events. Terrorist activities involving blasts can inflict severe damage on dams, reservoirs and their foundations (DHS, 2012). Dams are generally built for hydropower generation, water supply for irrigation, flood control, tourism and many other social benefits, so the safety of these infrastructures against impact loads is critically important (Wang et al., 2015). Populations in downstream areas are likely to suffer the most from dam failure. However, the resilience of most dams against blast loads was not accounted for in their design (only traditional loads like hydrostatic forces, hydrodynamic loads, uplift pressure, earthquake loads and so on were considered). Such loading conditions must be considered so that sufficient measures can be taken to mitigate the risks to these lifeline structures. The phenomenon of blast loading is much more complex earthquakes or other static loads. Therefore, it is important to assess dam performance against blast loading (Wang and Zhang, 2014; Shu et al., 2022).
In blast loading, a structure such as a dam may experience an air blast or underwater explosion (UndEx), with damage being more severe in the event of UndEx (Wang et al., 2015). Much experimental work has been performed to understand the behaviour of dams under shock loads (Huang et al., 2022; Falconer, 2007; Lu et al., 2014; Vanadit-Ellis and Davis, 2010; Zhu et al., 2022). With advances in computer technology, numerical simulations such as the Lagrangian and Eulerian approach (Hamdan, 1999), the coupled Eulerian–Lagrangian method (Arienti et al., 2003), the arbitrary Lagrangian–Eulerian method (Hirt et al., 1974) and smooth particle hydrodynamics (Yang et al., 2018) has gained attention. In numerical simulations of structures experiencing UndEx, three common modelling strategies are employed. The most rigorous involves simulating the entire UndEx event considering the interaction of the TNT-generated shock wave and the target structure. This computationally intensive approach is used in hydrocodes like MSC.Dytran (Li and Rong, 2012), LS-Dyna (Ge et al., 2017) and Autodyn (De et al., 2017). Alternatively, a simplified strategy, such as the doubly asymptotic approximation, uses a boundary technique to enhance fluid modelling; this offers computational efficiency but does not include some critical phenomena like cavitation (Li et al., 2020). The third strategy is coupled acoustic–structural (CAS) analysis (Aman et al., 2011; Clarkson, 1981; Zhang et al., 2021a), available in Abaqus (DS, 2014). CAS analysis balances computational efficiency and accuracy by coupling acoustic and structural analyses, with a focus on accurately representing the influence of water on the structural response.
The CAS technique is a powerful and effective tool for studying the performance of structural members subjected to UndEx. It provides a simple was of executing a blast load on a structure without considering the detailed physics of the detonator and propagation of shock wave. In this analysis, the target source and standoff point are specified by defining two reference points, to identify the point for the pulse load. A pulse load is applied using a specific code (Kwon and Fox, 1993) or using the empirical relationship given by (Cole, 1948). Over the years, the CAS technique has been applied to infrastructure such as reinforced concrete columns (Zhang et al., 2021a, 2021b), submerged structures (Jen, 2009; Ullestad and Liu, 2024), tunnels (Kasilingam et al., 2022), liquid storage tanks (Huang et al., 2023) and dams (Wang et al., 2023,; Zhang et al., 2022, 2023). Using a three-dimensional (3D) numerical model, the pattern of damage of an arch dam under blast loading with different TNT positions was investigated by Moradloo et al. (2019). They reported that tensile stresses were the main reason for dam failure and that displacement of the upstream face of the dam increased as the depth of the TNT charge from the top surface was increased. Zhu et al. (2022) compared a semi-coupled method and a fully coupled method to analyse a gravity dam subjected to UndEx to check the effectiveness of the methods in different cases. They concluded that the fully coupled method was more suitable in the case of near-field explosions. In the case of a small quantity of TNT, the semi-coupled method was more appropriate as the effect of detonator size on the acoustic elements is reduced. Zhang et al. (2022) identified two major loading factors while performing the CAS method: the depth of the reservoir water and the rise time in the UndEx event. They concluded that a suitable water depth should be considered in analyses and found that the rise time had a negligible influence on the response of the dam to UndEx. Pan et al. (2023) studied the importance of considering joints in an arch dam under far-field UndEx by applying the CAS method, and introduced a damage ratio to assess the blast resistance behaviour of the arch dam. They concluded that the damage ratio was greatest for the foundation, followed by the downstream face of the dam. Zhang et al. (2023) reported that longitudinal joints decreased the flexural rigidity and greatly weakened the gravity dam body. Tarinejad et al. (2024) proposed a 3D model of Karun4 dam under blast loading for three different reservoir levels (empty and filled reservoirs) and three TNT weights. Their results suggested that the influence of reservoir level on dam failure is negligible and that crest displacement decreased with a lower reservoir level.
For efficient numerical modelling of damage assessment, many complex phenomena need to be taken into account (e.g. fluid–structure interaction, mesh sensitivity, damage at high strain rates (Wang and Zhang, 2014; Wang et al., 2020; Zhu et al., 2022). In numerical analyses, concrete damage models also play an important role. Commonly used concrete damage models include the concrete damage plasticity (CDP) model, the Riedel–Hiermaier–Thoma (RHT) model and the Johnson–Holmquist 2 (JH-2) model. These models can predict the initiation of crack formation and help to understand the crack pattern as a result of an impact event. The CDP model depicts the non-linearity of concrete due to extreme loading conditions, with two different damage variables (compression and tensile damage) to depict the failure pattern (Lee and Fenves, 1998). The RHT model is used to model high strain rate brittle materials and contains pressure-dependent surfaces (elastic limit, failure and residual surfaces) (Riedel et al., 1999). The JH-2 model considers the quasi-brittle behaviour of concrete (Johnson and Holmquist, 1992), with strength, damage and pressure being the three main damage parameters of the model. The selection of a suitable material model is always very important in numerical investigations of dams under blast loading.
In the present study, a coupled 3D finite-element model (FEM) of Koyna dam, Maharashtra, India, was analysed to investigate the dynamic response of the dam under blast loading. The JH-2 model was adopted to describe concrete non-linearity. Unlike the CDP model, the JH-2 model predicts failure modes such as spalling of concrete and progressive element deletion, thus providing a precise representation of failure mechanism. Fluid–structure interaction was simulated by using the CAS technique in Abaqus (DS, 2014). Several previous studies have evaluated the performance of dams under impact loading, but studies were mainly focused on numerical simulation using coupled Eulerian–Lagrangian techniques. This is one of the few studies to explore the structural dynamic performance of a concrete gravity dam using the CAS technique and JH-2 damage model, with the performance of the concrete dam investigated by considering different parameters such as the weight of TNT, the position of the TNT and the reservoir level.
The remainder of this paper is organised as follows. Section 2 presents the problem statement, an overview of the CAS technique and detailed material properties of the concrete used to build a FEM of Koyna dam. Section 3 describes the mesh sensitivity analysis regarding the peak pressure and the damage profile of the dam. The results are discussed and recommendations are presented in Section 4. Damage analysis of Koyna dam and conclusions are presented in Section 5.
2. Problem statement and description of numerical model description
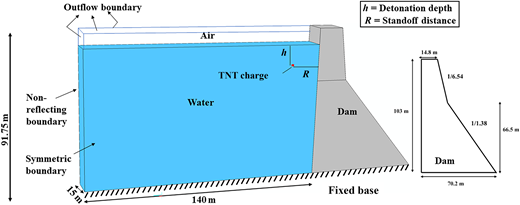
A 3D model of Koyna dam (Figure 1), standing at a height of 103 m with a base width of 70.2 m, was considered. The non-overflow width of the dam was set at 15 m. Computational simulation of Koyna dam under the influence of blast loading was conducted using the CAS technique. The JH-2 damage model was applied to capture the non-linearity of the concrete. The dam body was modelled using C3D8R (eight-noded linear brick element) with a mesh element size of 400 mm for the upper body part, increasing to 800 mm for to lower body part. The reservoir water was modelled using AC3D8R (eight-noded acoustic brick element) with a nominal element size of 0.8 m. A fixed boundary condition was assumed at the bottom of the dam and reservoir. A free boundary condition was considered for air. Explicit methods and element deletion were used for meshing. The effect of damping was ignored in the simulation as the structural behaviour of a dam due to UndEx is very transient and the role of damping is thus limited (Zhang et al., 2021a, 2021b).
2.1 Overview of the CAS technique
For UndEx, the CAS technique focuses on evaluating the behaviour of the affected structure, rather than only the acoustic response of water (Woyak, 2002). According to this approach, the primary function of modelling the water domain in the acoustic element is to illustrate the response of water according to the dynamic behaviour of the structure. Ample studies on the response of different marine structures have been conducted using CAS (Aman et al., 2011; Fathallah et al., 2015; Kalavalapally et al., 2009; Qiankun and Gangyi, 2011; Yin et al., 2016). The most notable distinction between UndEx analysis of dams and marine structures is the manner in which the structure interacts with water. In the case of marine structures, the target structure can be either submerged (Aman et al., 2011; Qiankun and Gangyi, 2011) or enclosed by water (Fathallah et al., 2015; Kalavalapally et al., 2009; Yin et al., 2016) in either a semi-infinite or infinite domain. In this case, the water behaves quite similarly to the structure’s boundary condition, resulting in a complex problem. On the other hand, dam–water interaction is considered at only the upstream face (the downstream interaction with water is generally ignored) and therefore the water and dam foundation act simultaneously as a boundary condition. The water in this case is taken as a semi-infinite domain corresponding to the upstream face. CAS modelling in the case of an UndEx event typically begins with the blast wave front contacting the target structure. Blast waves can be directly implemented at the acoustic–structure interface (scattered wave formulations) (Jen, 2009) or at the exterior of the acoustic surface (total wave formulation) (Moradloo et al., 2019) by applying time history pulses at the prescribed reference node. This loading method differs significantly from that used in traditional hydrocodes, where the shock load is determined from the explosion and blast waves travel afterwards. However, the efficiency of the structural response in CAS analysis depends upon validation of the implementation of the UndEx. Initially when TNT explodes, a time history graph of pressure indicates an instantaneous peak value followed by exponential decay. By using pressure and time values, pressure–time graphs for the CAS method can be specified. However, experimental pulse recordings are often unavailable. Where experimental pulse records are not available, an empirical formula (Cole, 1948) is usually used to measure the peak pressure values at specified points.
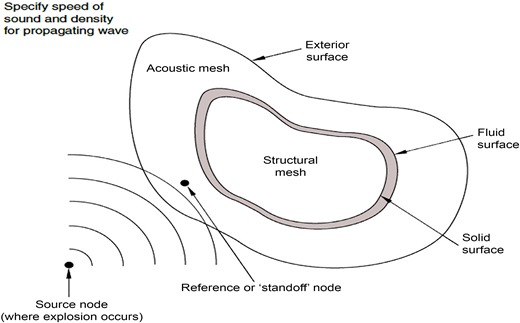
When an explosion or acoustic source generates a wave that strikes a submerged structure, it induces 3D transient loading on the structure (Figure 2). The fluid surrounding the structure is influenced not only by the explosive wave but also by shock waves reflected off the structure. The value of the pressure load imposed by the shock wave on the target structure or fluid depends on factors such as the explosion’s location, the properties of the fluid and predetermined characteristics of the detonator point. Understanding these variables is essential for accurately assessing the impact of blasts on structures.
2.1.1 Governing acoustic equations (Aman et al., 2011)
Based on Abaqus, CAS analysis was used to study the shock wave propagation of UndEx pressure on the dam and the interaction between the surrounding water and the dam. The boundary condition used at the water surface was non-reflecting. The fundamental theory of the CAS approach is provided elsewhere (DS, 2014; Everstine, 1981), so is not presented here. The equation for an adiabatic compressible fluid with small motions, in which velocity-dependent momentum loss is taken into account, is defined as (DS, 2014):
where p is the excess pressure in the fluid, x is the spatial position of fluid particle, is the fluid particle velocity, is the fluid particle acceleration, is the fluid density, is a volumetric drag, are field variables such as temperature, air humidity and water salinity, on which and may depend.
As the behaviour of fluid is assumed to be linear, inviscid and compressible, pressure is defined as:
where is the bulk modulus of the fluid.
To obtain the partial differential equation for direct integration transient analysis, Equation 1 is divided by Df and the result is deduced with respect to x. By considering the transient analysis, ignoring the term α/Df and combining the resultant with time derivatives of Equation 2, a differential equation for the fluid can be obtained in terms of fluid pressure (DS, 2014):
Integrating Equation 3 with the introduction of an arbitrary term , a similar equation of motion can be derived (DS, 2014):
From the CAS analysis available in Abaqus (DS, 2014), the fluid field equilibrium equation can be obtained as:
By applying the virtual work principle, structural behaviour can be obtained (DS, 2014):
where is a variational displacement field, t is the drag force of the structure, is the structure’s nodal stress, is the applied pressure on the wet surface of structure, is the normal to the structural surface, towards inside the fluid, d is the structure’s density, is a damping factor, is the virtual displacement with respect to virtual strain and and are the displacement, velocity and acceleration of the structure at one point.
To withstand cavitation in an acoustic medium, the sum of static and dynamic pressures (absolute pressure) should be greater than the cavitation limit. As soon as the pressure falls to this value, fluid is believed to expand freely without any significant reduction in dynamic pressure. The reduced absolute pressure will build again when the free expansion that occurs during cavitation is reversed sufficiently to reduce the volumetric strain to the amount at the cavitation limit. The equation of an acoustic medium considering cavitation is:
where is the cavitation limit of the fluid, is the static pressure and is the pseudo pressure, defined as:
2.2 Boundary conditions and fluid–structure interface
The bottom of the dam reservoir was considered a fixed condition. The interaction between the dam and the water was imposed using a CAS system. At the water surface, free surface boundary a condition was applied so that acoustic pressure at the free surface was zero during the analysis.
As TNT explodes, the explosive charge releases a shock wave that propagates through the infinite water medium, reaching the whole fluid domain. To accurately simulate this infinite water domain, a non-reflective boundary condition was designated at the outermost surface of the external fluid, ensuring that there were no cut-off effects at the water surface. Fluid–structure interaction was modelled using surface constraints based on CAS principles. Specifically, the primary surface was defined as the inner surface of the external fluid, while the secondary surface was the outer surface of the upstream face of dam. These surfaces were linked by a tie constraint, facilitating the coupling between structural displacement and acoustic pressure. The numerical model exchanged and transmitted data between the solid and fluid domains through the coupled fluid–structure interface. At the upper surface of the water, acoustic pressure was set as zero to apply a free surface boundary condition. The resulting structural response exhibited a strong coupling between the motions of the structure and the acoustic pressures at the interface with the external fluid.
2.3 Material parameters
2.3.1 The JH-2 model
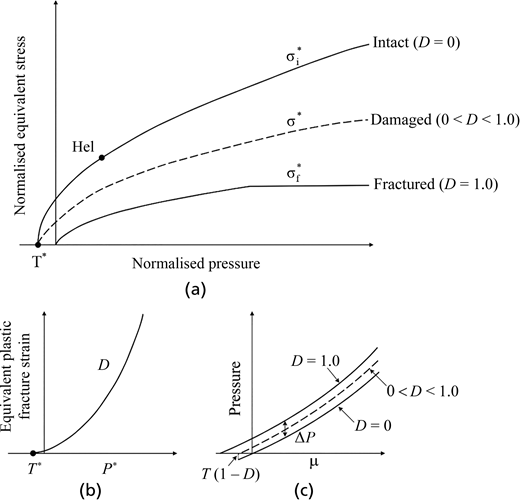
The JH-2 damage model (Johnson and Holmquist, 1994) can be used to understand the behaviour of brittle materials (concrete, rock, ceramics etc.) under very high strain impact loads. Johnson and Holmquist (1992) introduced the first version of the model (JH-1 model) in 1992 to account for very high strain rate impact loads but this model did not take progressive damage into consideration. Later, Johnson and Holmquist (1994) adopted some modifications and introduced a second version (JH-2 model) that mainly comprises the damage evolution rule. The parameters used in this study are given in Table 1 (Oucif and Mauludin, 2019). Figure 3 shows the three parameters of the JH-2 model (strength, damage and pressure). The relationships between the strength of damaged and undamaged materials along with pressure components are shown in Figure 3(a), in which indicates the Hugoniot elastic limit. The JH-2 model was modified by introducing factors in terms of damage and material strength. The damage parameter of the material is described in Figure 3(b). The failure function of the JH-2 model is described by the specific fracture strain, which is dependent on the total plastic strain. An element is eliminated once the material's plastic strain reaches the fracture strain. If the fracture strain is negative, the maximum tensile pressure serves as the failure criterion (Cronin et al., 2004). The relationship between pressure and volume is shown in Figure 3(c). In this relationship, the expansion of material due to damage was included.
The equivalent stress in the JH-2 model is defined as:
where is the normalised equivalent stress, D is the damage variable () and is the normalised fractured equivalent stress. To normalise the terms in Equation 9, the Hel was introduced in the JH-2 model to anticipate the wave propagation in materials under shock waves (Cronin et al., 2004):
where PHel is the pressure at the Hel. After normalisation, Equation 6, can be represented as:
The normalised equivalent stress and the normalised fracture stress are expressed as:
where A, B, C, M and N are material parameters, and are undamaged and damaged strength material parameters, respectively, is dimensionless strain, is the actual rate of strain, is normalised pressure, is the normalised maximum tensile hydrostatic pressure and Tmax is the maximum tensile pressure.
Hydrostatic pressure after damage starts to accumulate is described as:
where (ρ is the current density and ρo is the initial density), K1, K2 and K3 are material constants and is the increase in pressure due to damage.
As damage accumulates, the material tends to expand gradually; in other words, damaged material will have a greater volume than undamaged material. Due to the resistance offered by the surrounding material, there will be an increase in local pressure. The pressure increment due to expansion is expressed as:
where is an energy conversion coefficient.
The JH-2 model accounts for damage accumulation as:
where is the plastic strain, is the fractured plastic strain and D1 and D2 are damage variables.
The JH-2 damage model parameters used in this work are presented in Table 1 (Oucif and Mauludin, 2019).
For the material parameters of water, the bulk modulus was taken as 2.6 GPa and the density as 1000 kg/m3. The speed of sound in water was taken as 1500 m/s. The period for analysis was taken as 100 ms. Water is was using AC3D8R (eight-noded acoustic brick).
3. Validation and mesh sensitivity analysis
3.1 Effect on peak pressure
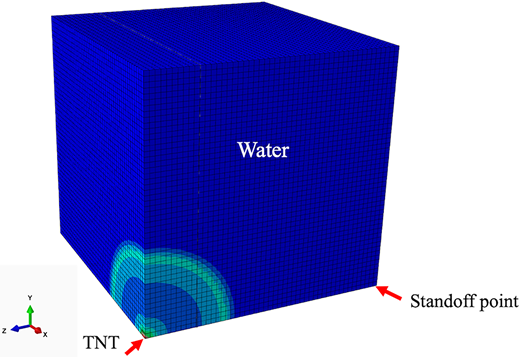
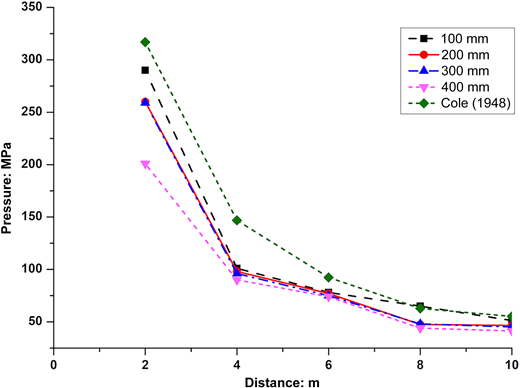
The behaviour of blast waves due to an UndEx (Cole, 1948) and the numerical simulation in Abaqus are now explored. A cubic geometry of water was formed as 1/8 of the water part, considering symmetry. To understand the behaviour of shock wave propagation in water, a numerical model of a 10 m × 10 m × 10 m volume of water was created in Abaqus (Figure 4). Mesh sensitivity was based on four different mesh sizes (100, 200, 300 and 400 mm). An outflow boundary condition was adopted to predict the UndEx behaviour. TNT of weight 1000 kg is applied at the corner and peak pressures at 2, 4, 6, 8 and 10 m from the charge centre were compared. In the case of an UndEx, the hydrostatic pressure of water is generally not accounted for as the magnitude of peak pulse overpressure is much greater than the hydrostatic pressure (Cole, 1948). As soon as TNT explodes, the pressure instantaneously rises to a peak value and then decays exponentially with time. The equation of peak pressure due to UndEx is (Cole, 1948):
where is the peak pressure of the wave at a specific target point, is an exponential decay time constant and tsw is the time taken for the shock wave to reach the target point. The peak pressure and the exponential decay time constant are expressed as:
where W is the weight of TNT (kg), R is the standoff distance (m) and and are constants (K1 = 52.16 MPa, K2 = 96.5 × 10⁻⁶, and .
The variation of peak pressure at different points for mesh sizes of 400, 300, 200 and 100 mm is depicted in Figure 5. The values of peak pressure at different designated points are compared with the values obtained using the empirical formula given by Cole (1948) (Equation 19). Figure 5 shows that the peak pressure became almost constant as the distance from the charge centre increased. Also, the effect of mesh sensitivity was almost negligible at 10 m. The results may converge by further reducing the mesh size, but this would also increase the computational time and cost. Likewise, a coarser mesh could be used to reduce the computation time.
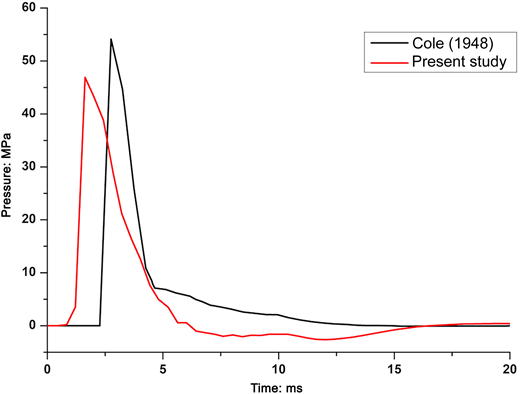
Figure 6 shows the pressure–time curves obtained at point B for a mesh size of 100 mm. The result from the numerical simulation (100 mm mesh size) aligned well with and Equation 18. It is evident that the peak pressure instantaneously increased as soon as the TNT exploded and then decayed exponentially. However, there are discrepancies as the numerical simulation could not depict the exact pattern of wave propagation. It is noteworthy that the negative phase in shock wave propagation is generally not accounted for (Wang et al., 2015).
3.2 Damage profile of dam for different mesh sizes
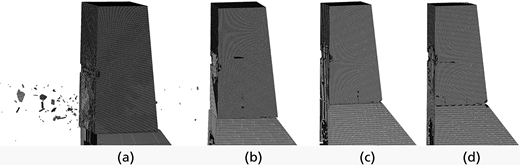
To investigate the influence of mesh size on the prediction of damage process of dam, four different mesh sizes (100, 200, 300 and 400 mm) were used to model the upper part of Koyna dam (Figure 7). Previous studies on dynamic analysis of dams indicate that a mesh size of 100 mm is sufficient for an accurate solution (Luccioni et al., 2006). A reduction in mesh size may provide more accurate results but it will also accelerate the computational time and cost. The weight of TNT used was 1000 kg. In all cases, a crack initiated from the downstream face and moved to the upstream face. When a fine mesh size was used, concrete spalling was modelled (Figure 7(a)), so the damage profile could be predicted more precisely in comparison with a coarser mesh. However, the model with a mesh of 400 mm showed almost the same damage pattern (Figure 7(d)) so, to reduce the computation time and the number of elements, the coarser mesh of 400 mm was adopted for dam's upper part.
4. Results and analysis
A concrete gravity dam (Koyna dam) under the influence of UndEx was modelled. Details of the numerical model, the material properties and the boundary conditions are provided in Sections 2 and 3 of this article. In the numerical investigation, different detonation depths of TNT, different charge weights and five different reservoir levels were considered to understand the dynamic behaviour of the dam under blast loading. The time duration was taken as 100 ms. Wave propagation, principal stresses, crest displacement and damage profiles were mapped to illustrate the structural dynamic behaviour of the dam under blast loads.
4.1 Shock wave propagation due to blast load
Figure 8(a) shows the pressure–time curves from the charge centre to the free water surface at different target points. Initially, when TNT explodes and strikes the free surface, the incident shock wave will reflect as a reflected wave. Due to the interaction of these shock wave pressures, negative pressure is generated, causing cavitation in the water at certain points. Because of this, when target points are closer to the free surface, the peak reflected pressure appears to be less than the incident wave pressure.
4.2 Tensile failure of dam
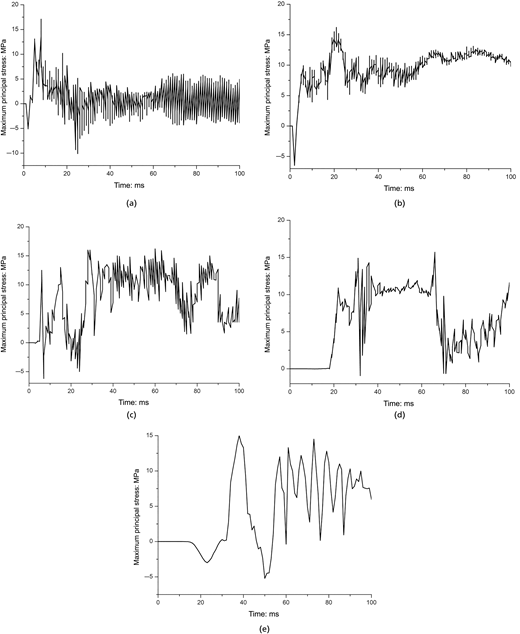
The time histories of maximum principal stress at different selected points in the dam are shown in Figure 9. In all cases, the maximum principal stress attenuated rapidly and then dropped suddenly due to failure of the material. With respect to the distance of designated points from the explosion centre, point P2 was the most affected, with elements at that dam section losing their tensile resistance (d ≈ 1) followed by points P1, P3, P4 and P5. The average maximum principal stress for all cases was around 15.5 MPa, which is considered to the main source of damage to the dam. As shown in Figure 9, small continuous fluctuations in the maximum principal stress values were observed. This pattern is considered to be the main detrimental factor influencing dams (Moradloo et al., 2019).
4.3 Influence of detonation depth
4.3.1 Comparison of displacement–time graphs
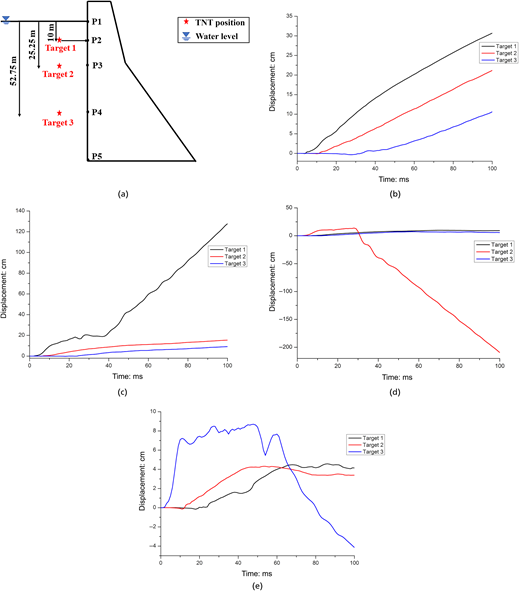
The lateral displacements of the dam corresponding to different points in the dam (P1–P5) for different detonation depths (targets 1–3) are shown in Figures 10(b)–10(e). When TNT explodes, it produces a shock wave that is characterised by a high frequency in a very short duration. It is clear from the graphs that the displacement fluctuated with time. This phenomenon is mainly due to the dam rebound phenomenon. As the depth of explosion was increased, the lateral displacements were reduced significantly and points close to explosion suffered the most damage.
At point P1, the greatest displacement (30.68 cm) occurred for detonation at target 1, followed by target 2 (21.18 cm) and target 3 (10.61 cm). At point P2, detonation at target 1 caused a maximum displacement of 127.68 cm followed by target 2 (15.43 cm) and target 3 (9.18 cm). The configuration of the dam changes at point P3, with the dam elements rebounding back corresponding to the shock wave at this point, leading to a displacement of −209 cm for target 1 and much smaller displacements for target 1 (9.2 cm) and target 3 (7.2 cm). At point P4, a displacement of 8.2 cm occurred for detonation at target 3, 4.5 cm for target 1 and 4.3 cm for target 2. As the base of the dam was fixed, no displacement occurred at point P5. In other words, these results show that the depth of detonation affected the dynamic response of the dam.
4.3.2 Tensile failure of the dam
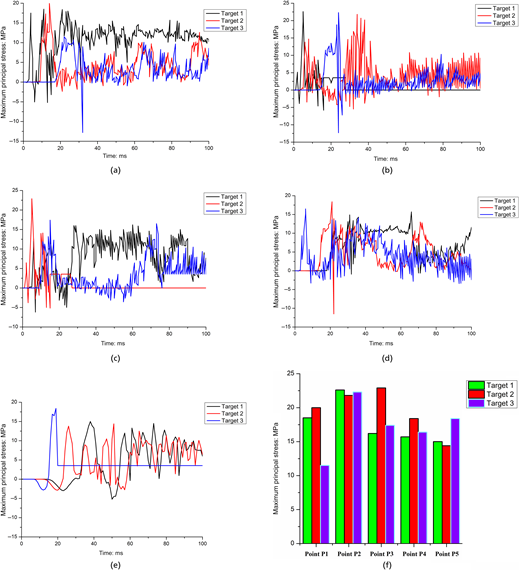
The maximum principal stresses at various points in the dam are shown in Figure 11. Considering the detonation depth (targets 1–3) and the distance of the designated points from the explosion centre, point P2 was damaged the most, followed by points P3, P4, P1 and P5. The graphs show that, the larger the distance of the point from the explosion, the lesser was the ultimate stress at that point. Point P5 failed after reaching the ultimate stress of an average of 12.6 MPa for all detonation depths. The heel (point P5) experienced less ultimate stress than the points in the upper part of the dam. The critical points showed large variations in strain (Figured 11(a)–11(d)). The heel (point P5) was fixed and so did not show large strain variation.
4.3.3 Blast wave propagation
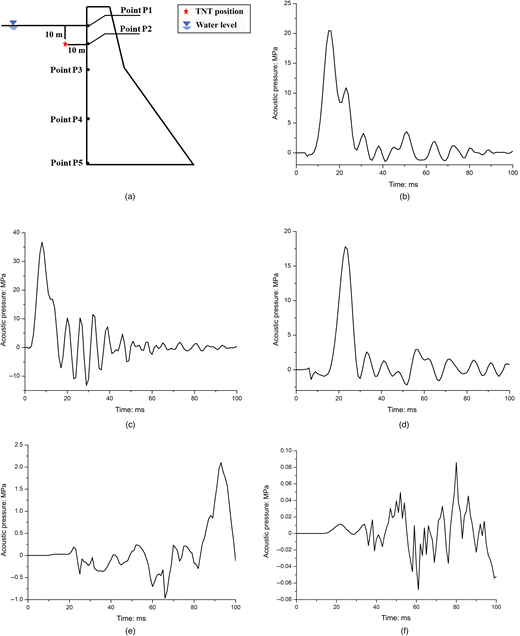
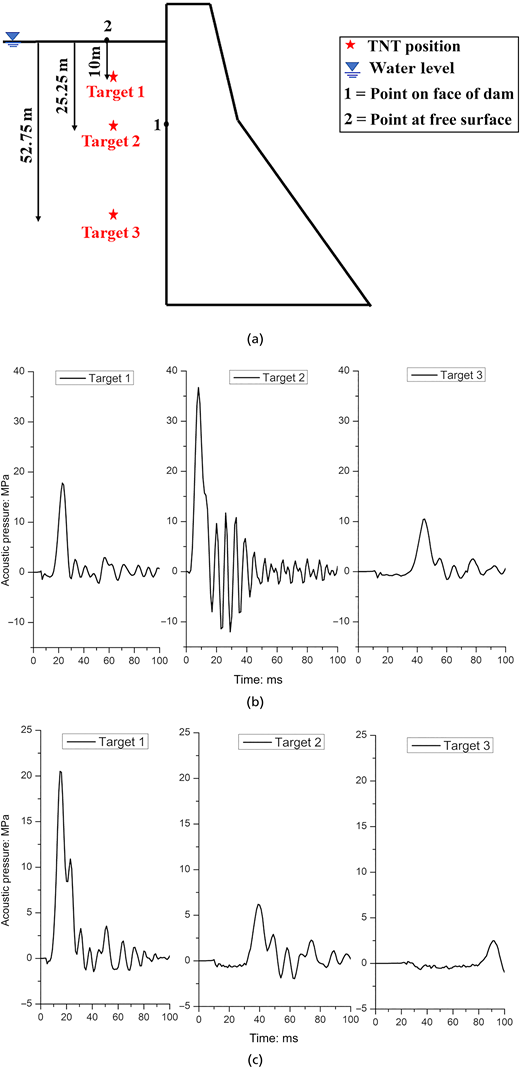
To study the variation of blast wave propagation with respect to the detonation depth, two points were selected at the face of the dam (point 1) and at the free surface of the water (point 2) along a straight line from the explosion (Figure 12(a)). Plots of acoustic pressure against time at these two points are shown in Figures 12(b) and 12(c), which show that the peak values at the face of the dam were higher than those at the free surface water. This is because point 1 is closer to the face of dam, and the reflected wave pressure becomes increasingly significant and is more than the incident pressure. As shown in Figure 12(b), at point 1 (at the dam face) the peak pressure for detonation at target 2 was about 2 times and 2.5 times the peak pressures for detonation at targets 1 and 3, respectively. At point 2 (free surface water), the peak pressure for detonation at target 1 was about 1.85 times and 7 times more than the peak pressures for target 2 and target 3, respectively. The graphs also show that, with an increase in the depth of the explosion, more time is required to reach the peak pressure.
5. Damage profiles of dam under different conditions
5.1 Damage to dam under different detonation depths
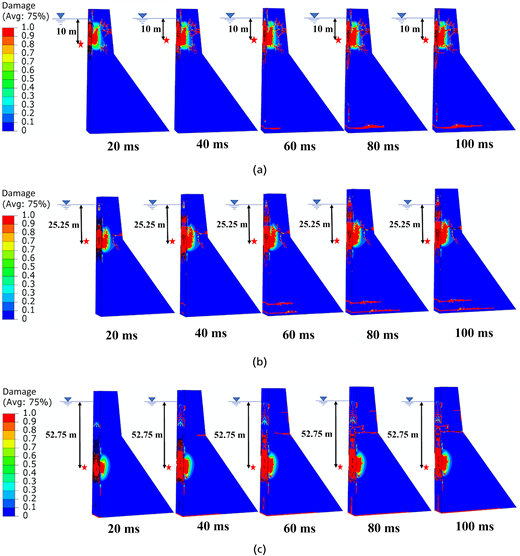
Damage to the dam at five different time steps (20, 40, 60, 80 and 100 ms) under blast loading is presented in Figure 13. As shown in Figure 13(a), when the detonation depth is was 10 m (target 1), crushing of concrete was observed at the centre of the TNT position on the upstream face of the dam; this caused spalling of the concrete. The major portion of damage was on the upstream face between the water surface and the upper part of the dam. The top of the dam suffered a few punching shear cracks caused by cavitation near the water's surface. As the TNT exploded, the compression wave slowly moved to the downstream face and formed a tensile wave, which resulted in tensile damage at the downstream face because of low tensile strength of concrete. When the detonation depth was 25.25 m (target 2), more punching cracks were generated on the upstream face of the dam, which extended to the interior of the dam (Figure 13(b)). The heel of the dam suffered punching damage with a deeper detonation depth (Figure 13(c)) because when the detonation depth was 52.75 m (target 3), the position of the explosive was far from the water surface. The influence of the cavitation effect decreased with an increase in the explosion depth. Very small punching shear cracks appeared on the top of the dam. In addition, the change in the geometry of the dam resulted in a stress concentration and tensile damage at the connections between the dam's top and lower slope.
5.2 Damage to dam under different TNT weights
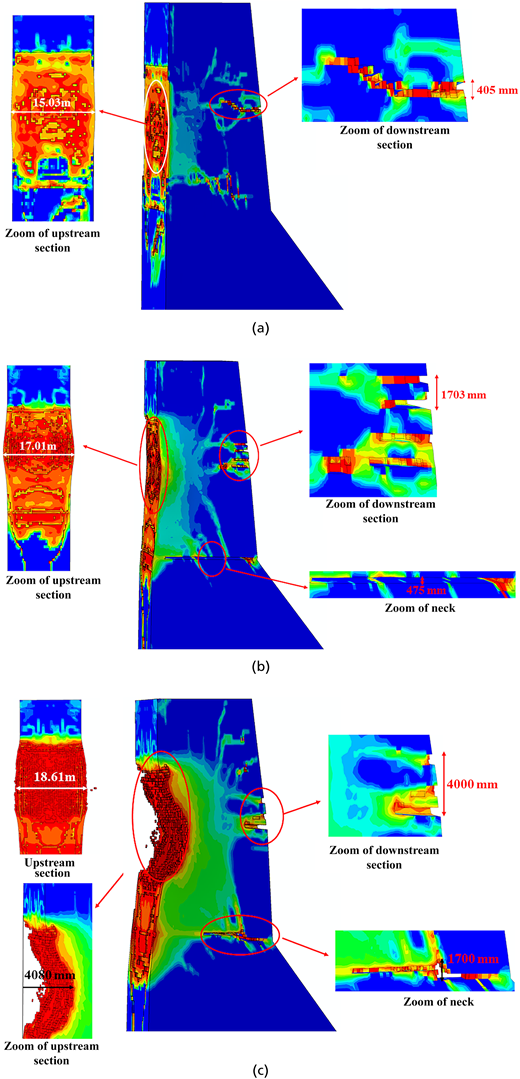
To study the influence of explosive charge on the damage profile of the dam, three TNT weights (500, 1000 and 1500 kg) were considered. The detonation was 10 m from the free surface. The progressive damage of the dam under these three TNT weights is shown in Figure 14. The results show that, with an increase in TNT weight, cracks formed on the upstream face of the dam due to an increase in tensile stress and these cracks subsequently became larger and extended to the downstream face. For TNT weights of 1000 kg (Figure 14(b)) and 1500 kg (Figure 14(c)), the crack width at the neck was 475 mm and 1700 mm, respectively. The crack widths for the three TNT weights are shown in Table 2, which shows that a charge of 1500 kg resulted in a crack width 800% larger than that obtained for 500 kg of TNT
5.3 Damage to dam under different reservoir levels
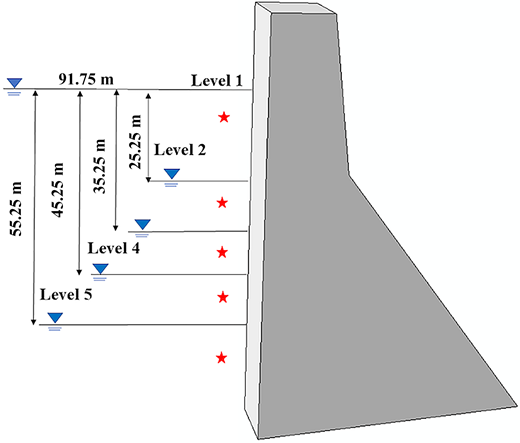
Effective measures regarding safety in the event of blast loading can be adopted by reducing the reservoir level. To study the effect of reservoir level on the performance of the concrete gravity dam subjected to UndEx, five different reservoir levels were considered (Figure 15). A detonation depth and stagnation distance of 10 m was adopted for all five reservoir levels.
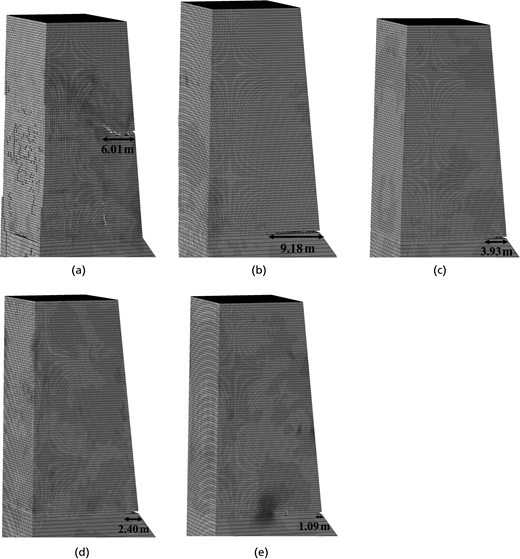
The damage profiles of the dam for different reservoir levels are presented in Figure 16. For reservoir level 1, the concrete in the upstream face of the dam was crushed, with cracks around 6.01 m long penetrating to the downstream face. No such crushing and spalling in the upper part of dam was observed when the reservoir level was reduced from level 2 to level 5. Therefore, it can be concluded that the drawdown of the reservoir plays an important role in the performance of gravity dams. Furthermore, when TNT explodes, shock waves travel to upper part of dam through air. Due to the cutting effect of water, the shock wave energy attenuates rapidly. Therefore, the upper part of the dam suffers less damage because less pressure is acting on it. Due to the transmission of stress waves from upstream to downstream, crack propagation was intense at the slope of the downstream face. The maximum horizontal crack length (9.18 m) at the neck of the dam was observed at for reservoir 2. This is because, at this point, the slope of the dam changes suddenly and the position of the TNT was very close to this point. It can be seen clearly that the horizontal crack length was reduced significantly by lowering the reservoir level from level 2 to level 5.
6. Conclusions
A fully coupled numerical model of a concrete gravity dam subjected to UndEx has been presented. Fluid–structure interaction, shock wave propagation, structural dynamic response and detonation position were characterised using the CAS method. Detailed modelling of the dam and damage analysis for different cases of UndEx were carried out. To check the accuracy of the numerical model, a water model was validated with the analytical equation for different mesh sizes. Acoustic pressures and structural responses such as maximum principal stress and displacement were calculated for different TNT depths. Damage analyses of the gravity dam were carried out for different TNT depths, TNT weights and reservoir levels. The conclusions of this study are as follows.
- ▪
Mesh sensitivity analysis plays an important role in the prediction of failure analysis of concrete gravity dams. However, a coarser mesh can be adopted in order to reduce the computational time.
- ▪
Due to the high compressive strength of concrete, tensile damage was the main factor in dam damage. Initially, points facing the explosion centre completely lost their tensile strength. As the distance from the explosion centre increased, less damage was observed.
- ▪
It is clear from the results that the TNT weight and the depth of detonation affected the dynamic response of the dam. For the same amount of explosive, as the depth of TNT from the reservoir surface increased, the displacement at different points in the dam was significantly reduced. Damage to the dam increased significantly with an increase in the weight of TNT.
- ▪
When the TNT was placed that at target 1 (i.e. a detonation depth of 10 m), the upper part of the dam suffered severe damage. With an increase in detonation depth, the heel of the dam suffered more localised punching damage but not destructive damage.
- ▪
When the reservoir was at the normal water level (level 1), more damage was concentrated in the upstream face and upper part of the dam. However, by reducing the reservoir level, the heel of the dam suffered more damage but severe damage was not observed at the heel. For the same amount of explosive and standoff distance, damage can thus be reduced significantly by lowering the reservoir level. Therefore, in case of a foreseen war, lowering the reservoir level can be an effective measure to reduce the risk of dam failure.
The dynamic behaviour of Koyna gravity dam under blast loading based on different TNT depths, TNT charges and reservoir levels was examined. In future studies, phenomena such as cavitation for different TNT cases can be studied. Additionally, a damage index for future blast load cases could be evaluated based on the dynamic response of the dam under different loading conditions.
Conflicts of interest
All contributors testify that there is not any conflict of interest with respect to research, publication and authorship involved in this work.
Funding
The authors received no financial support for this research work.