


This paper addresses the challenges of implementing the Paris Agreement’s climate goals within the built environment. It introduces an innovative ‘whole life carbon’ approach that integrates life-cycle assessment (LCA), carbon impact calculations and ecological footprint assessments. Three LCA quantification methods are explored, emphasising the pursuit of emissions transparency and adherence to ISO standards. The carbon impact assessment (CIA) methodology is presented as a suite of techniques which can also be used for predicting climate temperature rise. Three case studies demonstrate the effectiveness of this approach in evaluating various building scenarios. The research underscores the urgency of bridging the emissions gap and highlights the interconnectedness of resource use, biodiversity loss and carbon dioxide absorption, with potential links to economic and financial decisions. Collectively, these support the United Nations sustainable development goals: SDG 7 Affordable and clean energy; SDG 9 Industry, innovation, and infrastructure; SDG 11 Sustainable cities and communities; SDG 12 Responsible consumption and production; SDG 13 Climate action; and SDG 15 Life on land. The authors advocate for larger-scale studies, consideration of embodied carbon in commuting assessments and the application of the proposed approach as a practical and comprehensive tool to contribute to climate change mitigation in the built environment.
1. Introduction
When the Paris Agreement (UNFCCC, 2015) was adopted in 2015, it notably lacked specific directives for the design of buildings or masterplans to meet its ambitious climate targets. Today, national regulations continue to fall short of these goals. The Agreement seeks to limit the global mean surface temperature increase to below 2.0°C, ideally to 1.5°C, while balancing carbon dioxide (‘carbon’) sources and sinks. This paper delineates the methodologies and insights derived from collaborative efforts initiated shortly after the Agreement’s ratification, aimed at addressing these objectives.
The primary goal is to reduce greenhouse gas (GHG) emissions within the built environment using readily available project data. It advocates for a whole life carbon systems approach that encompasses commuting impacts, providing a comprehensive perspective on a project’s resource use and biodiversity implications. The methodology integrates life-cycle assessment (LCA), carbon impact assessment (CIA) and ecological footprint (EF) calculations, employing commercial software to offer insights into a project’s contribution to potential temperature increases.
Developed in anticipation of nationally determined contributions (NDCs) and their various emerging carbon reduction pathways, this approach is universally applicable and remains compatible with these frameworks. By embracing this methodology, project stakeholders are empowered to actively pursue low-carbon performance independently of the definitive outcomes or implementations of NDCs, which, at the time of writing, lag significantly behind the science-based trajectories required – hence, the paper’s title, ‘Mind the gap’.
The narrative utilises established datasets, and terminology such as GHG emissions and carbon dioxide equivalent (CO2e) is used to ensure alignment with cited sources.
2. The Paris Agreement is being missed
The climate targets of the Paris Agreement, specifically limiting global warming to 1.5°C, are not being met. Actions taken or pledged by the United Nations Framework Convention on Climate Change (UNFCCC) parties are insufficient to achieve this goal. According to the Climate Action Tracker’s December 2023 update (Climate Action Tracker, 2022), current policies and actions are projected to result in a temperature increase of approximately 2.7°C by 2100. Even with binding pledges and targets, the estimated temperature increase is expected to be around 2.1°C.
3. Mind the gap: the emissions target gap is large
Current global GHG emissions stand at approximately 55 GtCO2e per year (IPCC, 2021; Summary for policymakers). By 2030, there is projected to be a substantial emissions target gap of 20.3 to 23.9 GtCO2e between the pledged actions and the pathway required to limit global warming to 1.5°C. To contextualize, in the Intergovernmental Panel on Climate Change (IPCC) Sixth Assessment Report (AR6) Working Group III (WGIII) – who focus on climate-change mitigation- note (IPCC, 2022; Summary for policymakers) that in 2019, GHG emissions from buildings and from cement and steel used in building construction and renovation totalled 12 GtCO2e. Thus, the target gap is nearly twice all the carbon used to build and operate buildings (Figure 1). Consequently, within the next 6 years, virtually twice as much CO2e needs to be saved as is currently used to operate and construct buildings to achieve a safe pathway.
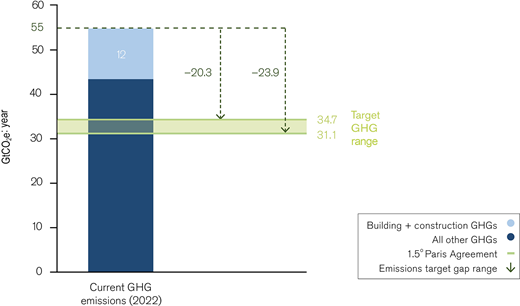
Current and target global greenhouse gas (GHG) emissions: the gap to targets is nearly double most buildings related emissions
Current and target global greenhouse gas (GHG) emissions: the gap to targets is nearly double most buildings related emissions
4. Biodiversity loss impacts carbon absorption
Article 4 of the Paris Agreement mandates a balance between carbon sources and sinks, now referred to as ‘net zero’. However, our carbon sinks are diminishing annually. The Global Footprint Network provides a comprehensive dataset that compares carbon dioxide emissions sources with available carbon sequestration sinks (Open Data Platform, n.d.; Global Footprint Network). Data reveal that, since 1961, the world’s carbon footprint has grown by 390%, from 3.2 billion global hectares (gha) to 12.5 billion gha. In contrast, forest biocapacity has decreased to 92% of its previous capacity, from 5.6 billion gha to 5.1 billion gha, due to pressures such as food production. Currently, we are producing 416% more carbon than nature can absorb, a trend that is worsening. Achieving successful climate change mitigation requires a structured and equitable balance between land uses, supported by efficiency gains and technological development.
5. Why is there an emissions gap?
The increase in carbon dioxide emissions is linked to a 247% rise in global population and a 71% increase in per capita emissions (Worldometer, n.d.; World Population). Urban populations grew from 34% of the global population in 1961 to 55% in 2018, emphasising the need for decarbonisation through responsible urban planning and construction (Ritchie, 2024; Urbanisation). The urban shift demands extensive new infrastructure, with individuals in industrialised countries requiring, at a minimum:
100 m2 of residential space
1 m2 of retail space
10 m2 each of office and social infrastructure space (hospital, library, bank, etc.)
additional infrastructure (utilities, roads, rails, airports, etc.).
Governmental regulatory efforts are slow, creating gaps between targets and tangible actions. To address this, the authors advocate for a holistic, systems-wide approach to decarbonising the built environment, considering the interrelated impacts of planning, scope, completeness and timing. This comprehensive methodology enables an optimal balance in carbon investment across different assets, highlighting the urgency for quick, effective decision-making tools to manage the demographic pressures escalating emissions.
6. Background science: balancing sources and sinks (net zero), resource flows and informing economics
6.1 Seeking all the emissions through LCAs
Balancing sources and sinks, as mandated by the Paris Agreement, necessitates the complete identification and effective mitigation of sources. Environmental management standards from the ISO 14000 series and the sustainability of construction works (BSI, 2011) provide a framework for building lifecycle models (Figure 2).
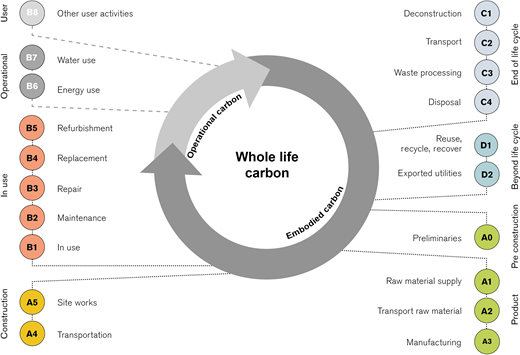
These standards facilitate stage-by-stage comparison in construction projects but do not prescribe specific methodologies. They emphasise transparency, rigour and the necessity for comprehensive LCA studies.
To support planning choices, the authors describe below three methods of LCA quantification aligned with BSI (2011) and (Materials and Embodied Carbon Leaders Alliance, 2024) (Figure 3). For transparency, stage A0, more recently defined, is included in A1, and commuting-related transport in B8 in the following.
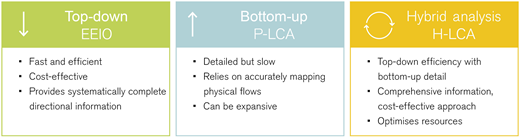
Top-down extended economic input–output (EEIO-LCA). This is a fast, cost-effective method providing directional information on resource flows for entire economies or sectors. Integrated into the Greenhouse Gas Protocol as a ‘spend-based’ assessment (Bhatia, 2011), it captures indirect and upstream impacts but may lack detail.
Bottom-up process analysis (P-LCA). Used for environmental product declarations, this detailed but slow method relies on accurately mapping physical flows. It is effective for comparing similar processes when material quantities are known, and hence is suitable for statutory applications like planning approvals, but risks truncation errors from system boundary limitations.
Hybrid analysis (H-LCA). This combines the strengths of top-down and bottom-up approaches, offering a comprehensive assessment at early stages in a cost-effective manner (Prasad, 2021). In the subsequent case studies, H-LCA was used to ensure a comprehensive carbon inventory that aligns with typical project stages and measures carbon dioxide emissions and absorptions (sources and sinks).
Construction projects transition from broad economic and functional goals in early briefing and design to specific details later. Whole life carbon is most significantly affected in early stages before material quantification is available (Figure 4). Many detailed physical material flows are never quantified, and the same can be said for economic considerations such as labour and equipment costs, which have significant carbon impact. Hybrid analysis is therefore an efficient way to achieve completeness of the carbon inventory.
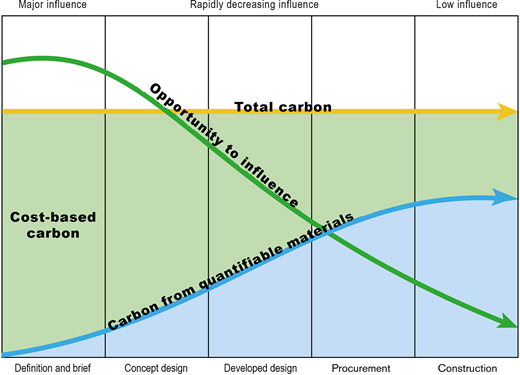
The biggest opportunity to influence whole life carbon is during project definition and brief, and conceptual design
The biggest opportunity to influence whole life carbon is during project definition and brief, and conceptual design
6.2 Avoiding excessive resource depletion – the Intergovernmental Platform on Biodiversity and Ecosystem Services, ecological footprint and the half-earth imperative
Living within planetary limits requires the avoidance of excessive depletion of natural resources. A joint committee of the Intergovernmental Platform on Biodiversity and Ecosystem Services (IPBES) and the IPCC has concluded that limiting global warming and protecting biodiversity are interconnected goals that must be simultaneously achieved for sustainable and equitable benefits for humanity (Pörtner, 2021).
The EF, endorsed by the IPBES, measures the biologically productive area needed to support human demands such as food, fibre, timber regeneration, carbon dioxide absorption and built infrastructure. The EF, normally expressed in global hectares or number of Planets, allows comparisons at various scales, providing insights into the demands on natural resources versus the available biocapacity to meet those demands (Open Data Platform, n.d.). An LCA which has complete scope, like the H-LCA, is crucial to match the EF of supply (biodiversity) with the EF of demand (including carbon waste) to verify balance against planetary limits. A detailed description of EF methodology is beyond the scope of this paper; for further information see Wackernagel et al. (2019).
E. O. Wilson’s ‘half-earth’ principle proposes reserving half of the earth’s biologically productive areas to naturally preserve 80% of species, advocating significant conservation goals (Wilson, 2016). This principle is reflected in the UN’s Post-2020 Global Biodiversity Framework 2030 conservation targets of conserving 30% of priority land by 2030, 30 by 30 (UN Environment Programme, 2021) and by conservation groups aiming for 50% conservation by 2050, 50 by 50 (Nature Needs Half, n.d.). The methodology described can thus support initiatives for climate change mitigation, biodiversity and species preservation.
6.3 Ecological footprint and climate change
Because the EF reveals the difference between carbon dioxide emissions and planetary absorption, it is a reliable indicator of climate change. A relationship exists between the net natural capacity to absorb carbon and future higher global mean surface temperatures. A person, entity, or process with an EF surpassing 1 Planet contributes to temperature increase (Ti). Hybrid life-cycle assessment (H-LCA), carbon dioxide emissions and EF calculations provide consistent results that can be correlated with temperature increase (IPCC, 2014). The IPCC projected a global temperature increase of 2.6°C to 4.8°C under the RCP8.5 scenario, with a mean of 3.7°C. At that time, typical buildings following minimum compliance standards had an EF of approximately 2.7 Planets. In contrast, the Paris Agreement targets limiting the temperature increase to 2.0°C, ideally 1.5°C, aligning with a sustainable balance of 1 Planet. By correlating EF, measured in number of Planets (nP) with temperature increase (Ti), projects can be benchmarked accordingly (Figure 5).
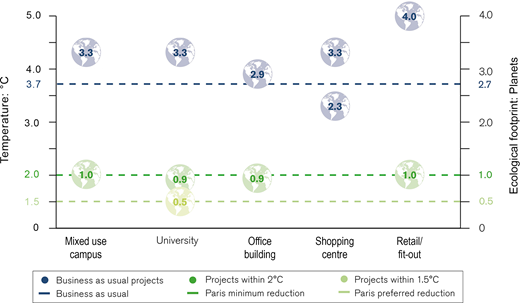
Global mean surface temperature increase and ecological footprint (EF) alignment with projects
Global mean surface temperature increase and ecological footprint (EF) alignment with projects
This correlation suggests that achieving a 1.5°C increase corresponds to a balance of 0.5 Planets, supporting climate restoration and the half earth principle, both living within planetary limits while limiting implied temperature increase. This relationship between Ti and the number of Planets (nP) closely approximates to:
6.4 An interrelationship between trade and financial flows
As introduced under the EEIO-LCA, international trade can be viewed as the exchange of resource flows with embedded EFs. Increasingly, financial decisions prioritise environmentally beneficial outcomes (European Commission, 2023; Glasgow Financial Alliance for Net Zero, 2021), encouraging methods that balance carbon impact reduction with financial viability. Such methods can support high-level investment decisions by identifying both environmentally sound projects and by project-level decisions with optimal life-cycle carbon impacts. Traditional regulations often omit financial aspects, focusing solely on environmental metrics. By integrating carbon impact, resource flow and cost, a more comprehensive understanding of investment benefits is achieved, enhancing value-based decision making, and aligning finance with environmental impact for more efficient, effective outcomes.
7. An approach to carbon impact assessment
Since the Paris Agreement in 2015, a methodology for CIA has been developed in which the following is assessed:
carbon dioxide emissions from building construction and operation (carbon inventory (CI))
ecological footprint (EF)
correlation with a predicted temperature increase Ti.
8. The goals of the project methodology
The project methodology is designed to achieve the following objectives:
science-based approach: utilising the foundational science from the IPCC, IPBES, Global Footprint Network and half-earth principles
rigorous systems-based framework: ensuring compatibility with the ISO 14040 series and the GHG protocol
adherence to planetary limits: demonstrating whether project impacts assist in climate stabilisation
global applicability: designed to be independent of regional or national legislation, yet compatible with them
practical implementation: leveraging readily available project information and existing commercial software for practical application
impactful guidance: providing timely and directional information at critical stages throughout the project life cycle
cost–benefit transparency: offering insightful analysis at the project, portfolio and national and international policy levels.
Since the adoption of the 2015 Paris Agreement, this methodology has been applied to over 150 projects across various regions, encompassing design, construction and operational stages.
9. The project methodology
The project’s H-LCA and EF are calculated using proprietary software (Hausschild, 2018; The Footprint Company, n.d.), enabling early cost-based carbon estimations. These calculations adhere to the international cost management standard (ICMS, 2021), ensuring consistent and replicable project assessments. As material quantities become available, these assessments are refined, allowing for the project’s Ti to be calculated.
9.1 Project’s whole life carbon inventory
The project’s whole life carbon dioxide emissions are categorised into sub-groups to form the carbon inventory (Figure 6).
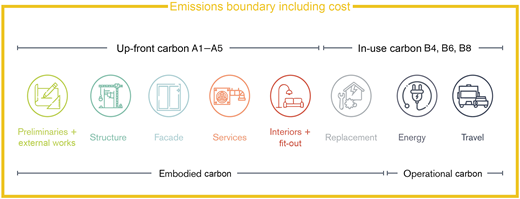
H-LCA pictorial representation of emissions boundary relating to ISO 14040 stages and ICMS categories
H-LCA pictorial representation of emissions boundary relating to ISO 14040 stages and ICMS categories
The major categories contributing to the embodied (scope 3) carbon (A1–A5) include:
preliminaries and external works: design, set-up, enabling work, demolition and site-specific external works, utilising cost-based carbon estimation for benchmarking
structure: components such as concrete, steelwork, reinforcement and related temporary works, including labour and testing
facade: facade elements, glazing, shading and related temporary works
services: mechanical (heating, ventilation and air-conditioning), electrical, hydraulic, fire and vertical transport systems, including ancillaries and temporary works
interiors + fitout: internal finishes, doors, frames and items such as furniture and laboratory equipment
replacement (A1–A5, B4): addresses periodic replacements over 60 years, incorporating design for deconstruction and circularity principles.
The last two categories contributing to the operational (scope 1 and 2) carbon (B6, B8) are calculated and annualised over the project’s life cycle. These are:
energy: assessment of the entire building’s energy use, including water-related energy consumption and renewable energy contributions
travel: focuses on commuting-related transport, its carbon impact, and strategies for reducing it through proximity to living spaces or low-carbon transport options.
9.2 Project ecological footprint inventory
To calibrate the project’s compatibility with planetary limits, an EF analysis is undertaken, examining both demand and supply sides. The project’s EF of demand includes the whole life carbon from above and relates to an area of forestry required to sequester those emissions. Additional on-site impacts include built area, landscaping, forestry, grazing, cropland and bodies of water. Off-site impacts may include the preservation of native forests, restoration of cropland, or establishment of offset areas like photovoltaic farms. The globally productive biocapacity – sometimes referred to as the EF of supply – is derived from the Global Footprint Network’s data (Global Footprint Network, 2019). Proprietary software calculates the EF and biocapacity metrics, measured in global hectares per square metre of building (gha/m2).
The Planet score (nP) is determined by dividing the EF of demand by the EF of supply. A score below 1 indicates a biocapacity surplus, demonstrating that the building operates within planetary limits by using less biocapacity than is regenerated annually. A score above 1 reveals a deficit, indicating that the building’s consumption exceeds what can be regenerated. A score of 1 denotes a balance, confirming the project’s impacts align with planetary limits.
9.3 Project contribution to climate change temperature increase
Based on the EF calculation (nP) the Ti of the project can then be calculated from Ti ≈ nP + 1
10. Case studies
The three case studies presented below provide insights into the application of this methodology. They have been selected to illustrate various aspects of these techniques and the lessons learned from each implementation.
10.1 Case study 1: carbon reduction strategies in the structure of a multi-building development
A H-LCA (A1–A5) was conducted for a project in Qatar consisting of eight premium grade office buildings: two tall towers, two short towers, four podium buildings each linked to a tower, and a common basement car parking area. The building features are detailed in Table 1.
Development features divided by building
| Building class | Premium office | Car park | ||
|---|---|---|---|---|
| Building features | Tall tower | Short tower | Podium buildings | Basement car parking |
| NFA: m2 total | 159 792 | 118 497 | 161 686 | 332 255 |
| NFA: m2 single building | 79 896 | 58 891 | 42 708 | 91 681 |
| GFA: m2 total | 231 382 | 164 647 | 180 373 | — |
| GFA: m2 single building | 115 691 | 81 827 | 47 644 | 91 681 |
| Building class | Premium office | Premium office | Premium office | Car parking |
| Above-ground storeys | 72 | 51 | 6 | — |
| Below-ground storeys | — | — | — | 5 |
| Population | 5839 | 3994 | 2497 | 184 |
| Modal split | ||||
|---|---|---|---|---|
| Car | 85% | 85% | 85% | 85% |
| Bus | 5% | 5% | 5% | 5% |
| Rail | 10% | 10% | 10% | 10% |
| Ferry | — | — | — | — |
| Cycling | — | — | — | — |
| Walking | — | — | — | — |
In net floor area (NFA) and gross floor area (GFA), except car park areas which are expressed in gross external area (GEA) as inclusive of parking areas
10.1.1 Notable findings
The analysis, depicted in Figure 7, revealed that shorter buildings generally exhibit a lower carbon impact when transport patterns are consistent, with a significant increase in upfront carbon for taller structures. Specific low-carbon supply chain management strategies were implemented, focusing on ‘big-ticket’ items such as cement and steel to achieve substantial carbon savings. These strategies included using 50% cement replacement, yielding a 32% reduction in the concrete structure’s carbon footprint, and sourcing structural steel with 65% recycled content, which resulted in a 60% reduction in carbon dioxide emissions related to structural steel. Reusable steel formwork was also utilised, reducing concrete-related carbon by 11%. Low-carbon rebar with 20–65% recycled content was considered, potentially saving up to 33% in carbon dioxide emissions for the rebar.
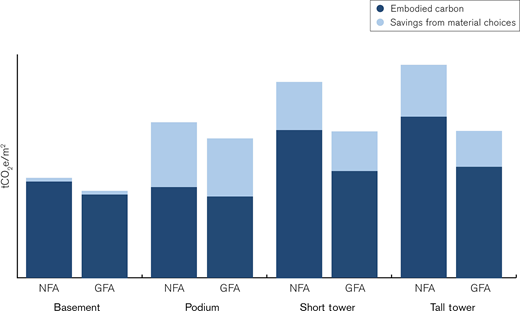
Up-front embodied carbon comparison of each building A1–A5 in net floor area (NFA) and gross floor area (GFA)
Up-front embodied carbon comparison of each building A1–A5 in net floor area (NFA) and gross floor area (GFA)
These modifications led to a total carbon saving of 31% for the building structures. These alternatives were presented to the client during the tender phase, resulting in the acceptance of most, except for the client’s preference for newly established local rebar manufacturing, as illustrated in Figure 7.
The analysis further indicated that after these changes, the five-storey underground car parking had a more substantial carbon footprint than the superstructures of the six-storey podium buildings and accounted for 75% and 66% of the carbon footprints of the 51-storey and 72-storey towers, respectively. This underscores the significant embodied carbon impact of underground car parks, which becomes even more pronounced when considering the carbon dioxide emissions from associated commuting.
10.2 Case study 2: transport hub tower compared to non-transport hub low rise
A H-LCA was conducted to compare the whole life carbon of two buildings, A and B. Building A, featuring a steel and concrete structure, is part of a transport-oriented development (TOD) in a high-density urban area. TOD is an urban design strategy that clusters development – such as employment, housing, services and amenities – around public transport hubs, promoting compact, mixed-use, pedestrian and cycle-friendly environments. Building B, primarily a timber structure, is located in a low-density area with limited public transport access (Figure 8).
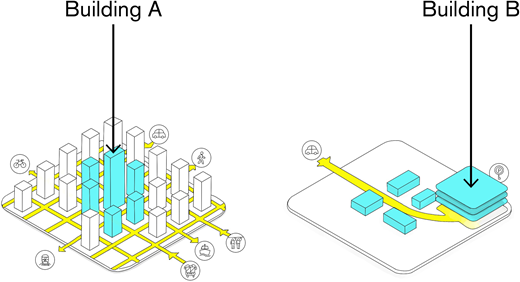
Building A: transit-oriented development at a metro station. Building B: low-rise development with car-based commuting transport with minimal public transportation infrastructure
Building A: transit-oriented development at a metro station. Building B: low-rise development with car-based commuting transport with minimal public transportation infrastructure
Both projects serve the same client in the USA and encompass both embodied (up-front A1–A5 and replacement B4) emissions and operational (energy B6 and travel B8) emissions (WGBC, 2021). The characteristics of both buildings are detailed in Table 2.
Development features comparisons. Note: GFA for building B excludes car parking
| Building class | Premium office situated above Metro | Premium office situated above basement car parking |
|---|---|---|
| Building features | Building A | Building B |
| GFA: m2 | 245 628 | 42 956 |
| NFA: m2 | 197 047 | 36 706 |
| Above-ground storeys | 60 | 4 |
| Below-ground storeys | 3 | — |
| Population | 12 900 | 3335 |
| Modal split | ||
|---|---|---|
| Car | 12% | 85% |
| Bus | 11% | 8% |
| Rail | 49% | 2% |
| Ferry | 1% | — |
| Cycling | 1% | 3% |
| Walking | 26% | 2% |
10.2.1 Notable findings
Figure 9 compares the H-LCA outcomes (a) without and (b) with travel considerations. Initially, without accounting for commuting travel emissions, building B appears to emit 43% less CO2e over its life cycle compared to building A. However, when travel emissions are factored into the assessment, building A, as a transport-oriented development, exhibits an 11% lower carbon impact overall.
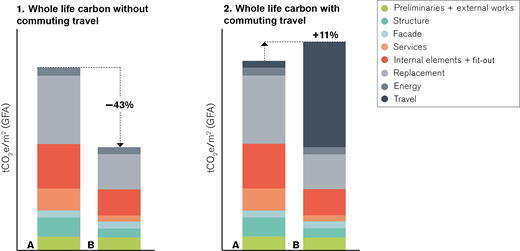
Whole life carbon comparison without versus with travel considerations A1–A5, B4, B5, B6
Whole life carbon comparison without versus with travel considerations A1–A5, B4, B5, B6
This case study underscores the significant influence of commuting-related transport on the whole life carbon performance of a building. It highlights the importance of adopting a comprehensive and integrated systems approach to sustainability to accurately forecast and mitigate whole life carbon dioxide emissions.
10.3 Case study 3: conversion of an industrial building to an office
The Acciona Ombú project in Madrid exemplifies adaptive reuse of a historic industrial building. Located near rail and bus networks, this project promotes the use of public transportation to reduce its carbon footprint (Brady, 2021). The project retained the existing masonry, roof structures and window frames, while integrating new underground facilities. The building’s features are detailed in Table 3.
10.3.1 Notable findings
Significant carbon savings were achieved by preserving the original structure, which avoided 30% of the carbon typically emitted from structural elements and 50% from the facade. This preservation strategy resulted in an overall 25% reduction in carbon across the building’s entire life cycle compared to a typical new office building in the same location (Figure 10) (Brady, 2021).
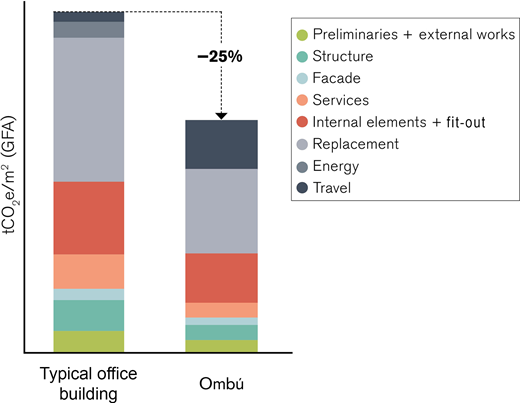
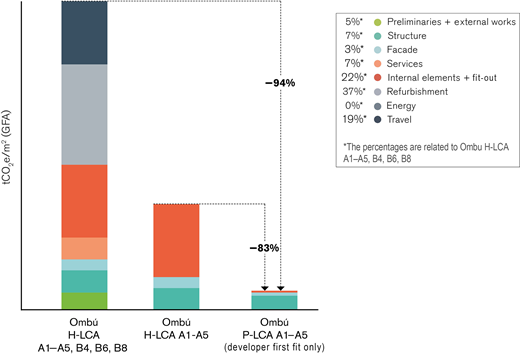
The use of cross-laminated timber slabs reduced the embodied carbon by 67% compared to a reinforced concrete alternative. In addition, retaining the original facade conserved 73% of its carbon compared to a complete rebuild. The building’s energy-efficient design is estimated to reduce energy use by 35% compared to a baseline building, and its operation powered by 100% renewable energy results in zero carbon impact. Future replacements are projected to contribute 32% to life-cycle emissions, with commuter transport adding a further 20%. Figure 11 summarises the emissions by sub-groups.
10.3.2 Economically balanced sources and sinks
The H-LCA, including commuting-based travel, was assessed and used to calculate the EF, achieving a Planet score of 1. This successfully balances sources and sinks, achieving net zero. The resulting temperature increase is therefore calculated as:
Thus, the Paris Agreement criteria are met. Future travel patterns are expected to increasingly favour public and renewable transport, which could reduce the building’s temperature impact to between 1.5 and 1.7°C. The client is highly satisfied with the economic return on the project (Brady, 2021).
10.3.3 Whole life carbon comparisons using different scopes and methodologies
Among the lessons learned since the ratification of the Paris Agreement is that there remains significant confusion around the evaluation and presentation of carbon impacts. This can be illustrated through this project, where different carbon assessment scopes are applied depending on the context (Figure 11):
a comprehensive whole life carbon (A1–A5, B6, B8) assessment using H-LCA for a broad view of pre-construction activities, embodied (up-front) and operational carbon, future replacements and commuting transport modes
embodied (up-front) carbon (A1–A5) analysis using H-LCA, including additional carbon from full fit-outs for tenant or occupant items (estimated on a spend basis per the GHG protocol)
embodied carbon (A1–A5) assessed with P-LCA for regulatory compliance, covering only the developer level base fit-out.
The comprehensive (A1–A5, B6, B8 H-LCA) whole life carbon impact scope is 94% higher compared to the basic regulatory (A1–A5 P-LCA) compliance embodied carbon scope. A spend-based assessment of a fully fitted-out building reveals 83% more carbon than a basic regulatory (A1–A5 P-LCA) scope.
These discrepancies emphasise the need for clear communication to decision-makers about the real climate impact of assets and any carbon offsetting strategies towards net-zero goals. It is also evident that carbon abatement requires the involvement of multiple stakeholders, including public sectors and regulators if the complete system is to be understood and addressed effectively.
11. Conclusions – our journey trying to ‘mind the gap’
The case studies presented underscore the environmental advantages of adopting a whole life carbon approach, utilising H-LCA.
Case study 1: compares the structure of a podium building with high-rise towers, illustrating that the shorter building has the lowest carbon impact when transport patterns are identical. It also reveals that five underground parking levels can emit more carbon than an optimised six-storey office, nearly matching that of much taller towers. A potential 31% reduction in structural carbon is achievable through the use of low-carbon materials.
Case study 2: examines a high-rise, transport-oriented development, observing a higher initial carbon footprint but lower lifetime emissions due to reduced commuting. This underscores the efficacy of building near public transport nodes.
Case study 3: employs a comprehensive carbon impact assessment based on H-LCA, revealing significant carbon savings from using low-carbon materials like timber and promoting public and electric transport. This aligns with a 2°C temperature increase target, with the potential for further reductions.
H-LCA facilitates the early identification of carbon impacts, influencing decisions related to site selection, construction methodologies, transport and material choices. This enables stakeholders, including contractors and suppliers, to contribute effectively to sustainability efforts. Simplifying the communication of carbon impacts through temperature increase (Ti) helps engage a wider audience, making this approach practical for global application, and allowing for comparisons between financial investments across different sectors.
12. Implications for practice and future research
This paper highlights practical strategies to reduce the carbon impact of development projects, as summarised below.
Employ H-LCA and EF early: utilise H-LCA and EF analyses in the early design stages to assess and communicate a project’s carbon footprint effectively.
Estimate temperature increases: combine H-LCA and EF assessments to estimate temperature increases attributable to buildings, informing investment and design decisions.
Prioritise low-rise and above-ground structures: favour low-rise buildings and avoid basement car parks to reduce embodied carbon.
Incorporate low-carbon transport modes: integrate sustainable transport options into development plans to minimise whole life carbon emissions.
Optimise transport modes for complex developments: leverage the best possible transport modes to enable the development of more complex sites and higher up-front carbon impact buildings, particularly when evaluated on a life-cycle basis.
Promote adaptive reuse: encourage the refurbishment of existing buildings as a means to significantly reduce carbon emissions compared to new constructions.
Enhance stakeholder communication: clearly communicate the benefits and limitations of various LCAs to stakeholders, fostering a greater understanding of sustainability and climate change mitigation.
Further research should focus on:
urban density and public transport access: conducting whole life carbon studies on large-scale developments to evaluate the effects of urban density and public transport access on carbon emissions
embodied carbon in commuting: assessing the embodied carbon of commuting and strategies to reduce it within compact city designs
advancing methodologies for existing developments: extending H-LCA methodologies to optimise and retrofit existing developments while exploring sustainable urban strategies that integrate residential and commercial functions.
These practices and research directions aim to advance sustainable urban development, reduce carbon emissions and contribute to global climate change mitigation efforts.

