
Lusail Stadium hosted the FIFA World Cup Qatar 2022 final on 18 December 2022 – an event that secured its place in the history of world football. As the largest and most iconic of the eight tournament stadiums, Lusail was a significant engineering challenge. Situated in Lusail city, this state-of-the-art venue with a capacity exceeding 88 000, showcases innovative architecture, engineering design and construction precision. This paper describes the structural systems designed for the bowl, the roof and the vessel structure in detail, providing insight into the processes followed by the project team to build the complex curvilinear bowl-shaped vessel and the hyperbolic paraboloid roof. The latter required a process involving modelling, form-finding and non-linear analyses, which are described in this paper. The tight construction timeline and stringent tolerance requirements demanded a comprehensive control process and a strict sequence to ensure smooth installation of the facade and roof membrane. The design of Lusail Stadium seamlessly blended tradition and modernity, representing Qatar's rich heritage while incorporating cutting-edge technologies. It stands as an exemplar of innovative and cutting-edge civil engineering.
1. Overview
This paper provides details on the challenges and innovative solutions adopted in the design and construction of Lusail Stadium, drawing insights from a number of scholarly works in the field of stadium engineering and architecture, including Zhang and Li (2018) on the overarching engineering challenges in stadium construction, Ali and Taha (2021), who provide case studies and lessons learned from innovative structural systems in large stadiums and Chen and Zhao (2020), who discuss advanced construction techniques for complex stadium structures. In addition, Gupta and Sharma (2019) delved into the delicate balance between tradition and modernity in stadium architecture, while Khan and Park (2018) shed light on specific challenges and solutions pertaining to the design and construction of large stadium roofs. Furthermore, Li and Chen (2017) offer insights into innovative facade systems and Patel and Gupta (2016) contribute valuable perspectives on construction management techniques, particularly relevant for fast-track stadium projects. The aim of this paper is to provide a comprehensive understanding of the considerations involved in the design and construction of Lusail Stadium as a good example of modern stadium engineering and architectural innovation.
The design of the 80 000-seat Lusail Stadium (Figure 1), the venue where the final game of the FIFA World Cup Qatar 2022 was played, is inspired by the interplay of light and shadow that characterises the ‘fanar’ – an Arabic word meaning a lantern. The shape of the stadium and the facade echo the intricate decorative motifs on bowls, vessels and other art pieces found across the Arab and Islamic world. The natural environment of Qatar has shaped its culture and architecture; the need for shelter and shade in the hottest months of the year has led local architecture to create strong enclosures with protected internal spaces. As such, many large structures have very simple and small openings that are heavily veiled from the sun and wind. These then open up to protected courtyard spaces of varying scales that become the focal points for life within the structures. This was taken into account in the design of Lusail Stadium.
 This image features an aerial perspective of an expansive stadium, showcasing its unique circular architecture and distinct textured roof design. The structure appears to be illuminated by surrounding lights, revealing a large open area at its center. In the background, various buildings and construction sites hint at a developing urban environment, with the skyline of a city visible under the evening sky. Surrounding the stadium are pathways and scattered palm trees, contributing to the overall layout, while the twilight setting emphasizes the stadium's prominence in the landscape.
The unique and magnificent Lusail Stadium, located 15 km north of central Doha
This image features an aerial perspective of an expansive stadium, showcasing its unique circular architecture and distinct textured roof design. The structure appears to be illuminated by surrounding lights, revealing a large open area at its center. In the background, various buildings and construction sites hint at a developing urban environment, with the skyline of a city visible under the evening sky. Surrounding the stadium are pathways and scattered palm trees, contributing to the overall layout, while the twilight setting emphasizes the stadium's prominence in the landscape.The unique and magnificent Lusail Stadium, located 15 km north of central Doha
Designing a building’s facade to keep out heat but let in light can be an enriching opportunity to sculpt light and shadow. The deep contrast within a building as patterns of light fall on floors and walls can significantly enrich the interior. The exterior cladding of Lusail Stadium (Figure 2) forms the main architectural design feature seen by spectators: the ‘masharabia’, a delicate skin of repetitive and creative geometric form, controls light and lets its changing path decorate its interior through the day. At night, it creates a sparkle of light to define the building and cause it to stand out against clear skies as spectators come into the stadium. The double-curved surface of the facade vessel sets the geometric definition and panelisation of the facade. The facade is composed of flat panels that are supported by three-dimensional (3D) adjustable brackets off the steel structure. The panels are triangular along the diagonal grids to follow the warp of the surface. The name of the city where the stadium is located, Lusail, refers to a rare Arabian flower that grows amid the desert, taking from its roots the shiny golden colour. The triangular-shaped structure of the vessel and roof’s cladding was inspired by the growing process of the Lusail plant.
 The image depicts a contemporary stadium characterized by its unique, textured exterior design resembling a honeycomb pattern. The structure appears prominently against a clear blue sky. In the foreground, there is a wide, empty space with no visible people, featuring a road leading up to the stadium. Surrounding vegetation includes palm trees, and the entryway is visible at the base of the structure.
 The facade of Lusail Stadium
The image depicts a contemporary stadium characterized by its unique, textured exterior design resembling a honeycomb pattern. The structure appears prominently against a clear blue sky. In the foreground, there is a wide, empty space with no visible people, featuring a road leading up to the stadium. Surrounding vegetation includes palm trees, and the entryway is visible at the base of the structure. The facade of Lusail Stadium
2. Structural system
The structure forms the skeleton of the stadium, supporting the bowl, roof and facade. A rigid concrete seating bowl is held by concrete cores and columns, housing all of the terracing and accommodation areas of the stadium. The roof is supported by tubular steel columns, each oriented to meet at the apex and base, forming circumferentially stiff V shapes. The concept of the outer steel vessel system is to create the impression of a ‘floating’ stadium, separated from the ground, with discreet concrete plinths supporting the structure above.
The structural system consists of
reinforced concrete (RC) for the bowl structure, core walls and shear walls, columns, beams and slabs
a steel-framed flooring system with a composite concrete deck slab for the rear cantilever portion of the bowl structure at level 5 and above
precast concrete elements for the tiers, rakers and bleachers, which will mostly be removed in the legacy phase
A structural steel system for the compression ring, V frames and vessel facade support structure
A cable net structure with tension and compression rings as the roof structure, supported by the perimeter V frames and the vessel frame structure.
3. Bowl structure
The bowl has six to eight levels, depending on the zone, and supports seating tiers, utilities and mechanical, electrical and plumbing (MEP) plants. The steel framing perimeter of the bowl on the rear side is supported by 24 RC plinths. A truss support system is used to transfer the loads of the extended floor area at level 5 and above. A composite slab system is used exclusively at the rear side of level 5 and the floors above that.
3.1 Lateral stability
The global stability system of the bowl consists of core walls and shear walls, which reach up to the top, and floor slabs acting as diaphragms transferring the horizontal loads (wind, seismic and crowd dynamic actions) to the lateral stability system.
3.2 Foundation
Based on available geotechnical investigations, isolated pad footings were selected for the columns and a raft foundation was chosen for the core walls and the perimeter cantilever concrete plinths. The 24 concrete plinths support both the bowl steel framing above level 5 and the roof structure on corbels through spherical bearings. They carry very heavy vertical and horizontal loads.
3.3 Expansion joints
In order to allow the concrete to expand/contract due to temperature variations, expansion joints or movement joints were introduced at eight strategically selected locations without compromising the architectural design intent and at the same time meeting the structural requirements, especially due to strains induced in the slabs due to the presence of the rigid core walls and the curved shape of the slabs in plan. The expansion joints and zones are shown in Figure 3 and include the stadium bowl plus the perimeter at the level 1 podium independent structure.
 The image displays a structural layout divided into nine distinct zones arranged in a circular pattern. Zone 9 occupies the central region and is surrounded by eight equally spaced outer zones labelled Zone 1 through Zone 8. Each of these outer zones extends radially from the perimeter of the central zone to the outermost boundary of the circular structure. The boundaries separating the zones are delineated with thick lines extending from the center outward. Structural elements and reference markers are arrayed around the circumference, with radial lines connecting them to the center, suggesting modular or radial assembly components.
Expansion joints and zones
The image displays a structural layout divided into nine distinct zones arranged in a circular pattern. Zone 9 occupies the central region and is surrounded by eight equally spaced outer zones labelled Zone 1 through Zone 8. Each of these outer zones extends radially from the perimeter of the central zone to the outermost boundary of the circular structure. The boundaries separating the zones are delineated with thick lines extending from the center outward. Structural elements and reference markers are arrayed around the circumference, with radial lines connecting them to the center, suggesting modular or radial assembly components.Expansion joints and zones
3.4 Analytical model
3.4.1 Concrete design
Two sets of analytical 3D finite-element models were created for each zone (one for the tournament mode and one for the legacy mode). The RC beams, columns and core walls were designed using Etabs software.
Three Slab Analysis using Finite Elements models were developed for the RC suspended slabs for the design of the slabs – serviceability, strength and thermal models. The maximum requirement out of these three models was adopted in the reinforcement design. The thermal model was used to account for the long-term shrinkage and temperature variations and to evaluate long-term deflections and crack widths, present due to the restraints from the rigid core walls and the curved slab shape in plan view. Cracks on each slab face were plotted and, in all areas where the crack width exceeded 0.3 mm, additional reinforcement was added. Careful consideration was given to the application of loadings to cover the worst-case scenario between tournament and legacy modes.
3.4.2 Steel structural design for level 5 and the floors above
The architectural configuration of the bowl structure from level 5 and above introduced an outward projection of the upper floor slabs relative to the floors below. The projected floors are supported by a truss system which spans between plinths (24 in total) spaced equally on circumferential grids around the bowl structure (Figure 4). These plinths also support the steel vessel structure and the stadium roof. In order to reduce the structural loads of the rear-projected areas that need to be transferred to the plinths, structural steel framing and composite deck slab were used at level 5 and above. Figure 5 shows a schematic diagram of the projected floors and the separation between steel and concrete construction.
 This image depicts a detailed 3 D rendering of a stadium’s architectural design, showcasing various seating levels and structural supports. The stadium has a round shape with a central field area. The seating flows around the perimeter, made visible by the overlapping support beams designed to provide stability. The design highlights the complex arrangement of tiers, including both inner and outer seating areas, illustrated with parallel lines and angular placements.
Overall structural system of the bowl
This image depicts a detailed 3 D rendering of a stadium’s architectural design, showcasing various seating levels and structural supports. The stadium has a round shape with a central field area. The seating flows around the perimeter, made visible by the overlapping support beams designed to provide stability. The design highlights the complex arrangement of tiers, including both inner and outer seating areas, illustrated with parallel lines and angular placements.Overall structural system of the bowl
 The image displays a technical architectural drawing featuring a section view of a building with multiple levels labeled from one to eight. The left side shows a curvilinear profile with points indicating various structural nodes. The right side represents vertical levels, detailing different materials used for framing, distinguished as steel framing and concrete framing. Annotations provide additional context, and there are indications of a precast stair layout at the top. Each level’s dimensions are illustrated with horizontal lines across the full height of the structure.
Projected floors at level 5 and above
The image displays a technical architectural drawing featuring a section view of a building with multiple levels labeled from one to eight. The left side shows a curvilinear profile with points indicating various structural nodes. The right side represents vertical levels, detailing different materials used for framing, distinguished as steel framing and concrete framing. Annotations provide additional context, and there are indications of a precast stair layout at the top. Each level’s dimensions are illustrated with horizontal lines across the full height of the structure.Projected floors at level 5 and above
3.4.2.1 Transfer system
The major elements of the transfer system are as follows.
Cantilevers. The exterior columns around the perimeter of the floors project out approximately 9.0 m from the line of the support (the plinths). Cantilevers were required to support the projected slab of level 5 and the exterior columns above, as shown in Figure 6. The spacing of the cantilevers follows the spacing of the exterior columns, 7.6 m (grid spacing).
Trusses. The cantilevers are supported by transfer trusses spanning 34 m between the plinths. The trusses are 4.5 m deep (centre to centre); the top chord is located underneath level 5 framing and the bottom chord is slightly below level 4 (Figure 7). The trusses are continuously connected within each zone (three trusses for each zone) and they are separated at the expansion joints between zones.
Kickers. In order to reduce the deflection of the cantilevers and keep the steel section to a manageable size, kickers are provided, as shown in the snapshot in Figure 8. The lower ends of the kickers are connected to the vertical members of the transfer truss. Due to high compression forces in the kickers, horizontal struts are used to transfer the horizontal component of the kicker force to the level 4 diaphragm slab. The vertical component of forces in the kicker is resisted by the transfer truss.
 The image presents a precise technical drawing of a building's structural plan. The layout includes Truss 1 and Truss 2 positioned within the frame, with their top chords and base connections annotated. Fixed points are shown along key locations, likely representing load-bearing or anchorage areas. An expansion joint is clearly marked, separating structural segments to allow for movement. Reference markers such as BBR 9 and C6 are positioned to indicate alignment or component placements.
 Plan view of zone 5 transfer system
The image presents a precise technical drawing of a building's structural plan. The layout includes Truss 1 and Truss 2 positioned within the frame, with their top chords and base connections annotated. Fixed points are shown along key locations, likely representing load-bearing or anchorage areas. An expansion joint is clearly marked, separating structural segments to allow for movement. Reference markers such as BBR 9 and C6 are positioned to indicate alignment or component placements. Plan view of zone 5 transfer system
 The image depicts a structural engineering design detailing a cross-section of a framework. Key elements include levels marked as Level 4 and Level 5, both displaying a height of five thousand millimetres. Two plinths are shown at the base, supporting the structure. A cantilever beam is highlighted across the middle with accompanying dimensions, including a span of seven thousand six hundred millimetres. Additionally, a composite slab is labeled at the top of the drawing. The entire structure stretches horizontally across a total length of thirty-three thousand three hundred eighty-two millimetres. Dimensions are prominently indicated with arrows and text annotations for clarity.
Typical truss elevation
The image depicts a structural engineering design detailing a cross-section of a framework. Key elements include levels marked as Level 4 and Level 5, both displaying a height of five thousand millimetres. Two plinths are shown at the base, supporting the structure. A cantilever beam is highlighted across the middle with accompanying dimensions, including a span of seven thousand six hundred millimetres. Additionally, a composite slab is labeled at the top of the drawing. The entire structure stretches horizontally across a total length of thirty-three thousand three hundred eighty-two millimetres. Dimensions are prominently indicated with arrows and text annotations for clarity.Typical truss elevation
 The drawing depicts a vertical cross-section of a building, detailing structural elements such as a raker beam extending at an angle, composite floor slabs supported by floor steel beams, and a reinforced concrete wall providing lateral stability. Height levels are precisely marked as S S L followed by numerical values, denoting specific structural slab levels from base to upper floors. Annotations label components including a ceiling support frame beneath upper floors, a truss top chord connecting to higher structural elements, and a cantilever steel beam extending outward from the main structure. The arrangement shows the relationship between horizontal and vertical load paths and illustrates how each element integrates within the full structural system, with clear indicators of function and alignment to support construction planning.
Configuration of kickers and horizontal braces
The drawing depicts a vertical cross-section of a building, detailing structural elements such as a raker beam extending at an angle, composite floor slabs supported by floor steel beams, and a reinforced concrete wall providing lateral stability. Height levels are precisely marked as S S L followed by numerical values, denoting specific structural slab levels from base to upper floors. Annotations label components including a ceiling support frame beneath upper floors, a truss top chord connecting to higher structural elements, and a cantilever steel beam extending outward from the main structure. The arrangement shows the relationship between horizontal and vertical load paths and illustrates how each element integrates within the full structural system, with clear indicators of function and alignment to support construction planning.Configuration of kickers and horizontal braces
3.4.2.2 Load path of transfer system
The load path of the upper levels load is shown in Figure 9. The exterior columns supporting the upper levels impose loads on the tip of the cantilever on level 5 at point 1. The cantilever is supported by a kicker, a transfer truss spanning between plinths and by the connection to the interior concrete diaphragm. The offset between the external columns at point 1 and the truss at point 2 creates an overturning moment equal to vertical column loads multiplied by the distance between point 1 and point 2. The overturning moment is resisted by pull and push forces at level 5 and level 4. respectively. The horizontal pull–push forces will be resisted by the level 5 and level 4 diaphragms respectively, which transfer the lateral pull–push forces to the concrete core walls of the bowl. The cantilever loads are transferred to the truss through the kickers and direct bearing on the top chord of the truss. Finally, the truss transfers the vertical loads onto the plinths. The design forces were large, for example, the maximum tension force on the cantilever beam was 12 500 kN, the maximum compression at the bottom of level 4 was 10 000 kN and the maximum diagonal force was 8800 kN.
 The diagram represents a cantilever beam arrangement. It highlights two points, identified as Point 1 and Point 2. Arrows indicate various forces at play: a vertical column reaction above Point 1, tension and compression forces demonstrated with red and blue arrows, respectively. A kicker, truss, and the reaction at the plinth are also labeled. The directional flow of forces is clearly shown, indicating pull and push interactions at different points on the structure.
Gravity load path
The diagram represents a cantilever beam arrangement. It highlights two points, identified as Point 1 and Point 2. Arrows indicate various forces at play: a vertical column reaction above Point 1, tension and compression forces demonstrated with red and blue arrows, respectively. A kicker, truss, and the reaction at the plinth are also labeled. The directional flow of forces is clearly shown, indicating pull and push interactions at different points on the structure.Gravity load path
4. Steel roof
The roof and steel structural system of Lusail Stadium consist of a roof cladding system, a roof cable net structure, a compression ring structure, a curved V frame system and the vessel structure; all the structural components are illustrated in Figure 10. The roof span to the inner bottom chord of the compression ring is 278 m while the tension ring diameter is 122 m. The steel tonnage of the bowl structure is 10 500 t while the total steel tonnage is about 23 000 t.
 The diagram presents a vertical arrangement of the structural components of a building. At the top, it includes the membrane, followed by steel arches, a cable structure, and a compression ring. Each component is depicted with technical lines and includes labels. Below the compression ring lies a curved V frame and a vessel structure. Additional elements such as the standing seam (gutter) and façade are shown at the bottom. On the right side, various bracing components, such as the plan bracing cable, connecting strut, upper and lower radial cables, and oculus bracing, are also displayed vertically.
Exploded view of structural components
The diagram presents a vertical arrangement of the structural components of a building. At the top, it includes the membrane, followed by steel arches, a cable structure, and a compression ring. Each component is depicted with technical lines and includes labels. Below the compression ring lies a curved V frame and a vessel structure. Additional elements such as the standing seam (gutter) and façade are shown at the bottom. On the right side, various bracing components, such as the plan bracing cable, connecting strut, upper and lower radial cables, and oculus bracing, are also displayed vertically.Exploded view of structural components
For a cable net roof structure, the geometrical non-linearity is usually not neglectable. Therefore, during the design phases, an integrated structural model (Figure 11) was developed to assess the design forces and movements of the whole structure.
 The image presents a three-dimensional structural model comprising a roof cable-membrane system supported by a steel framework. The top part displays a mesh-like roof labeled as “Roof cable-membrane structure” and “Steel structure,” showing its curved, tensile form. Beneath this, a second view illustrates the same geometry mapped with a numerical height gradient scale, ranging from 0 to 0.72198 meters. This color-coded elevation map highlights the vertical displacement or shape variation across the structure. Adjacent to the model is numerical output data titled “Nodal Solution,” listing analysis variables such as step, sub step, time, and average value, as well as maximum and minimum values denoted by D M X and S M X respectively. These figures quantify the structural deformation or response at different nodes under simulated conditions.
Lusail Stadium: (a) Integrated structural model developed using Ansys; (b) deformation of the whole structure under gravity loading
The image presents a three-dimensional structural model comprising a roof cable-membrane system supported by a steel framework. The top part displays a mesh-like roof labeled as “Roof cable-membrane structure” and “Steel structure,” showing its curved, tensile form. Beneath this, a second view illustrates the same geometry mapped with a numerical height gradient scale, ranging from 0 to 0.72198 meters. This color-coded elevation map highlights the vertical displacement or shape variation across the structure. Adjacent to the model is numerical output data titled “Nodal Solution,” listing analysis variables such as step, sub step, time, and average value, as well as maximum and minimum values denoted by D M X and S M X respectively. These figures quantify the structural deformation or response at different nodes under simulated conditions.Lusail Stadium: (a) Integrated structural model developed using Ansys; (b) deformation of the whole structure under gravity loading
5. Steel structure
5.1 Structural principles and geometry
The primary function of the steel vessel structure of Lusail Stadium is to support the roof structure and to form the main skeleton structure on the vertical elevation that supports the facade panel. The steel vessel structure sits at the rear of the bowl on 24 circumferential cantilever concrete plinths (through corbels); the plinths (shown in Figure 4) also support the cantilever part of the composite steel bowl above level 4. The steel vessel structure is supported by bearings that sit on top of the corbels and, as such, the roof and vessel structure are structurally independent of the concrete/steel bowl structure.
From an aesthetic point of view, the key design intention of the steel structure was to form a series of triangular shape lattices on the stadium elevation while at the same time ensuring adequate stiffness and strength to provide an overall covering ‘tegmen’ of the stadium. The steel structure consists of three main parts – the compression ring, the curved V frame and the vessel structure. The principal geometries of these were governed by the following.
Compression ring. The geometry was governed by the roof shape and the setting out of the cable net grid on the facade. Figure 12 indicates the main principle and controlling geometry features for the compression ring.
Curved V frame. The geometry was governed by the roof shape, the setting out of the cable net grid, the perimeter location of the concrete structure slab edge, the location of the concrete plinth and the facade geometry. Figure 13 shows the four primary steps to generate the curved V frame structure.
Vessel structure. The geometry was governed by the roof shape and facade lattice geometry shown in Figure 14.
 The image consists of two sections labeled (a) and (b). The first section depicts a three-dimensional model of a roof structure featuring a pringle surface with a complex lattice framework and multiple radial lines extending outward, suggesting force distribution. In the second section, a detailed view shows the roof cable net grids and the facade surface and lattice, emphasizing structural connections. Annotations point out specific parts of the design, highlighting key architectural features.
Compression ring location setting out
The image consists of two sections labeled (a) and (b). The first section depicts a three-dimensional model of a roof structure featuring a pringle surface with a complex lattice framework and multiple radial lines extending outward, suggesting force distribution. In the second section, a detailed view shows the roof cable net grids and the facade surface and lattice, emphasizing structural connections. Annotations point out specific parts of the design, highlighting key architectural features.Compression ring location setting out
 The image contains four technical diagrams labelled (a), (b), (c), and (d) that depict a sophisticated structural design. Diagram (a) shows a curved V-frame outline with roof cable net grids and a façade lattice, illustrated with red and blue lines. Diagram (b) presents a cross-section of a multi-level structure highlighting elements such as the compression ring and plinth setting out point. Diagram (c) features a curved surface with a grid and prominent purple lines indicating structural details. Diagram (d) displays a framework with web bracings and distinct chords, annotated for clarity. Each diagram incorporates detailed annotations for key structural components and spatial relationships within the design.
Curved V frame setting out: (a) outer chords follow the façade lattice; (b) four controlling lines were used to define the surface on which inner chords would lie on; (c) the inner chords lie on the surface created in (b), following the façade lattice and roof grids; (d) web bracings created in between inner chord and outer chord
The image contains four technical diagrams labelled (a), (b), (c), and (d) that depict a sophisticated structural design. Diagram (a) shows a curved V-frame outline with roof cable net grids and a façade lattice, illustrated with red and blue lines. Diagram (b) presents a cross-section of a multi-level structure highlighting elements such as the compression ring and plinth setting out point. Diagram (c) features a curved surface with a grid and prominent purple lines indicating structural details. Diagram (d) displays a framework with web bracings and distinct chords, annotated for clarity. Each diagram incorporates detailed annotations for key structural components and spatial relationships within the design.Curved V frame setting out: (a) outer chords follow the façade lattice; (b) four controlling lines were used to define the surface on which inner chords would lie on; (c) the inner chords lie on the surface created in (b), following the façade lattice and roof grids; (d) web bracings created in between inner chord and outer chord
 The image presents a sequence of technical architectural diagrams depicting a lattice structure used in a vessel-like architectural form. Diagram (a) shows a three-dimensional view of the external layout, highlighting components such as the facade lattice, outer chord, and roof cable net grids with annotations that guide interpretation. Diagram (b) offers a magnified view of a specific segment of the facade lattice, focusing on its geometric configuration and line distribution. Diagram (c) illustrates a sectional curve that represents the generation of an inner chord derived from the outer chord, giving insight into the structural layering. Diagram (d) provides a top-down schematic of a circular lattice arrangement, where multiple straight lines extend from a central hub to points along the perimeter, suggesting measurement axes or structural radii. The combined diagrams convey the spatial logic and engineering behind the lattice concept, offering a comprehensive breakdown of components relevant to architectural and structural detailing.
Vessel structure setting out
The image presents a sequence of technical architectural diagrams depicting a lattice structure used in a vessel-like architectural form. Diagram (a) shows a three-dimensional view of the external layout, highlighting components such as the facade lattice, outer chord, and roof cable net grids with annotations that guide interpretation. Diagram (b) offers a magnified view of a specific segment of the facade lattice, focusing on its geometric configuration and line distribution. Diagram (c) illustrates a sectional curve that represents the generation of an inner chord derived from the outer chord, giving insight into the structural layering. Diagram (d) provides a top-down schematic of a circular lattice arrangement, where multiple straight lines extend from a central hub to points along the perimeter, suggesting measurement axes or structural radii. The combined diagrams convey the spatial logic and engineering behind the lattice concept, offering a comprehensive breakdown of components relevant to architectural and structural detailing.Vessel structure setting out
5.2 Structural components
5.2.1 Compression ring
Four primary ring chords lie on the four vertices of the box-type truss, with vertical and plan bracing arranged between them, forming the main shape of the compression ring (Figures 15 and 16). Two additional rings in the centreline of the upper layer and bottom layer were introduced into the system to provide a more efficient structural element layout. The middle ring in the upper layer was shifted down by a certain distance to provide space for the roof perimeter gutter. All the lateral loads transferred from the cable net are collected by the compression ring and converted to compression forces in the four primary rings.
 The image features a three-dimensional wireframe representation of a large architectural structure characterised by a sweeping curved form and composed of triangular lattice supports. The design is displayed from three viewpoints: a top view that emphasizes the extent and curvature of the structure, a side view revealing its height and depth, and an angled front view that showcases the symmetry and overall geometric balance. The triangular supports are evenly distributed across the framework, creating a consistent lattice pattern. The structure appears to be segmented into distinct sections, highlighted through the wireframe construction, with key areas delineated by thicker lines or denser intersections. This multi-angle presentation allows for a detailed spatial interpretation of the complex architectural form.
Compression ring
The image features a three-dimensional wireframe representation of a large architectural structure characterised by a sweeping curved form and composed of triangular lattice supports. The design is displayed from three viewpoints: a top view that emphasizes the extent and curvature of the structure, a side view revealing its height and depth, and an angled front view that showcases the symmetry and overall geometric balance. The triangular supports are evenly distributed across the framework, creating a consistent lattice pattern. The structure appears to be segmented into distinct sections, highlighted through the wireframe construction, with key areas delineated by thicker lines or denser intersections. This multi-angle presentation allows for a detailed spatial interpretation of the complex architectural form.Compression ring
 The image presents a 3D structural diagram illustrating a construction design with various compression rings and chords. The left side depicts the arrangement of different chord types, including inner upper, middle upper, inner lower, middle lower, and outer lower chords, with specific compression rings labeled for clarity. The right side features a modified design where the middle upper ring chord is moved downward to create additional space for services. Annotations and blue dashed lines connect the labels to the respective components, helping in identifying structural changes. The overall structure is shown in a wireframe style, emphasizing the complexity of the design.
Compression ring element layouts
The image presents a 3D structural diagram illustrating a construction design with various compression rings and chords. The left side depicts the arrangement of different chord types, including inner upper, middle upper, inner lower, middle lower, and outer lower chords, with specific compression rings labeled for clarity. The right side features a modified design where the middle upper ring chord is moved downward to create additional space for services. Annotations and blue dashed lines connect the labels to the respective components, helping in identifying structural changes. The overall structure is shown in a wireframe style, emphasizing the complexity of the design.Compression ring element layouts
5.2.2 Curved V frame
The main function of the curved V frame structure (Figure 17) is to take all the loads from the compression ring and the vessel structure to the supporting concrete plinth. To prevent clashes with the floor slabs, the originally straight V columns were eventually designed to curve outwards; a minimum of 400 mm clear space was maintained from the utmost inner surface of the steel frame section and the closest floor slab edge. However, the resulting curved column would sustain considerable additional bending moment due to the eccentricity of the loading, which would result in a significant steel tonnage increase. Therefore, to ensure structural efficiency, web bracings connecting this curved V column and the vessel diagrid structure were introduced. This generated a ‘semi-crescent’ shape curved V frame system (Figure 18). The curved V frame structure also provided higher stiffness in both lateral (radial) and vertical directions.
 The image presents a three-dimensional model of a curved structure, such as a bridge or architectural element, characterized by a framework of interconnected triangular supports. The design exhibits a repeating zigzag pattern along the surface, emphasizing its structural symmetry and aesthetics. The triangular supports are displayed in a contrasting style, with certain elements highlighted in blue, allowing for a clear distinction between different parts of the framework. The top view reveals the curvature of the structure, while additional views from the sides illustrate depth and potential layering. The overall arrangement facilitates an understanding of the model's complex geometry and construction technique without overlooking any significant visual details.
Curved V frame
The image presents a three-dimensional model of a curved structure, such as a bridge or architectural element, characterized by a framework of interconnected triangular supports. The design exhibits a repeating zigzag pattern along the surface, emphasizing its structural symmetry and aesthetics. The triangular supports are displayed in a contrasting style, with certain elements highlighted in blue, allowing for a clear distinction between different parts of the framework. The top view reveals the curvature of the structure, while additional views from the sides illustrate depth and potential layering. The overall arrangement facilitates an understanding of the model's complex geometry and construction technique without overlooking any significant visual details.Curved V frame
 This image presents a detailed diagram of a three-dimensional lattice structure. It shows two sections of the lattice framework, each comprising curved columns formed in a semi-crescent shape. The left section features highlighted yellow areas showing the curved elements, while the right section illustrates blue V-shaped constructs. Annotations in red arrows point towards specific components, labelled as 'semi-crescent' shape curved lattice column formed in V shape along the circumferential direction, providing clarity on the design's structural details. The image showcases a complex arrangement of triangular and lattice elements that define the overall architecture.
Formation of the V frame system
This image presents a detailed diagram of a three-dimensional lattice structure. It shows two sections of the lattice framework, each comprising curved columns formed in a semi-crescent shape. The left section features highlighted yellow areas showing the curved elements, while the right section illustrates blue V-shaped constructs. Annotations in red arrows point towards specific components, labelled as 'semi-crescent' shape curved lattice column formed in V shape along the circumferential direction, providing clarity on the design's structural details. The image showcases a complex arrangement of triangular and lattice elements that define the overall architecture.Formation of the V frame system
5.2.3 Vessel structure
The vessel structure is made up of a double-skin diagrid structure (spanning between the curved V frames), which supports the external cladding system. Horizontal trusses acting as wind trusses, normal to the facade surface, resist lateral loads on the facade. The diagrid trusses take all the vertical loads from the facade panel to the outer chord of the curved V frames (Figures 19 and 20).
 The image showcases a three-dimensional structural model that features an interconnected framework composed of lines forming triangles. The model appears to be a continuous loop, resembling an architectural design. It is presented from different angles, offering views from the left, top, and right, highlighting the geometric complexity of the structure. The framework integrates both black and green elements, illustrating the design’s intricacies. The overall structure emphasizes symmetry and architectural ingenuity, suitable for architectural or engineering analysis.
Vessel structure
The image showcases a three-dimensional structural model that features an interconnected framework composed of lines forming triangles. The model appears to be a continuous loop, resembling an architectural design. It is presented from different angles, offering views from the left, top, and right, highlighting the geometric complexity of the structure. The framework integrates both black and green elements, illustrating the design’s intricacies. The overall structure emphasizes symmetry and architectural ingenuity, suitable for architectural or engineering analysis.Vessel structure
 The image features two architectural diagrams comparing different truss configurations. On the left, the diagram displays a vessel structure occupying the triangular space between V-shaped frames, with structural lines forming angular patterns and annotations indicating design components. On the right, multiple truss arrangements are shown, including a normal truss configuration applied to the upper diagonal band and a Vierendeel truss used in the lower diagonal bands. The diagram also identifies a normal truss design applied to the horizontal band. Arrows and structural lines connect key sections, demonstrating the relationship between components and the overall spatial organisation. Each arrangement is clearly defined to show functional differences in structural application and form.
Vessel structure element arrangement
The image features two architectural diagrams comparing different truss configurations. On the left, the diagram displays a vessel structure occupying the triangular space between V-shaped frames, with structural lines forming angular patterns and annotations indicating design components. On the right, multiple truss arrangements are shown, including a normal truss configuration applied to the upper diagonal band and a Vierendeel truss used in the lower diagonal bands. The diagram also identifies a normal truss design applied to the horizontal band. Arrows and structural lines connect key sections, demonstrating the relationship between components and the overall spatial organisation. Each arrangement is clearly defined to show functional differences in structural application and form.Vessel structure element arrangement
5.2.4 Bearings
Bearings (Figure 21) were used at the interface between the concrete corbels on the plinths and the steel V frame structure. These bearings have spherical slip surfaces to allow rotation and displacement: any arising eccentricity affects only the structure above the bearing, not the support column below. The bearings are arranged in an inverted style, as typically done for bridge structures where bearings sit at the top of a structural pier/column. The bearings were designed to always be in compression under code-based load combinations. However, an approximate 10% of the compression load allowance for the uplift resistance of the bearings was allowed to ensure the bearings have the ability to withstand any unpredictable actions.
 The image features several large, circular metal components with layered designs, each placed individually on wooden pallets. These components are arranged neatly within a spacious industrial warehouse that has a concrete floor and wide windows in the background, allowing in natural light. The metal parts appear smooth and possibly machined, suggesting they may be used in heavy machinery or mechanical systems. Industrial equipment is seen along the edges of the room, reinforcing the impression of an active manufacturing environment.
 Spherical bearings used to support the V frame structure
The image features several large, circular metal components with layered designs, each placed individually on wooden pallets. These components are arranged neatly within a spacious industrial warehouse that has a concrete floor and wide windows in the background, allowing in natural light. The metal parts appear smooth and possibly machined, suggesting they may be used in heavy machinery or mechanical systems. Industrial equipment is seen along the edges of the room, reinforcing the impression of an active manufacturing environment. Spherical bearings used to support the V frame structure
6. Roof structure
6.1 Structural principles and geometry
The roof structure consists of a radial cable net that derives its load-carrying capacity and stiffness from a set of internal prestressing forces that are in equilibrium with the roof geometry and gravity loading. The structural system consists of tensioned radial cables spanning between the perimeter compression truss and interior tension rings (upper and lower tension rings) that form the central oculus of the roof. The upper and lower cable layers are pushed apart by spacer strut elements, which create the internal geometry of the roof (Figure 22). Additional plan bracing cables are also used to provide additional stiffness and deal with local variations in loading. The overall form of the roof structure is hyperbolic paraboloid and the geometry is derived mathematically to create a geometrically ‘pure’ form that will lead to an efficient cable structure.
 The image features three architectural diagrams related to a stadium structure. The top two diagrams represent the north-south and east-west sections, showcasing the respective frameworks with various lines representing support beams and outlines of stands. Each section has distinct blue and red lines, indicating different components of the structure. The lower section diagram shares similar features to the upper, maintaining consistency in design. The third diagram presents a top view of the stadium, displaying the arrangement of stands labelled North stand, East stand, South stand, and West stand. This circular representation includes a network of lines, indicating the framework of the stadium.
Principle roof geometry diagram
The image features three architectural diagrams related to a stadium structure. The top two diagrams represent the north-south and east-west sections, showcasing the respective frameworks with various lines representing support beams and outlines of stands. Each section has distinct blue and red lines, indicating different components of the structure. The lower section diagram shares similar features to the upper, maintaining consistency in design. The third diagram presents a top view of the stadium, displaying the arrangement of stands labelled North stand, East stand, South stand, and West stand. This circular representation includes a network of lines, indicating the framework of the stadium.Principle roof geometry diagram
6.2 Load path
Loads are collected by the membrane surfaces that span between the membrane-shaping arches and plan bracing cables. The fundamental vertical load-carrying principle is that vertical loads cause the prestressed radial cables to deflect through an angle and generate an equal and opposite reaction force. In this way, the roof responds dynamically to the applied loading for the applied load, cable geometry and internal prestress forces to reach an equilibrium condition.
Downward loading is collected from the nodes on the membrane surface by the internal strut element and transferred down into the lower cable net, which hangs as a catenary between the perimeter compression ring, with the internal tension ring compensating for the cables not being continuous from one side to the other, as shown in Figure 23(a).
 The image contains two diagrams labelled a and b showing structural systems with curved V frame configurations. In diagram a, the apex of the V frame is directed upward and is surrounded by a compression ring, a lower tension ring, and lower radial cables radiating outward from the center. Diagram b presents a downward V frame apex with an upper tension ring and upper radial cables surrounding the compression ring. Both diagrams feature applied loading illustrated by directional arrows targeting the apex. The tension rings and radial cables are illustrated as continuous components supporting the structure, forming a network around the central circular zone, representing how structural forces are distributed across the tension and compression elements.
(a) Downward force system. (b) Uplift force system
The image contains two diagrams labelled a and b showing structural systems with curved V frame configurations. In diagram a, the apex of the V frame is directed upward and is surrounded by a compression ring, a lower tension ring, and lower radial cables radiating outward from the center. Diagram b presents a downward V frame apex with an upper tension ring and upper radial cables surrounding the compression ring. Both diagrams feature applied loading illustrated by directional arrows targeting the apex. The tension rings and radial cables are illustrated as continuous components supporting the structure, forming a network around the central circular zone, representing how structural forces are distributed across the tension and compression elements.(a) Downward force system. (b) Uplift force system
The lower cable exhibits a downward drape in all directions and is therefore able to resist downward loads in pure tension, which is transferred into the perimeter compression ring. The compression ring takes the form of a box truss element that provides two types of support conditions to the radial cables. Every second cable is directly supported by the curved V frame inner chord under the lower chord of the box truss with the intermediate cables relying on the ability of the compression ring truss to transfer the resultant vertical and lateral forces over a span of approximately 36.5 m between the adjacent curved V frame apexes. The box truss arrangement of the compression ring provides excellent stiffness for the boundary condition of the cable net and two layers of utilities levels required for MEP. Uplift loading is carried out in a similar way by the upper layer cable (Figure 23(b)).
6.3 Structural components
The spoke wheel type cable net roof system, consisting of two inner tension rings and one outer compression ring truss connected by radial spokes, is the most lightweight and thus structurally efficient and economical system for large-span roofs. A complete form-finding analysis and optimisation were conducted for the stadium roof structure. The cable net roof system of Lusail Stadium consists of a range of primary element types, shown in Figure 24 and briefly described in the following sections. Typical cable profiles of primary cable net structure and design parameters are presented in Table 1.
 The image illustrates a three-dimensional structural model of an architectural framework. It features a combination of components such as a compression ring located at the top, a tension ring beneath it, and various radial and circumferential catwalks. Strut posts are positioned vertically, while radial cables extend from the tension ring to the structure's central area. The model includes intricate network detailing, showcasing how the elements connect and support each other, providing a visual representation of engineering principles in structural design. The annotations identify key components like the radial catwalk, tension ring, and strut posts, enhancing the understanding of the framework's layout.
Roof structure components
The image illustrates a three-dimensional structural model of an architectural framework. It features a combination of components such as a compression ring located at the top, a tension ring beneath it, and various radial and circumferential catwalks. Strut posts are positioned vertically, while radial cables extend from the tension ring to the structure's central area. The model includes intricate network detailing, showcasing how the elements connect and support each other, providing a visual representation of engineering principles in structural design. The annotations identify key components like the radial catwalk, tension ring, and strut posts, enhancing the understanding of the framework's layout.Roof structure components
Typical cable profile of primary cable net structure
| Cable location | Suggested cable diameter | A: mm2 | E: N/mm2 | Minimum breaking load: kN |
|---|---|---|---|---|
| Upper radial cable | SS88 (spiral strand with 88 mm dia.) | 4490 | 158000 | 7000 |
| Outer segment of upper radial cable | SS104 | 6280 | 158000 | 9780 |
| Outer segment of lower radial cable | SS124 | 8920 | 158000 | 13900 |
| Lower radial cable | SS124 | 8920 | 158000 | 13900 |
| Upper tension ring | 8 No. FLC90 | 44800 | 165000 | 64720 |
| Lower tension ring | 8 No. FLC110 | 67680 | 165000 | 97600 |
 | ||||
A is the cross-sectional area; E is the modulus of elasticity
6.3.1 Radial cables
The structural performance of the 48 radial cables is governed entirely by the interaction between the applied loading and the curvature of the cables. Therefore, the three variables – the applied loading, the curvature of the cable and the prestress forces applied to the cable net – have to be ultimately balanced to achieve the architectural impression and the structural economy for the roof structure.
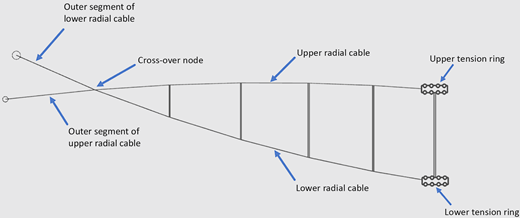
The cable net, consisting of upper and lower radial cables, crosses at the first division from the compression ring, creating a fishtail form that increases structural efficiency and stiffness. Radial cables are single lengths between the compression ring and the cross-over node and between the cross-over node and the tension ring. The upper and lower surface radial cables are held apart by vertical spacer strut elements. This arrangement maximises the performance of the lower cable net while maintaining the oculus level at an optimal position for cooling and daylighting of the stadium.
6.3.2 Tension ring cables
The radial cables are connected to an internal tension ring with both upper and lower cable nets around the oculus. The vertical spacing of the upper and lower tension ring cables is approximately 16 m. The upper and lower tension rings are spaced apart by vertical struts and vertical cross-bracing in between.
6.3.3 Bracing cables
The introduction of bracing cables within the cable net aims to provide stability and stiffness to the primary cable net structure and membrane cladding structure, respectively. The bracing cables consist of
plan bracing cables, cross-over in plan view between the adjacent upper radial cables to weave all the primary radial cables into a stable giant net and form a supporting point for the membrane-shaping arches (Figure 25(a))
vertical bracings, which cross-over in the vertical plane between adjacent upper and lower radial cables and support intermediate strut posts connected to the membrane secondary shaping arches (Figure 25(b)).
The diamond shape of the roof membrane creates the impressive and unique architectural appearance of the stadium. However, to achieve this diamond shape membrane using lightweight cables and arches also created a significant challenge to the structural engineers. The special shape of the diamond required the arch to be laid along the radial direction; however, half of the arches would have nothing to sit on, except the cross-over point of the plan bracing cables. This was structurally very unfavourable as the vertical loads from the arches had to be supported by the almost horizontal cables and, once the vertical loads from the arches increased, the cables then had to deflect a lot to create adequate curvature to achieve equilibrium. In order to achieve the architectural appearance, vertical bracing cables with additional strut posts were introduced to provide extra support for both uplift loads and downward loads at the midpoint of the secondary arches and, at the same time, maintain minimum prestress for better constructability. Figure 26 demonstrates the arrangement of the two layers of plan bracings, arches and cladding membrane system. The bracing system described above ultimately simplified the roof structure to achieve the aesthetic requirement while maintaining structural stiffness and integrity.
 The image presents a detailed technical diagram of truss structures with two distinct views labeled (a) and (b). The upper view (a) showcases a series of interconnected truss elements featuring a plan bracing cable and an additional strut for supporting arches. The lower view (b) highlights vertical and oculus bracing cables, with annotated connections that illustrate their arrangement within the structure. Various cables are depicted in different colors, indicating their specific roles, while the overall layout reflects the structural complexity of the design.
Bracing arrangement: (a) plan bracing cables; (b) vertical bracing cables
The image presents a detailed technical diagram of truss structures with two distinct views labeled (a) and (b). The upper view (a) showcases a series of interconnected truss elements featuring a plan bracing cable and an additional strut for supporting arches. The lower view (b) highlights vertical and oculus bracing cables, with annotated connections that illustrate their arrangement within the structure. Various cables are depicted in different colors, indicating their specific roles, while the overall layout reflects the structural complexity of the design.Bracing arrangement: (a) plan bracing cables; (b) vertical bracing cables
 This image presents a three-dimensional model of a structural design, showcasing various components such as roof-shaping arches, membrane cladding, and circumferential vertical cross-bracings. Each element is clearly labeled to indicate their specific functions, such as an additional strut post supported by the intersection point of vertical cross-bracings. The structure features a combination of framework and membrane elements, emphasizing connectivity and load distribution. The design incorporates a variety of linear and angular elements, emphasizing structural integrity, and is depicted from a perspective that highlights its three-dimensional form.
Arrangement of plan bracings, arches and membrane
This image presents a three-dimensional model of a structural design, showcasing various components such as roof-shaping arches, membrane cladding, and circumferential vertical cross-bracings. Each element is clearly labeled to indicate their specific functions, such as an additional strut post supported by the intersection point of vertical cross-bracings. The structure features a combination of framework and membrane elements, emphasizing connectivity and load distribution. The design incorporates a variety of linear and angular elements, emphasizing structural integrity, and is depicted from a perspective that highlights its three-dimensional form.Arrangement of plan bracings, arches and membrane
6.3.4 Strut posts
Vertical strut posts are located at each cable intersection along the radial cables. These posts are tubular steel elements that push the upper and lower layer cable net apart and prop between the two cable nets to transfer loads between the two surfaces.
6.3.5 Cable connections
As the roof is a tension structure, it relies fundamentally on the geometry of the cable elements within it to generate load-carrying capacity and stiffness. Compared with a traditional rigid structural system, the roof cable net structure will sustain relatively larger deflections and high non-linear structural performance. This requires the connections to both connect the cables and to be able to generate local deflection of the cables to counteract angle changes. Figures 27–30 demonstrate the designs of several connections in detail.
 The image presents two three-dimensional diagrams of a mechanical assembly. The left diagram displays several interconnected structural components labeled as C R I B, C R L C, and C R S B, all integrated into a framework that resembles pipework or structural supports. The right diagram mirrors the left but includes additional labeled elements such as upper radial cable and C V F I C, showing a more complete view of the upper assembly. Both diagrams offer distinct orientations that highlight the spatial arrangement and interaction of each labeled part, aiding in the visual comprehension of the mechanical system's construction and function.
Radial cable to compression ring connection. CRILC, compression ring inner lower chord; CRSB, compression ring side brace; CRIB, compression ring inner brace
The image presents two three-dimensional diagrams of a mechanical assembly. The left diagram displays several interconnected structural components labeled as C R I B, C R L C, and C R S B, all integrated into a framework that resembles pipework or structural supports. The right diagram mirrors the left but includes additional labeled elements such as upper radial cable and C V F I C, showing a more complete view of the upper assembly. Both diagrams offer distinct orientations that highlight the spatial arrangement and interaction of each labeled part, aiding in the visual comprehension of the mechanical system's construction and function.Radial cable to compression ring connection. CRILC, compression ring inner lower chord; CRSB, compression ring side brace; CRIB, compression ring inner brace
 The image displays two mechanical designs side by side, illustrating intricate connections among rods and joints within a structural assembly. The left design features several rods connected with angular joints, while the right shows a different configuration of joints and rod placements. Both designs feature detailed representations of the components, offering a view of how they interact mechanically. The rods vary in positioning, suggesting different functional or structural roles. The focus is on the assembly process, highlighting the complexity and precision involved in the designs.
Radial cable to lower tension ring connection
The image displays two mechanical designs side by side, illustrating intricate connections among rods and joints within a structural assembly. The left design features several rods connected with angular joints, while the right shows a different configuration of joints and rod placements. Both designs feature detailed representations of the components, offering a view of how they interact mechanically. The rods vary in positioning, suggesting different functional or structural roles. The focus is on the assembly process, highlighting the complexity and precision involved in the designs.Radial cable to lower tension ring connection
 The image features two perspectives of a mechanical assembly, showcasing several rods aligned horizontally, connected by joints. The left view presents the assembly from one angle, revealing details of the joints and attachment points, while the right view offers a different angle, emphasizing the arrangement of the rods and some structural elements. Key components include a solid base with connections for the rods, showing how the assembly is interlinked. The mechanically designed parts suggest functionality, likely intended for engineering purposes or robotics, and highlight intricate design details for operational use.
Radial cable to upper tension ring connection
The image features two perspectives of a mechanical assembly, showcasing several rods aligned horizontally, connected by joints. The left view presents the assembly from one angle, revealing details of the joints and attachment points, while the right view offers a different angle, emphasizing the arrangement of the rods and some structural elements. Key components include a solid base with connections for the rods, showing how the assembly is interlinked. The mechanically designed parts suggest functionality, likely intended for engineering purposes or robotics, and highlight intricate design details for operational use.Radial cable to upper tension ring connection
 The image features two three-dimensional models of mechanical components. On the left, there is a more complex assembly, showcasing multiple interconnected parts, including joints and rods. The model appears to represent a system that may involve motion or articulation, with visible connectors highlighted in green. On the right, a simpler component is presented, featuring two circular holes and a more streamlined design, likely intended for connection or fastening. The models are illustrated in technical style, indicating their mechanical characteristics and potential applications in engineering or manufacturing contexts.
Radial cable cross-over node connection
The image features two three-dimensional models of mechanical components. On the left, there is a more complex assembly, showcasing multiple interconnected parts, including joints and rods. The model appears to represent a system that may involve motion or articulation, with visible connectors highlighted in green. On the right, a simpler component is presented, featuring two circular holes and a more streamlined design, likely intended for connection or fastening. The models are illustrated in technical style, indicating their mechanical characteristics and potential applications in engineering or manufacturing contexts.Radial cable cross-over node connection
6.3.6 Membrane
A PTFE membrane cladding system was adopted for the roof, which covered all the seats to provide shading for spectators. This membrane cladding system was supported and formed by the roof's secondary arches and the plan bracing cables, which act as the skeleton of the membrane and generate the final diamond-type pattern to the membrane surface (Figure 31).
 The image presents two complex geometric structures resembling mathematical surfaces. On the left, a circular form is depicted with a flat center and radiating layers, featuring a pattern that combines red lines with a white background in a delicate, wave-like configuration. The right structure resembles a thicker, more pronounced shape with a similar circular outline and layered appearance, exhibiting a repeating pattern of interlocking geometries.
Roof cladding structure plan and 3D view
The image presents two complex geometric structures resembling mathematical surfaces. On the left, a circular form is depicted with a flat center and radiating layers, featuring a pattern that combines red lines with a white background in a delicate, wave-like configuration. The right structure resembles a thicker, more pronounced shape with a similar circular outline and layered appearance, exhibiting a repeating pattern of interlocking geometries.Roof cladding structure plan and 3D view
7. Analytical workflow and analysis methodology
Adopting a spoke-like cable net system, the roof was a complex structure that exhibited strong non-linearity and required a well-developed comprehensive process to fulfil both the architectural aesthetics and structural efficiency. This process involved modelling, form-finding, non-linear analysis and, eventually, detailed design of the roof structure, as illustrated in Figure 32. The following sections provide more detail.
 The flowchart shows a structured design process through four vertically aligned stages. It begins with parametric modelling of starting geometry, positioned at the top, which initiates the workflow. Directly beneath it is form-finding analysis, followed by non-linear analysis, and finally, the design stage concludes the sequence. Each stage is linked by a downward-pointing arrow, reinforcing the logical and sequential order of the process. The flowchart presents the steps in a clear and uncluttered format, guiding the viewer through each essential phase of the design methodology without additional visual distractions.
Analytical workflow for roof structure
The flowchart shows a structured design process through four vertically aligned stages. It begins with parametric modelling of starting geometry, positioned at the top, which initiates the workflow. Directly beneath it is form-finding analysis, followed by non-linear analysis, and finally, the design stage concludes the sequence. Each stage is linked by a downward-pointing arrow, reinforcing the logical and sequential order of the process. The flowchart presents the steps in a clear and uncluttered format, guiding the viewer through each essential phase of the design methodology without additional visual distractions.Analytical workflow for roof structure
7.1 Generation of roof structure starting geometry
The generation of the structural roof geometry was the foundation of the entire design process. A parametric modelling program was developed using mathematical formulae, by which the coordinates of the master nodes and the topology could be generated directly. The structural geometry data could be exported automatically for the subsequent form-finding analysis. In the design process, the roof geometry needed to be regenerated over and over again due to architectural considerations; the regeneration was performed quickly by the parametric modelling program, allowing time during each iteration for interrogation of the analytical results to draw conclusions about the performance of the roof and guide decisions on how to increase efficiency.
The guiding geometry of the roof was that of a hyperbolic paraboloid. This form of geometry utilises a circular perimeter to create an internal saddle-shaped surface. The surface defines the upper boundary of the cable net structure as the nodes must not protrude from the surface in order to offer support for the roof cladding from below.
The fundamental process of roof geometry generation comprised the following steps (Figure 33).
Separate paraboloid edge curves were generated for the roof’s external perimeter and tension ring. Each of these curves was divided into 48 segments to create the master nodes on the external perimeter and tension ring upon which the rest of the roof was built.
The upper radial curves of the crossing fishtail profile cables, defined by a set of arcs, were generated between the master nodes on the lower external perimeter and upper tension ring. The master nodes on these curves were created simultaneously based on mathematical principles. The locations of these master nodes would remain fixed during the form-finding analysis as they were directly relevant to the shape of the roof cladding.
The lower radial curves of the crossing fishtail profile cables were generated between the master nodes on the upper external perimeter and lower tension ring with indicative curvature. The only constraint was that the curves should pass the cross-over nodes, which were among the master nodes on the upper radial curves. The master nodes on the lower radial curves could then be created as their horizontal coordinates were assigned to be the same as the corresponding master nodes on the upper radial curves. The form-finding analysis would modify the starting vertical coordinates of the master nodes on the lower radial curves and the lower tension ring, which did not affect the geometry of the roof cladding.
The structural elements of the roof's primary structure, including tension rings, radial cables and strut posts, were then assembled according to the topology.
The structural elements of the roof's secondary structure, including bracing cables, membrane-shaping arches, oculus canopy and so on were then assembled in defined patterns.
 The image presents a four-part diagram showcasing parabolic structures. The top-left section features paraboloid edge curves, indicated by a red outline. The top-right segment illustrates upper and lower radial curves patterns, characterized by intersecting lines forming a three-dimensional appearance. The bottom-left displays the roof primary structure, with the same red outline enveloping the inner radial framework. Finally, the bottom-right part depicts the global roof structure, exhibiting a more complex interplay of intersecting lines that form a comprehensive three-dimensional shape. Each segment is labeled with descriptive text that identifies its specific structure.
Generation of roof structure starting geometry
The image presents a four-part diagram showcasing parabolic structures. The top-left section features paraboloid edge curves, indicated by a red outline. The top-right segment illustrates upper and lower radial curves patterns, characterized by intersecting lines forming a three-dimensional appearance. The bottom-left displays the roof primary structure, with the same red outline enveloping the inner radial framework. Finally, the bottom-right part depicts the global roof structure, exhibiting a more complex interplay of intersecting lines that form a comprehensive three-dimensional shape. Each segment is labeled with descriptive text that identifies its specific structure.Generation of roof structure starting geometry
7.2 Form-finding analysis
Once the starting geometry of the roof structure was established, the geometry database, including the coordinates of the master nodes and the topology, was then transferred to the next step of the process to allow the form-finding analysis to be carried out.
The goal of the form-finding analysis was to find an updated geometry relative to the roof structure starting geometry for subsequent non-linear analysis, which was in equilibrium with the self-weight of the roof. Only the vertical coordinates of the master nodes on lower radial cables and lower tension ring were modified during the form-finding analysis, leaving the rest of the geometry data unchanged to keep the strut posts vertical throughout the process and not produce any potential conflict between the cable net structure and the predetermined shape of the roof cladding.
The applied prestress forces in the cable structure were adjusted simultaneously such that only very slight deformation would occur under the self-weight of the roof; that is, the geometries of the zero state and the initial state of the cable net were almost identical, providing remarkable convenience for both the rest of the design process and the construction procedure.
The results of form-finding were particularly sensitive to the self-weight of the roof structure, so the form-finding process had to pass through several complete stages before the results were reliable. At the end of each stage, the geometry data were updated to the results of the previous stage and the whole cycle was then repeated until no significant changes were apparent between the stages.
7.3 Non-linear analysis
Once the form-finding process was complete, the roof had a different shape compared with the starting position, with a specific set of internal prestress forces. This model now represented the at-rest equilibrium roof structure, which was in balance with its self-weight, and upon which the effect of any additional applied loading could be assessed.
Non-linear analysis was mandatory in the design of the cable net structure as the deflections were significant in carrying the applied loading, which also meant that the linear superposition of results from separate load cases was no longer valid and a full analysis run had to be carried out for each combination being considered.
Figure 34 shows a typical set of non-linear analysis results. The results of these non-linear analysis cases were then used as the basis for the design of the roof cable net structure.
 The image features a three-dimensional mesh plot illustrating a surface with an oval opening at the centre. The mesh is composed of interconnected points represented in a gradient of colours that likely indicate varying displacement values. Notable annotations indicate maximum and minimum values for vertical displacement, M X, which represents maximum, and M N for minimum. The plot includes a colour bar at the bottom, detailing numerical ranges associated with the mesh's elevation points, while labels in the upper part provide additional context concerning the nodal solution parameters like step and time. The overall layout supports visualisation of displacement across the mesh in a spatial context.
Typical set of non-linear analysis results
The image features a three-dimensional mesh plot illustrating a surface with an oval opening at the centre. The mesh is composed of interconnected points represented in a gradient of colours that likely indicate varying displacement values. Notable annotations indicate maximum and minimum values for vertical displacement, M X, which represents maximum, and M N for minimum. The plot includes a colour bar at the bottom, detailing numerical ranges associated with the mesh's elevation points, while labels in the upper part provide additional context concerning the nodal solution parameters like step and time. The overall layout supports visualisation of displacement across the mesh in a spatial context.Typical set of non-linear analysis results
8. Accuracy control and construction sequence
As per the specification, some of the requirements regarding accuracy were
permitted tolerance of ±20 mm on the centre of pinhole of the cable connecting node plate at the compression ring inner upper chord
permitted tolerance of ±25 mm for any other node position of the steel structure
±50 mm in plan for each system point of the tension ring
±120 mm in height for each system point of the tension ring
±10% of the tension force in the radial cables which were directly connected to the compression ring during the construction stage
±0.6 kN/m of the 4 kN/m design prestress of the roof membrane.
For the scale of this project, it was very challenging to achieve those accuracy requirements, especially with a limited construction duration. There was no chance to fabricate the membrane and facade based on the as-built geometry to adapt the deviation. All the construction work needed to be carried out immediately once the work front was open. All the elements had to be fabricated following issued for construction (IFC) geometry, and then had to be assembled properly.
To achieve the required accuracy, the following steps were taken.
A detailed and accurate software simulation and sensitivity analysis of the construction process was developed.
The construction sequence was decided on the simulation and analyses results.
The accuracy during construction was controlled in stages. Each stage had built-on mechanisms to adapt and consume any tolerance deviations from the previous stage.
This was achieved by adding a series of adjustable connections that were designed to accommodate tolerance deviations and hence avoid their accumulation as the construction progressed.
8.1 Software simulation and sensitivity analysis
A detailed construction simulation, using non-linear analysis, was conducted by specialist subcontractors. The forward iteration method and Midas Gen software were used to analyse the process of the steel structure installation. All the changes to structures (stiffness, mass, loading, boundary conditions etc.) were considered. In any particular analysis, for newly added structures, the stiffness and mass were added to the structure in an unstressed state. For removed structures, the stiffness and mass were removed from the structure immediately.
The backward iteration method and Ansys software were used to analyse the process of the roof structure, including the roof membrane, canopy, arches, secondary cable net, catwalk, primary cable net and other miscellaneous components hanging from the roof. Based on the simulation, the processes for the steel structure and the roof structure were divided into eight stages
V frame installation
compression ring installation
vessel truss V segment installation
temporary support tower de-propping
vessel truss A segment installation
primary cable system installation
secondary cable system and arch installation
roof membrane installation.
Seven points on the outer chord of the V frame and compression ring (see Figure 35) were selected to conduct the geometry sensitivity analysis. As an example, the movements of the east–west section are presented in Table 2, in which R = movement in the radial direction (positive direction towards the pitch), C = movement in the circumferential direction (positive direction is clockwise) and Z = movement in the vertical direction (positive direction is up).
 This aerial image shows a sprawling construction site with numerous cranes and heavy machinery actively engaged in building a large structure. The site is centred around a partially constructed circular stadium-like shape, surrounded by earth and building materials. In the background, a vibrant city skyline emerges, highlighting a contrast between the developed area and the ongoing construction. The landscape is predominantly sandy, with roads and equipment scattered throughout the scene, illustrating a dynamic construction environment at dusk or dawn, as suggested by the soft lighting in the sky.
Selected points for the geometry sensitivity analysis
This aerial image shows a sprawling construction site with numerous cranes and heavy machinery actively engaged in building a large structure. The site is centred around a partially constructed circular stadium-like shape, surrounded by earth and building materials. In the background, a vibrant city skyline emerges, highlighting a contrast between the developed area and the ongoing construction. The landscape is predominantly sandy, with roads and equipment scattered throughout the scene, illustrating a dynamic construction environment at dusk or dawn, as suggested by the soft lighting in the sky.Selected points for the geometry sensitivity analysis
Directions and magnitudes of movement of the east–west section in each stage (simulation data)
| Direction | Movement: mm | ||||||||
|---|---|---|---|---|---|---|---|---|---|
| Stage 1 | Stage 2 | Stage 3 | Stage 4 | Stage 5 | Stage 6 | Stage 7 | Stage 8 | Total (stages 1–8) | |
| Point ① | |||||||||
| R | — | −18.9 | −0.7 | −14.4 | −1.3 | 52.5 | 14.2 | 1.4 | 32.8 |
| C | — | 2.3 | 0 | 0.1 | 0 | 0 | 0 | 0 | 2.4 |
| Z | — | −12.3 | −0.9 | −19.2 | −1.6 | 24.4 | 3.4 | 0.7 | −5.5 |
| Point ② | |||||||||
| R | — | −17.7 | −0.8 | −17.8 | −1.4 | 45.2 | 8.8 | 1.1 | 17.4 |
| C | — | 2.2 | 0 | −0.1 | 0 | 0 | 0 | 0 | 2.1 |
| Z | — | −11.6 | −0.9 | −19.3 | −1.6 | 23.6 | 3.1 | 0.7 | −6 |
| Point ③ | |||||||||
| R | −23 | −15 | −1 | −24 | −2 | 32 | 3 | 0.9 | −6.1 |
| C | 14 | −2 | 0 | −2 | 0 | 0 | 0 | 0 | −4 |
| Z | −21 | −9 | −1 | −19 | −2 | 21 | 2 | 0.6 | −7.4 |
| Point ④ | |||||||||
| R | −15 | −11 | −1 | −24 | −2 | 19 | −1 | 0.6 | −19.4 |
| C | 42 | 0 | 0 | −2 | 0 | −1 | 0 | 0 | −3 |
| Z | −30 | −9 | −1 | −20 | −2 | 17 | 0 | 0.5 | −14.5 |
| Point ⑤ | |||||||||
| R | −11 | −9 | −1 | −22 | −2 | 14 | −2 | 0.4 | −21.6 |
| C | 36 | 1 | 0 | −2 | 0 | −1 | 0 | 0 | −2 |
| Z | −26 | −8 | −1 | −19 | −2 | 14 | −1 | 0.4 | −16.6 |
| Point ⑥ | |||||||||
| R | −7 | −6 | −1 | −17 | −1 | 8 | −2 | 0.3 | −18.7 |
| C | 25 | 1 | 0 | −2 | 0 | −1 | 0 | 0 | −2 |
| Z | −20 | −7 | −1 | −18 | −2 | 11 | −2 | 0.4 | −18.6 |
| Point ⑦ | |||||||||
| R | −4 | −3 | 0 | −9 | −1 | 4 | −1 | 0.1 | −9.9 |
| C | 10 | 1 | 0 | −1 | 0 | 0 | 0 | 0 | 0 |
| Z | −11 | −6 | −1 | −14 | −1 | 8 | −2 | 0.3 | −15.7 |
The simulation data revealed the following.
The V frame movement in stage 1 was significant due to self-weight and weak out-of-plane stiffness. This movement could be managed by pre-camber.
Considering the movement of stage 1 could be eliminated by pre-camber, the accumulative movement from stages 2 to 8 could then be evaluated to decide the timing of the facade installation and to design the adjustability of the facade bracket.
After installation of the compression ring was complete, the impact of the vessel truss was very minor. In contrast, the impact of the primary cable installation was very significant.
After the primary cable was installed and pre-tensioned, the impact of the secondary roof structure and membrane was minor.
Considering economic efficiency, the adjustability of the facade brackets could not be too large. As such, the facade below point ② in Figure 35 could be installed before stage 6. The facade above point ② could be installed after stage 6, which was the completion of primary cable tensioning.
8.2 Accuracy control strategy for each stage
The final target of accuracy control was to guarantee that the facade and roof membrane could be installed smoothly. To achieve that, the geometry of the steel structure, including the cable nodes and arches, needed to be within the tolerances specified. The cable forces were also critical because they related to the safety and stiffness of the roof structure.
8.2.1 Stage 1: V frame installation
In total, 48 pieces of V frame were installed on spherical bearings and supported by temporary towers (see Figure 36) sequentially. According to the simulation, the out-of-plane stiffness of the V frame was relatively small; in addition, when the deformation of the temporary tower was taken into account, the biggest deformation during the installation of a single V frame was calculated to be 74 mm, located at the middle of the V frame.
 The image depicts a structural cross-section of a building, illustrating various components such as stairways and supporting beams. The diagram includes labels for specific elements, numbered one to seven, which may refer to key structural features or connections. The stairway on the left side has a series of steps, while the right displays a curved framework, suggesting complex architectural design. The drawing uses a simplified representation to convey structural relationships and positions within the building's layout without providing additional decorative details or textures.
Installation of the V frame on the spherical bearing and temporary support tower
The image depicts a structural cross-section of a building, illustrating various components such as stairways and supporting beams. The diagram includes labels for specific elements, numbered one to seven, which may refer to key structural features or connections. The stairway on the left side has a series of steps, while the right displays a curved framework, suggesting complex architectural design. The drawing uses a simplified representation to convey structural relationships and positions within the building's layout without providing additional decorative details or textures.Installation of the V frame on the spherical bearing and temporary support tower
To consume this deformation, pre-camber was introduced during the V frame assembly. The value of the pre-camber was based on the deformation value during the simulation. Instead of the IFC coordinates, the simulated coordinates of installing each single V frame were used as the inspection target during construction.
8.2.2 Stage 2: Compression ring installation
The compression ring was divided into 24 segments (Figure 37). The perimeter of the compression ring was about 1 km and, as such, the temperature effect was significant. Based on the simulation analysis, four closure segments were designed in four corner zones. As in stage 1, the simulated coordinates of installing each segment of the compression ring were used as the target. The pinholes of the cable connection plate on the compression ring were used as geometry control points.
 The image shows an aerial view of a large sports stadium under construction. The structure features an intricate design with an open roof and is surrounded by multiple construction cranes. The surrounding area is a construction site, with various building materials and vehicles visible on the ground. The landscape appears to be primarily barren, indicating ongoing development activities, with additional buildings under construction in the background. The overall scene illustrates a significant infrastructure project in progress.
Installation of the compression ring
The image shows an aerial view of a large sports stadium under construction. The structure features an intricate design with an open roof and is surrounded by multiple construction cranes. The surrounding area is a construction site, with various building materials and vehicles visible on the ground. The landscape appears to be primarily barren, indicating ongoing development activities, with additional buildings under construction in the background. The overall scene illustrates a significant infrastructure project in progress.Installation of the compression ring
8.2.3 Stage 3: Vessel truss V segment installation
According to the simulation analysis, the circumferential stiffness of the V frame was relatively small. It could be enhanced by installing the vessel truss V segments, which was not impacted by the temporary support tower before de-propping. Structural safety could also be improved during the de-propping process. The sequence of vessel truss installation could be flexible since the deformation caused by the vessel truss was very minor.
The accuracy of vessel truss installation directly impacted the accuracy of the facade bracket installation, which in turn impacted the facade installation. To accommodate part of the tolerance deviation from stages 1 and 2, the coordinates of the ball connections (Figure 38) were controlled as per the simulated coordinates in stage 3. The angle of the truss elements was adjusted during ground assembly based on the simulated coordinates of the ball connections and the as-built coordinates of the connections to the compression ring and V frame (Figure 38).
 The image depicts a three-dimensional diagram of a structural framework, illustrating the connections within the model. The outer perimeter displays various support structures, with arrows indicating specific connections to the compression ring, V frame, and ball connections in an inset section. The diagram utilizes clear line work and annotations to detail key elements of the framework, which assist in understanding the structural integrity and design of the assembly.
Installation of the Vessel truss V segment
The image depicts a three-dimensional diagram of a structural framework, illustrating the connections within the model. The outer perimeter displays various support structures, with arrows indicating specific connections to the compression ring, V frame, and ball connections in an inset section. The diagram utilizes clear line work and annotations to detail key elements of the framework, which assist in understanding the structural integrity and design of the assembly.Installation of the Vessel truss V segment
8.2.4 Stage 4: Temporary support tower de-propping
The de-propping sequence was decided based on sensitivity analysis of the structure. The geometry changes were monitored throughout and no accuracy control was required.
8.2.5 Stage 5: Vessel truss a segment installation
The same principle of stage 3 was followed. After this stage, the steel structure installation was completed.
8.2.6 Stage 6: Primary cable system installation
Before the primary cable tensioning, the as-built coordinates of the pinholes of the cable connection plates on the compression ring were surveyed and compared with the simulated coordinates at the end of stage 5 to understand the deviation of the pinhole in the previous five stages. The cable lengths of the outer segments of the upper and lower radial cable were adjusted to consume the deviations. All the deviations were kept in the part between the compression ring and the cross-over nodes. The theoretical locations of the cross-over nodes and all the elements between the cross-over nodes and tension rings would not be impacted by the as-built deviations. After the primary cable was tensioned, the cable forces of the outer segment of the upper and lower radial cable were checked and adjusted to meet the tolerance requirements.
8.2.7 Stage 7: Secondary cable system and arch installation
Before starting stage 7, the as-built coordinates of the tension ring cable nodes and the secondary cable connection plate on the compression ring were surveyed and compared with the simulated coordinates to understand the deviations in the previous six stages. The secondary cable length of the innermost ring was adjusted based on the deviation of tension ring cable nodes, and the outermost ring was adjusted based on the deviation of the compression ring (see Figure 39) so the deviations were consumed by those two rings and the designed geometry of the parts in between could be maintained. The arches of the innermost ring and the outermost ring were fabricated according to the as-built geometry. The duration of secondary cable installation was used to fabricate the arches, without impacting the schedule.
 The image displays a circular diagram featuring a central blank area surrounded by a series of triangular patterns. The outer edge of the circle is lined with labels representing various codes, ranging from R 001 to R 024, including associated variants (e.g., R 001 A, R 002 A). The triangular shapes surrounding the inner circle create a distinct jagged perimeter. Overall, the diagram emphasizes a radial layout, structured for clarity and organisation of the labeled elements around the central space.
Inner ring and the outermost ring of the secondary cables
The image displays a circular diagram featuring a central blank area surrounded by a series of triangular patterns. The outer edge of the circle is lined with labels representing various codes, ranging from R 001 to R 024, including associated variants (e.g., R 001 A, R 002 A). The triangular shapes surrounding the inner circle create a distinct jagged perimeter. Overall, the diagram emphasizes a radial layout, structured for clarity and organisation of the labeled elements around the central space.Inner ring and the outermost ring of the secondary cables
8.2.8 Stage 8: Roof membrane installation
Deviations were mainly in the inner ring and the outer ring. The membrane connections to the tension ring and compression ring were designed to have enough adjustability to adapt to those deviations. For other locations, the adjustability of the connections could be designed smaller in order to save cost but big enough to guarantee the membrane prestress could be achieved.
8.3 Final accuracy achieved
Figure 40 shows a comparison of the actual deformations achieved on-site during the de-propping stage (stage 4) and the simulated values. In the figure, the green values (on the outside of the ring) are the theoretical deflections and the red values (inside the ring) are the actual deformations. The actual values matched the simulated values very well, and the maximum difference was only 7 mm.
 The image features three circular diagrams that present deflection measurements in millimetres, each focusing on a different directional axis: radial, circumferential, and vertical. Each diagram is divided into eight numbered zones encircling a central structure, with numerical deflection values displayed near the perimeter of each zone. These values are distributed evenly around the circles, providing a spatial representation of deflection magnitudes at specific locations. Structural lines separate the zones clearly, and small green circles serve as reference points for measurement positions. The diagrams are arranged from left to right, beginning with radial deflection, followed by circumferential deflection, and ending with vertical deflection, offering a comprehensive overview of displacement characteristics across the structure.
Comparison of simulated movements and actual movements during de-propping
The image features three circular diagrams that present deflection measurements in millimetres, each focusing on a different directional axis: radial, circumferential, and vertical. Each diagram is divided into eight numbered zones encircling a central structure, with numerical deflection values displayed near the perimeter of each zone. These values are distributed evenly around the circles, providing a spatial representation of deflection magnitudes at specific locations. Structural lines separate the zones clearly, and small green circles serve as reference points for measurement positions. The diagrams are arranged from left to right, beginning with radial deflection, followed by circumferential deflection, and ending with vertical deflection, offering a comprehensive overview of displacement characteristics across the structure.Comparison of simulated movements and actual movements during de-propping
According to the as-built survey before stage 6, most of the cable connection plates on the compression ring were within the ±25 mm tolerance. The biggest deviation in the radial direction was 50 mm, which was within the 124 mm adjustability of cable length.
An as-built survey was done after the stage 6 (see Figure 41). The maximum horizontal deviation in the tension ring was 32 mm, which was within the 50 mm tolerance. The deviation of the cross-over nodes (in green) was controlled within 25 mm, which meant the cable length adjustment to consume the compression ring deviation (in light blue) was successful.
 The diagram presents a structured circular layout with consecutively numbered points evenly spaced along the outer ring. Each point is marked by a blue dot enclosed in a green circle, representing individual data entries from three distinct sets: A S BUILT_c r u, A S BUILT_t r u, and A S BUILT_c j. Between the points are grey rectangular boxes containing numerical values corresponding to those positions. Lines extend from these perimeter points toward the central blank area, establishing a radial connection for each data point. The diagram maintains symmetrical spacing and clockwise orientation, creating a cohesive view of how data is distributed across the circular framework while integrating multiple data types in one unified display.
Comparison of simulated and actual geometry of cable nodes after stage 6
The diagram presents a structured circular layout with consecutively numbered points evenly spaced along the outer ring. Each point is marked by a blue dot enclosed in a green circle, representing individual data entries from three distinct sets: A S BUILT_c r u, A S BUILT_t r u, and A S BUILT_c j. Between the points are grey rectangular boxes containing numerical values corresponding to those positions. Lines extend from these perimeter points toward the central blank area, establishing a radial connection for each data point. The diagram maintains symmetrical spacing and clockwise orientation, creating a cohesive view of how data is distributed across the circular framework while integrating multiple data types in one unified display.Comparison of simulated and actual geometry of cable nodes after stage 6
As a result of careful accuracy control during the seven stages, the accuracy of the membrane steel boundaries was also well controlled. The designed prestress of the membrane was successfully achieved. The adjustable membrane connections to the secondary cable also helped adapt the camber of the cable due to the tension of the membrane (see Figure 42). The straightness of the membrane valley line was maintained to guarantee smooth water drainage.
 The image shows a close-up of a canopy structure, highlighting the interwoven fabric sections that form an overhead covering. The design includes multiple beams and support poles, connecting various fabric panels. The fabric appears taut and is arranged in curved lines, creating a dynamic visual effect. Metal clips are seen securing the fabric to the framework, while exposed wires and structural elements further emphasize the architectural design. The overall appearance suggests a durable and functional outdoor shelter.
The secondary cable camber is adapted by the adjustable membrane connection
The image shows a close-up of a canopy structure, highlighting the interwoven fabric sections that form an overhead covering. The design includes multiple beams and support poles, connecting various fabric panels. The fabric appears taut and is arranged in curved lines, creating a dynamic visual effect. Metal clips are seen securing the fabric to the framework, while exposed wires and structural elements further emphasize the architectural design. The overall appearance suggests a durable and functional outdoor shelter.The secondary cable camber is adapted by the adjustable membrane connection
9. Conclusion
The design and construction of the magnificent Lusail Stadium, the centrepiece of the FIFA World Cup Qatar 2022 tournament, was a major engineering challenge. The complex geometry and nature of the roof, the curvilinear vessel structure coupled with the tight construction schedule and installation tolerances were some of the challenges that needed to be tackled. The design and construction teams employed cutting-edge technology along with the use of an observational approach to efficiently design and safely build the stadium.
Acknowledgements
The authors are very grateful for the cooperation and support received from Mr Deng Xuyang of the Beijing Institute of Architectural Design and The Supreme Committee for Legacy and Delivery throughout the process of writing this paper. The effort and support of engineers Hilal Al-Kuwari, Othman Zarzour and Tamim El-Abed is particularly acknowledged.
