
1-20 of 20805
Keywords: ORNAMENTAL
Close
Follow your search
Access your saved searches in your account
Would you like to receive an alert when new items match your search?
Journal

Essential reading on the design and construction of civil engineering structures and its associated applied research.
Journal Articles
Proceedings of the Institution of Civil Engineers - Structures and Buildings 1–15.
Published: 14 September 2026
in Novel demountable embedded bolted shear connectors in steel–concrete composite beams
> Proceedings of the Institution of Civil Engineers - Structures and Buildings
Published: 14 September 2026
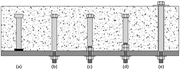
Figure 1. Types of shear connectors in steel–concrete composite beams: (a) welded stud; (b) bolts without embedded nuts; (c) bolts with single-embedded nuts; (d) bolts with double-embedded nuts; (e) friction-grip bolts Illustration of a series of bolts attached to a concrete structure, labelled... More about this image found in Types of shear connectors in steel–concrete composite beams: (a) welded stu...
in Novel demountable embedded bolted shear connectors in steel–concrete composite beams
> Proceedings of the Institution of Civil Engineers - Structures and Buildings
Published: 14 September 2026
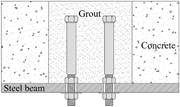
Figure 2. The steel–concrete composite connection where single-nut embedded bolted shear connectors are applied and grouted A schematic of two bolted shear connectors shows grout surrounding the connectors above a steel beam within concrete. The schematic shows a steel beam along the bottom wi... More about this image found in The steel–concrete composite connection where single-nut embedded bolted sh...
in Novel demountable embedded bolted shear connectors in steel–concrete composite beams
> Proceedings of the Institution of Civil Engineers - Structures and Buildings
Published: 14 September 2026
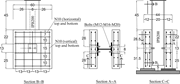
Figure 3. Geometric details of test specimens (dimensions in cm) Three sectional drawings show the reinforced concrete and I P B 200 steel beam connection with bolts, reinforcement, supports, and dimensions. Three technical drawings are labelled Section B B, Section A A, and Section C C. Secti... More about this image found in Geometric details of test specimens (dimensions in cm) Three sectional d...
in Novel demountable embedded bolted shear connectors in steel–concrete composite beams
> Proceedings of the Institution of Civil Engineers - Structures and Buildings
Published: 14 September 2026
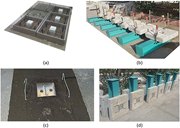
Figure 4. Preparation of push-out specimens: (a) concrete slab formworks during concreting; (b) assembly of push-out specimens; (c) bolts fastened inside these holes for testing; (d) push-out specimens prepared for testing Four views document preparation and assembly stages of reinforced concre... More about this image found in Preparation of push-out specimens: (a) concrete slab formworks during concr...
in Novel demountable embedded bolted shear connectors in steel–concrete composite beams
> Proceedings of the Institution of Civil Engineers - Structures and Buildings
Published: 14 September 2026
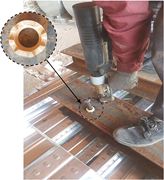
Figure 5. Welding studs to the steel beam flange A worker uses a handheld installation tool on a steel plate, with an inset highlighting the circular fitting around the installed fastener. The worker operates a handheld installation tool vertically over a steel plate while wearing a protective... More about this image found in Welding studs to the steel beam flange A worker uses a handheld installa...
in Novel demountable embedded bolted shear connectors in steel–concrete composite beams
> Proceedings of the Institution of Civil Engineers - Structures and Buildings
Published: 14 September 2026
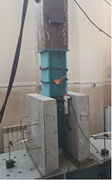
Figure 6. Push-out test set-up Two views of a laboratory push-out test setup show a steel section between concrete slabs, with chains, sensors, and a loading actuator. Panel a presents the specimen from the side. A vertical steel section stands between two concrete slabs marked P T 11. Chains... More about this image found in Push-out test set-up Two views of a laboratory push-out test setup show...
in Novel demountable embedded bolted shear connectors in steel–concrete composite beams
> Proceedings of the Institution of Civil Engineers - Structures and Buildings
Published: 14 September 2026
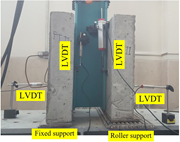
Figure 7. Location of linear variable differential transformers (LVDTs) in the test set-up A laboratory push-out test setup shows two concrete slabs beside a steel section, with four L V D T sensors and fixed and roller supports. The laboratory push-out test setup contains two vertical concret... More about this image found in Location of linear variable differential transformers (LVDTs) in the test s...
in Novel demountable embedded bolted shear connectors in steel–concrete composite beams
> Proceedings of the Institution of Civil Engineers - Structures and Buildings
Published: 14 September 2026
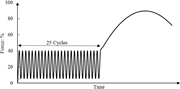
Figure 8. Push-out test loading protocol according to Eurocode 4 ( BSI, 2004 ) A force versus time graph shows 25 repeated loading cycles between about 5 and 40 per cent, followed by loading to a peak near 90 per cent. The graph plots Force in per cent on the vertical axis against Time on the ... More about this image found in Push-out test loading protocol according to Eurocode 4 ( BSI, 2004 ) A f...
in Novel demountable embedded bolted shear connectors in steel–concrete composite beams
> Proceedings of the Institution of Civil Engineers - Structures and Buildings
Published: 14 September 2026
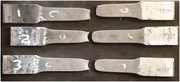
Figure 9. Flush end plate tensile test specimens after test Three fractured metal tensile specimens, labelled 1, 2, and 3, are arranged in rows with separated halves and visible necking. Three fractured metal tensile specimens are arranged horizontally in three rows, each specimen separated in... More about this image found in Flush end plate tensile test specimens after test Three fractured metal ...
in Novel demountable embedded bolted shear connectors in steel–concrete composite beams
> Proceedings of the Institution of Civil Engineers - Structures and Buildings
Published: 14 September 2026
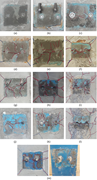
Figure 10. Failure modes of all the specimens: (a) PT1 (M12-5.6 25 MPa); (b) PT2 (M16-5.6 25 MPa); (c) PT3 (M20-5.6 25 MPa); (d) PT4 (M12-8.8 25 MPa); (e) PT5 (M16-8.8 25 MPa); (f) PT6 (M20-8.8 25 MPa); (g) PT7 (M12-10.9 25 MPa); (h) PT8 (M16-10.9 25 MPa); (i) PT9 (M20-10.9 25 MPa); (j) PT10 (M12-... More about this image found in Failure modes of all the specimens: (a) PT1 (M12-5.6 25 MPa); (b) PT2 (M16-...
in Novel demountable embedded bolted shear connectors in steel–concrete composite beams
> Proceedings of the Institution of Civil Engineers - Structures and Buildings
Published: 14 September 2026
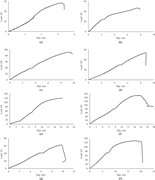
Figure 11. Force–slip curves of all composite specimens: (a) PT1 (M12-5.6 25 MPa); (b) PT2 (M16-5.6 25 MPa); (c) PT3 (M20-5.6 25 MPa); (d) PT4 (M12-8.8 25 MPa); (e) PT5 (M16-8.8 25 MPa); (f) PT6 (M20-8.8 25 MPa); (g) PT7 (M12-10.9 25 MPa); (h) PT8 (M16-10.9 25 MPa); (i) PT9 (M20-10.9 25 MPa); (j) ... More about this image found in Force–slip curves of all composite specimens: (a) PT1 (M12-5.6 25 MPa); (b)...
in Novel demountable embedded bolted shear connectors in steel–concrete composite beams
> Proceedings of the Institution of Civil Engineers - Structures and Buildings
Published: 14 September 2026
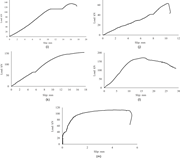
Figure 11. Continued Five graphs for specimens i to m show rising load with different peak levels, plateaus, and post-peak declines. Five line graphs labelled i to m plot Load in kilonewtons on the vertical axis against Slip in millimetres on the horizontal axis. Panel i has slip from 0 to 20 ... More about this image found in Continued Five graphs for specimens i to m show rising load with differe...
in Novel demountable embedded bolted shear connectors in steel–concrete composite beams
> Proceedings of the Institution of Civil Engineers - Structures and Buildings
Published: 14 September 2026
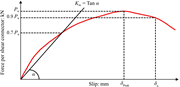
Figure 12. Key parameters of push-out tests, Eurocode 4 ( BSI, 2004 ) (Pu, ultimate force per shear connector; Ksc, reduced shear connector stiffness; δPeak, peak slip; δu, ultimate slip) A force per shear connector versus slip graph illustrates shear response, including initial stiffness, ultimate force, peak slip, and ultimate slip. The graph plots force per shear connector in kilonewtons on the vertical axis against slip in millimetres on the horizontal axis. A curved response starts at the origin, rises steeply at first, then rises more gradually to a rounded maximum at P subscript u before declining. Three horizontal dashed reference lines mark 0.7 P subscript u, 0.9 P subscript u, and P subscript u. A straight inclined line starts at the origin and intersects the response curve at 0.7 P subscript u. The angle between this inclined line and the horizontal axis is labelled alpha. The initial shear stiffness is labelled K subscript s c equals tan alpha. A vertical dashed line descends from the maximum response at P subscript u to the horizontal axis and is labelled delta subscript Peak. Farther along the descending branch, the curve intersects the 0.9 P subscript u horizontal dashed line. A vertical dashed line from this intersection descends to the horizontal axis and is labelled delta subscript u. More about this image found in Key parameters of push-out tests, Eurocode 4 ( BSI, 2004 ) (P...
in Novel demountable embedded bolted shear connectors in steel–concrete composite beams
> Proceedings of the Institution of Civil Engineers - Structures and Buildings
Published: 14 September 2026
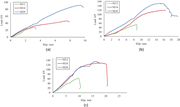
Figure 13. Force–slip envelope curves for composite connections with different bolt sizes: (a) grade 5.6-concrete 25 MPa; (b) grade 8.8-concrete 25 MPa; (c) grade 10.9-concrete 25 MPa Three graphs depicting load versus slip for M12, M16, and M20, showing different curves and trends across varyi... More about this image found in Force–slip envelope curves for composite connections with different bolt si...
in Novel demountable embedded bolted shear connectors in steel–concrete composite beams
> Proceedings of the Institution of Civil Engineers - Structures and Buildings
Published: 14 September 2026
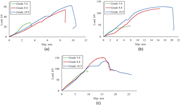
Figure 14. Force–slip envelope curves for composite connections with different bolt grade: (a) M12-concrete 25 MPa; (b) M16-concrete 25 MPa; (c) M20-concrete 25 MPa Three graphs compare load versus slip for three grades of fasteners, showing varying trends in loading capacity across different s... More about this image found in Force–slip envelope curves for composite connections with different bolt gr...
in Novel demountable embedded bolted shear connectors in steel–concrete composite beams
> Proceedings of the Institution of Civil Engineers - Structures and Buildings
Published: 14 September 2026
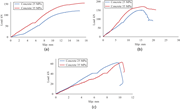
Figure 15. Force–slip envelope curves for composite connections with different concrete strength: (a) M16-8.8; (b) M20-8.8; (c) M12-10.9 Three graphs displaying load versus slip data for Concrete with compressive strengths of 25 MPa and 35 MPa, indicated by blue and red lines, respectively. Th... More about this image found in Force–slip envelope curves for composite connections with different concret...
in Novel demountable embedded bolted shear connectors in steel–concrete composite beams
> Proceedings of the Institution of Civil Engineers - Structures and Buildings
Published: 14 September 2026
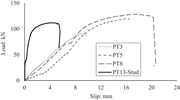
Figure 16. Comparison of force–slip curves of bolted shear connectors and welded stud A load versus slip graph compares P T 3, P T 5, P T 8, and P T 13 Stud, showing different peak loads and post-peak drops. The line graph plots Load in kilonewtons on the vertical axis against Slip in millimet... More about this image found in Comparison of force–slip curves of bolted shear connectors and welded stud ...
Journal Articles
Proceedings of the Institution of Civil Engineers - Structures and Buildings 1–14.
Published: 11 September 2026

