
1-20 of 20850
Keywords: ORNAMENTATION
Close
Follow your search
Access your saved searches in your account
Would you like to receive an alert when new items match your search?
Journal

Essential reading on the design and construction of civil engineering structures and its associated applied research.
Journal Articles
Proceedings of the Institution of Civil Engineers - Structures and Buildings 1–15.
Published: 18 September 2026
in Energy dissipation index for masonry walls with wallposts under vertical seismic effects
> Proceedings of the Institution of Civil Engineers - Structures and Buildings
Published: 18 September 2026
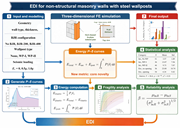
Figure 1. Research methodology adopted for development and validation of the proposed EDI framework A flow diagram presents 7 stages for deriving E D I for non-structural masonry walls with steel wallposts. The process begins with stage 1, input and modelling, covering geometry through wall ... More about this image found in Research methodology adopted for development and validation of the proposed...
in Energy dissipation index for masonry walls with wallposts under vertical seismic effects
> Proceedings of the Institution of Civil Engineers - Structures and Buildings
Published: 18 September 2026
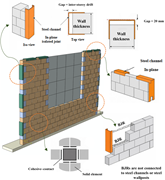
Figure 2. FE modelling procedure adopted for generation of the EDI database A schematic presents a masonry wall assembly with steel channels, in-plane isolated joints, B J Rs, and cohesive contact. The masonry wall contains an opening and steel channels attached along its edges. Enlarged d... More about this image found in FE modelling procedure adopted for generation of the EDI database A s...
in Energy dissipation index for masonry walls with wallposts under vertical seismic effects
> Proceedings of the Institution of Civil Engineers - Structures and Buildings
Published: 18 September 2026
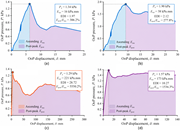
Figure 3. P–δ curves from four different wall layouts: (a) Int., L = 3 m, no WP, no BJR; (b) Int., L = 3 m, no WP, BJR-200; (c) Int., L = 5 m, WP-I, no BJR; (d) Ext., L = 5 m, WP + opening Four line graphs show O o P pressure against O o P displacement, with ascending and post-peak responses for panels a to d. The horizontal axes represent O o P displacement in millimetres and the vertical axes represent O o P pressure in kilopascals. Panel a records pressure increasing to a peak P u of 1.34 kilopascals at about 6 millimetres, then decreasing to about 0.60 kilopascals near 12 millimetres, rising slightly to about 0.70 kilopascals near 15 millimetres, and declining to about 0.56 kilopascals near 24 millimetres. E tot records 16 kilopascal millimetres, E D I records 1.97, and E post over E asc records 306.2 per cent. Panel b records pressure increasing to a peak P u of 1.90 kilopascals near 9 millimetres, then decreasing to about 1.50 kilopascals near 15 millimetres, rising to about 1.70 kilopascals near 20 millimetres, and declining to about 1.20 kilopascals near 27 millimetres. E tot records 38 kilopascal millimetres, E D I records 2.12, and E post over E asc records 277.8 per cent. Panel c records an early peak P u of 1.29 kilopascals near 6 millimetres, followed by a decline to about 0.60 kilopascals near 75 millimetres, a rise to about 0.95 kilopascals near 145 millimetres, and a gradual decline to about 0.72 kilopascals near 260 millimetres. E tot records 221 kilopascal millimetres, E D I records 28.72, and E post over E asc records 5550.2 per cent. Panel d records pressure increasing sharply to a peak P u of 1.57 kilopascals near 11 millimetres, decreasing to about 1.30 kilopascals near 22 millimetres, then remaining around 1.30 to 1.50 kilopascals through about 125 millimetres. E tot records 173 kilopascal millimetres, E D I records 10.27, and E post over E asc records 1536.3 per cent. More about this image found in P–δ curves from four different wall layou...
in Energy dissipation index for masonry walls with wallposts under vertical seismic effects
> Proceedings of the Institution of Civil Engineers - Structures and Buildings
Published: 18 September 2026
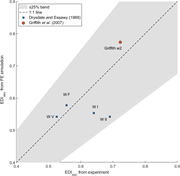
Figure 4. Validation of the proposed EDI calculation using experimental and FE-derived values A scatter plot compares E D I asc from experiment and F E simulation for 5 specimens against a 1 to 1 line and plus or minus 25 per cent band. The horizontal and vertical axes range from 0.4 to 0.9.... More about this image found in Validation of the proposed EDI calculation using experimental and FE-deri...
in Energy dissipation index for masonry walls with wallposts under vertical seismic effects
> Proceedings of the Institution of Civil Engineers - Structures and Buildings
Published: 18 September 2026
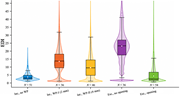
Figure 5. Violin plots with overlaid box plots of EDI by wall category A violin and box plot compares E D I distributions for 5 wall configurations, with sample sizes from 36 to 54. The vertical axis represents E D I and extends from 0 to above 50. Int., no W P records N 51, with a median ne... More about this image found in Violin plots with overlaid box plots of EDI by wall category A violin ...
in Energy dissipation index for masonry walls with wallposts under vertical seismic effects
> Proceedings of the Institution of Civil Engineers - Structures and Buildings
Published: 18 September 2026
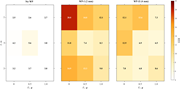
Figure 6. Mean EDI heatmap as a function of wall length (L) and vertical seismic acceleration (Ev) for interior walls (t = 100 mm). Contour lines are bicubic-interpolated from a 3 × 3 grid of computed mean values Three heatmaps compare E D I across E v values of 0, 0.5, and 1.0 g and L values of 3, 5, and 7 metres for 3 W P conditions. The heatmaps represent No W P, W P-1 at 2 millimetres, and W P-2 at 4 millimetres. For No W P, at L 7 metres, E D I records 2.5, 2.6, and 2.7 for E v values of 0, 0.5, and 1.0 g. At L 5 metres, the corresponding values record 4.2, 5.6, and 3.8. At L 3 metres, they record 3.2, 3.7, and 3.8. For W P-1 at 2 millimetres, at L 7 metres, E D I records 20.0, 14.0, and 12.1. At L 5 metres, the values record 11.8, 7.4, and 8.3. At L 3 metres, they record 14.9, 13.3, and 9.0. For W P-2 at 4 millimetres, at L 7 metres, E D I records 12.1, 13.6, and 7.3. At L 5 metres, the values record 12.9, 6.9, and 6.5. At L 3 metres, they record 7.8, 6.8, and 8.6. The E D I scale ranges from 4 to 22. More about this image found in Mean EDI heatmap as a function of wall length (L) and ve...
in Energy dissipation index for masonry walls with wallposts under vertical seismic effects
> Proceedings of the Institution of Civil Engineers - Structures and Buildings
Published: 18 September 2026
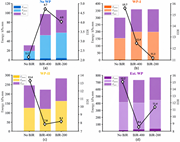
Figure 7. Stacked energy decomposition (Eelastic, Eplastic, Epost) by BJR detail and WP type; the three components sum to Etot = Easc + Epost, the numerator of the EDI integrated up to δf Four combined stacked bar and line graphs compare energy components and E D I for No B J R, B J R-400, and B J R-200. The energy axes use kilopascal millimetres and the secondary axes represent E D I. Each stacked bar comprises E elastic, E plastic, and E post. Panel a, No W P, records E D I values of 2.1 for No B J R, 4.7 for B J R-400, and 4.0 for B J R-200. Total energy records approximately 31, 97, and 105 kilopascal millimetres respectively. Panel b, W P-1, records E D I values of 15.7, 12.4, and 11.1, while total energy records approximately 295, 357, and 358 kilopascal millimetres. Panel c, W P-2, records E D I values of 13.4, 7.8, and 8.1, while total energy records approximately 245, 220, and 282 kilopascal millimetres. Panel d, Ext. W P, records E D I values of 15.2, 8.6, and 11.4, while total energy records approximately 785, 730, and 765 kilopascal millimetres. More about this image found in Stacked energy decomposition (Eelastic,
in Energy dissipation index for masonry walls with wallposts under vertical seismic effects
> Proceedings of the Institution of Civil Engineers - Structures and Buildings
Published: 18 September 2026
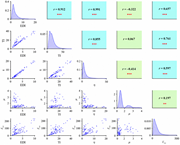
Figure 8. Scatter matrix of EDI, TI, η, μln and Etot A pair plot compares E D I, T I, eta, mu, and E tot using density distributions, scatter plots, and correlation coefficients. The pair plot forms a 5 by 5 matrix for E D I, T I, eta, mu, and E tot. Density plots along the diagonal represent the individual distributions. E D I has a sharp peak at low values and a long decline towards 20. T I peaks near its lower range and declines towards approximately 70. Eta has a narrow peak near its lower range and declines towards 50. Mu has its main peak near 1.5, followed by smaller peaks between approximately 2 and 3. E tot peaks near 0 and declines gradually towards 500. Scatter plots below the diagonal compare every pair of variables. E D I and T I generally increase together, and E D I and eta follow a closely increasing pattern. E D I and mu generally decrease as E D I increases, while E D I and E tot generally increase together. T I and eta generally increase together. T I and mu have widely scattered points without a clear increasing or decreasing pattern, while T I and E tot generally increase together. Eta and mu generally decrease together, while eta and E tot generally increase together. Mu and E tot have widely scattered points with a slight increasing pattern. Correlation panels above the diagonal quantify these relationships. E D I with T I records r 0.912 and 3 asterisks. E D I with eta records r 0.991 and 3 asterisks. E D I with mu records r negative 0.322 and 3 asterisks. E D I with E tot records r 0.657 and 3 asterisks. T I with eta records r 0.855 and 3 asterisks. T I with mu records r 0.067 without an asterisk. T I with E tot records r 0.761 and 3 asterisks. Eta with mu records r negative 0.414 and 3 asterisks. Eta with E tot records r 0.597 and 3 asterisks. Mu with E tot records r 0.197 and 2 asterisks. More about this image found in Scatter matrix of EDI, TI, η, μln...
in Energy dissipation index for masonry walls with wallposts under vertical seismic effects
> Proceedings of the Institution of Civil Engineers - Structures and Buildings
Published: 18 September 2026
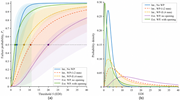
Figure 9. Lognormal fragility curves and probability density functions of EDI for all wall categories Two graphs show failure probability and probability density against E D I for 5 internal and external W P conditions. The panel a graph plots failure probability P f against threshold S in E... More about this image found in Lognormal fragility curves and probability density functions of EDI for a...
in Energy dissipation index for masonry walls with wallposts under vertical seismic effects
> Proceedings of the Institution of Civil Engineers - Structures and Buildings
Published: 18 September 2026
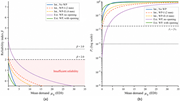
Figure 10. Reliability index ( β ) and failure probability (Pf) as a function of mean demand (μS) for all wall categories Two line graphs compare reliability index and failure probability against mean demand E D I for 5 W P conditions. The panel a graph plots reliability index beta against mean demand mu S in E D I from approximately 1 to 35. All 5 curves decrease as mean demand increases. Ext. W P, no opening starts highest near beta 3.7, crosses beta 3.0 near mean demand 1.5 and beta 2.0 near 4, then reaches 0 near 20. Int., W P-1, 2 millimetres starts near beta 2.2, crosses beta 2.0 near 1.5 and reaches 0 near 10. Int., W P-2, 4 millimetres starts near beta 1.9 and reaches 0 near 7. Int., No W P starts near beta 1.9 and reaches 0 near 4. Ext. W P, with opening starts near beta 0.8 and reaches 0 near 3. The horizontal reference lines mark beta 3.0 and beta 2.0, with the region below beta 2.0 identified as insufficient reliability. The panel b graph plots failure probability P f on a logarithmic scale from 10 to the power of negative 6 to 10 to the power of 0 against mean demand mu S in E D I from approximately 1 to 35. All 5 curves increase towards 10 to the power of 0 as mean demand increases. Ext. W P, no opening starts lowest near 10 to the power of negative 4 and rises more gradually than the other curves. Int., W P-1, 2 millimetres starts near 0.01, Int., W P-2, 4 millimetres starts near 0.03, Int., No W P starts near 0.05, and Ext. W P, with opening starts near 0.2. A horizontal reference line marks P f 2 per cent, and another marks 10 to the power of negative 3. More about this image found in Reliability index ( β ) and failure probability (P
in Energy dissipation index for masonry walls with wallposts under vertical seismic effects
> Proceedings of the Institution of Civil Engineers - Structures and Buildings
Published: 18 September 2026
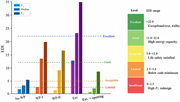
Figure 11. EDI percentile summary and proposed performance-level classification for each wall category A grouped bar chart compares P 15, median, and P 85 E D I values across 5 wall configurations and 4 performance thresholds. The vertical axis represents E D I from 0 to 35. No W P records P... More about this image found in EDI percentile summary and proposed performance-level classification for e...
in Energy dissipation index for masonry walls with wallposts under vertical seismic effects
> Proceedings of the Institution of Civil Engineers - Structures and Buildings
Published: 18 September 2026
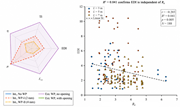
Figure 12. Normalised performance radar and EDI–Rp independence scatter plot for all wall categories Two panels show a radar chart of 5 E D I related metrics and a scatter plot of E D I against response modification factor R p. The radar chart compares E D I, T I, eta, mu, and E tot for internal No W P, internal W P-1 at 2 millimetres, internal W P-2 at 4 millimetres, external W P with no opening, and external W P with opening. External W P with no opening extends furthest across E D I, T I, eta, and E tot, and also reaches a high mu value. Internal W P-1 forms intermediate values, while internal W P-2 remains closer to the centre across most metrics. The scatter plot compares E D I from 0 to 12 against response modification factor R p from 1 to 7 for L 3 metres, L 5 metres, and L 7 metres. The points spread broadly, with most observations between R p 2 and 5 and E D I 1 and 6, while several L 5 metre observations extend above E D I 9. The linear fit decreases from about E D I 4.4 near R p 1.5 to about 2.0 near R p 6.2. The statistics record r negative 0.203, R squared 0.041, P 0.005, and N 188. More about this image found in Normalised performance radar and EDI–Rp indepen...
Journal Articles
Proceedings of the Institution of Civil Engineers - Structures and Buildings 1–15.
Published: 14 September 2026
in Novel demountable embedded bolted shear connectors in steel–concrete composite beams
> Proceedings of the Institution of Civil Engineers - Structures and Buildings
Published: 14 September 2026
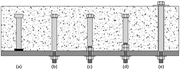
Figure 1. Types of shear connectors in steel–concrete composite beams: (a) welded stud; (b) bolts without embedded nuts; (c) bolts with single-embedded nuts; (d) bolts with double-embedded nuts; (e) friction-grip bolts Illustration of a series of bolts attached to a concrete structure, labelled... More about this image found in Types of shear connectors in steel–concrete composite beams: (a) welded stu...
in Novel demountable embedded bolted shear connectors in steel–concrete composite beams
> Proceedings of the Institution of Civil Engineers - Structures and Buildings
Published: 14 September 2026
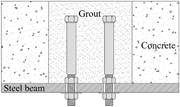
Figure 2. The steel–concrete composite connection where single-nut embedded bolted shear connectors are applied and grouted A schematic of two bolted shear connectors shows grout surrounding the connectors above a steel beam within concrete. The schematic shows a steel beam along the bottom wi... More about this image found in The steel–concrete composite connection where single-nut embedded bolted sh...
in Novel demountable embedded bolted shear connectors in steel–concrete composite beams
> Proceedings of the Institution of Civil Engineers - Structures and Buildings
Published: 14 September 2026
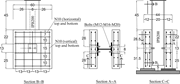
Figure 3. Geometric details of test specimens (dimensions in cm) Three sectional drawings show the reinforced concrete and I P B 200 steel beam connection with bolts, reinforcement, supports, and dimensions. Three technical drawings are labelled Section B B, Section A A, and Section C C. Secti... More about this image found in Geometric details of test specimens (dimensions in cm) Three sectional d...
in Novel demountable embedded bolted shear connectors in steel–concrete composite beams
> Proceedings of the Institution of Civil Engineers - Structures and Buildings
Published: 14 September 2026
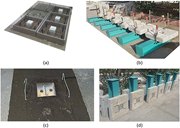
Figure 4. Preparation of push-out specimens: (a) concrete slab formworks during concreting; (b) assembly of push-out specimens; (c) bolts fastened inside these holes for testing; (d) push-out specimens prepared for testing Four views document preparation and assembly stages of reinforced concre... More about this image found in Preparation of push-out specimens: (a) concrete slab formworks during concr...
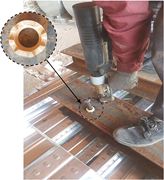
in Novel demountable embedded bolted shear connectors in steel–concrete composite beams
> Proceedings of the Institution of Civil Engineers - Structures and Buildings
Published: 14 September 2026
Figure 5. Welding studs to the steel beam flange A worker uses a handheld installation tool on a steel plate, with an inset highlighting the circular fitting around the installed fastener. The worker operates a handheld installation tool vertically over a steel plate while wearing a protective... More about this image found in Welding studs to the steel beam flange A worker uses a handheld installa...

